EAGLE COMPLIANCE, LLC
Business Consulting
July 22, 2024
Rate Cut Coming, Just Not Now
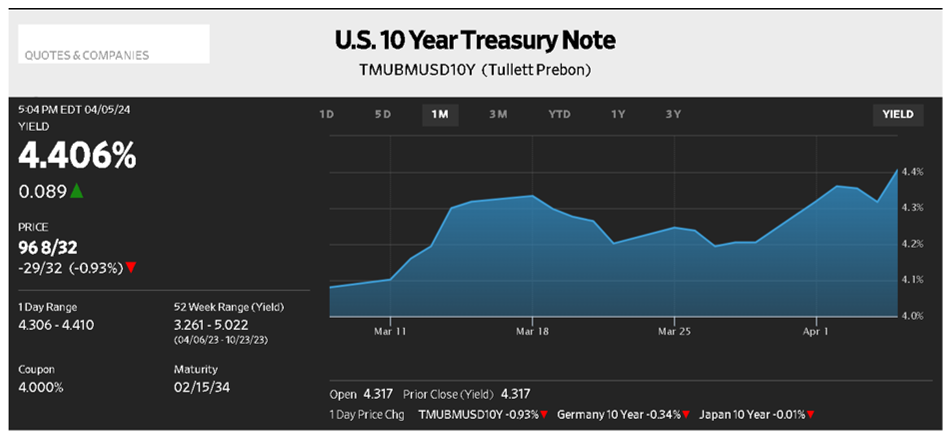
That was the message from Chairman Jay Powell last Monday in a speech before the Economic Club in Washington DC. “I’m not going to be sending any signals one way or another on any particular meeting. We’re going to make these decisions meeting by meeting.” That captures the consistent theme of the Chairman but after reports of a tighter labor market and improving inflation data the market has a 2% chance of a rate cut at the conclusion of the July 30-31 meting but a 98% chance after the September 17-18 meeting which is the last one before the November 5 election.
Support for that view could come this Friday with the Fed’s preferred inflation gauge expected to show core PCE flat at 0.1% and down 0.1% y/y to 2.5%.

Anticipation of that news did little for the markets last week as the DJIA was the only major index to show a gain while the S&P 500 was down 6% and the tech heavy Nasdaq dropped 3.6%. Their down week was already in place before CrowdStrike, a provider of malware and virus protection software filed a system update that knocked out service to millions of Microsoft Windows users affecting banks, media services, and airlines. On the day, CRWD was down 11.10%.
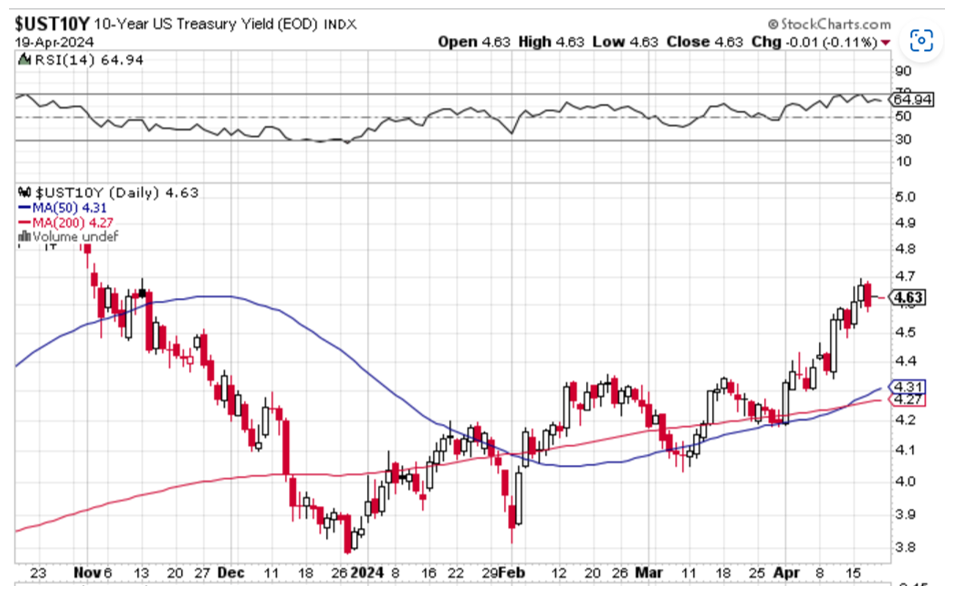
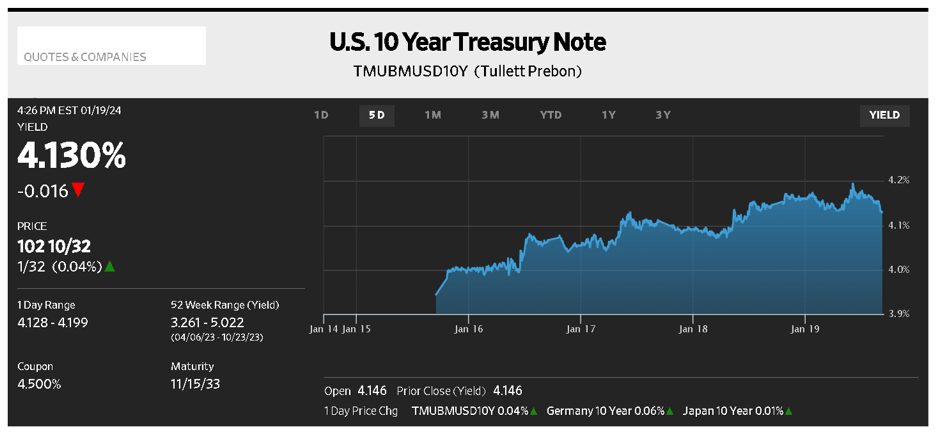
Rates didn’t fare much better as a mid-week move to 4.15% couldn’t hold and the benchmark ten-year note faded to 4.24% on Friday, 6 bps higher than when the 504 programs July debentures were priced.
As ten-year rates have declined slightly since the June 27 Presidential debate short-term rates have outperformed in what market participants call the “Trump trade” because if elected, tax cuts are expected to be extended and pro trade tariffs introduced. Combined with probable interest rate cuts and an increased need for Treasury financing the result should be a steeper yield curve. Since the debate the 2/10 curve has moved from -49 bps to -28 bps.
Hard to Rollover
It is estimated that as many as $260 billion commercial real estate loans, many of which had triple-A ratings, are coming due in a higher rate environment with tighter credit conditions. Their category is SASB (single asset, single borrower) and was considered very safe as evidenced by their bond rating. A WSJ article states the rate of loans at or near default has nearly tripled over two years to 8.7% in 2024.
The article noted the financial models behind the ratings never forecast property prices falling below the value of the debt but the pandemic, higher interest rates, and a work from home environment has resulted in many near vacant buildings.

The Week Ahead
No Fedspeak in the blackout period ahead of the FOMC meeting, an active week for Treasury with 2Q2024 GDP plus Personal Income and PCE.
Monday – Treasury sells $146 billion 13 & 26 week Bills.
Tuesday –Treasury sells $69 billion two-year Notes, Existing Home Sales.
Wednesday –Treasury sells $70 billion five year Notes and $30 billion two-year FRN’s, New Home Sales.
Thursday – Treasury sells $44 billion seven year Notes, 2QGDP forecast at 1.9%, Durable Goods estimate is 0.6%.
Friday – Personal Income expected to decline to 0.4% and core PCE forecast at 0.1% and 2.5% y/y.
July 15, 2024
A Matter of Focus
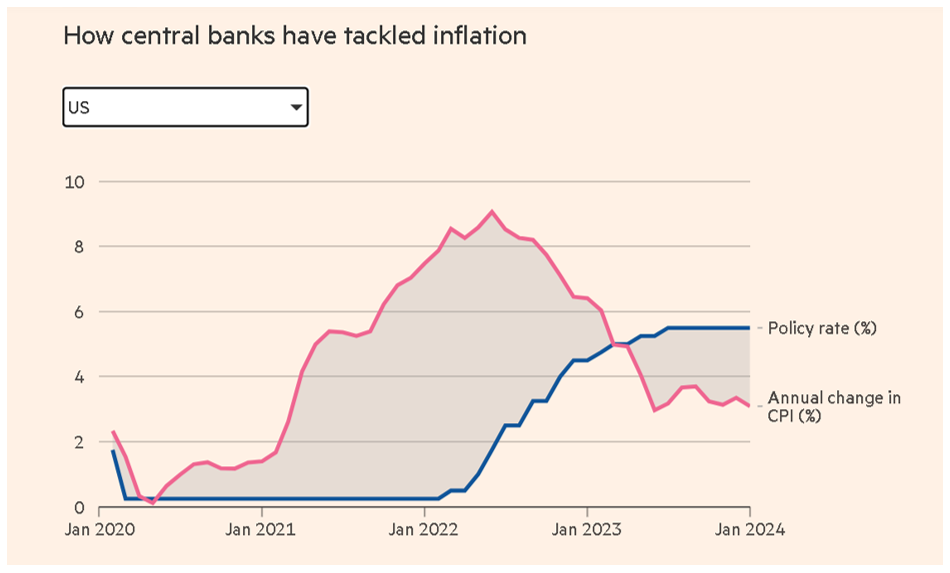
As we moved through the July 2024 Debenture offering market conditions stabilized and then improved significantly the morning of pricing with the release of the June CPI report. On Tuesday and Wednesday of the week FOMC Chairman Powell testified before the House Financial Services Committee. In his commentary, he walked a delicate line, reiterating fear that lowering interest rates too late or too little could put the economy and the labor market at risk, while recognizing that cutting rates too soon or too much could equally stall or reverse the disinflationary progress already achieved. He was clear that more good data was needed to instill the needed confidence to justify a rate cut, but he also emphasized that the FOMC was ready and willing to respond if it witnessed unexpected weakening. Market participants who have been, and remain, anxious for the Fed to adjust policy sooner rather than later choose to largely focus upon the “ready and willing to respond” portion of the Chairman’s comments. Last Friday’s Non-Farm/Employment report revealed significant downward revisions in the labor market; that data coupled with Thursday’s release of the CPI report (unexpected 0.1% decline for June (1st monthly decline since May 2020) and CPI year-over-year at 3.0%) was enough to convince market participants that a rate cut by the FOMC in September was all but a done deal. By late morning Thursday, the probability of a July rate cut remains a minimal 9%, while the probability of a rate cut in September was priced in at 85% (see charts below, updated through Friday, July 12, 2024) and 10-Year Treasury Notes rallied to yield 4.17%.

Investor response to the $7.9 million 10-Year, $17.4 million 20-Year, and $469.4 million 25-Year 504 offerings was quite positive and resulted in spread narrowing from initial indications on all issues: on the 10-Year from +65 bps to +63 bps, on the 20-Year from +73 bps to +71 bps and on the 25-Year from +73 bps to +71 bps. Light new issue competing supply in the agency commercial mortgage-backed-securities market was again a contributing factor. The July debenture rates of 4.75% for the 10-Year and 4.89% for both the 20-Year and 25 Year are the lowest debentures rates priced since May of 2023. The 25-Year rate is 50 bps under the program life average of 5.39% and the spread over Treasury (+71) continued to contract (2 bps m/m) and was 8 bps below its program life average of T+79. Participation by various investor types was spread evenly, a healthy sign for the program with money managers, insurance companies, and banks continuing to participate, reinforcing the diversity of the account base for the 504 program.
The Week Ahead
Monday - Treasury sells $146 billion 13 & 26 week Bills
Tuesday - Business Inventories (May), Import Price Index (June), Export Price Index (June), NAHB Housing Mkt Index (July)
Wednesday - Treasury sells $13 billion 20-year Bonds, Industrial Production (June), Capacity Utilization (June), Housing Starts (June), Building Permits (June), Beige Book
Thursday - Treasury sells $19 billion 10-year TIPs, Initial Jobless Claims, Philadelphia Fed Business Outlook Index (July)
July 8, 2024
Revisions Rule
Downward revisions of 111,000 for April and May offset the higher than expected 206,000 number for June’s job growth allowing the bond market to push rates lower and keeping stocks at their record highs.
After a poor reaction to the previous week’s consensus level PCE data that pushed rates higher by 20 bps a weaker than expected ISM Services number, plus a weak Factory Orders number helped rates recover ahead of Friday’s report which should lend support to a September rate cut. Post the jobs report trade activity was muted due to the holiday weekend, but even though there has been little follow through to recent inflation and jobs data the trend is encouraging as economic activity is slowing in response to higher interest rates and a slightly tighter jobs market.
At 4.28% the benchmark ten-year Note is just 3 bps below where the June 504 debentures were priced and credit spreads in the ACMBS market remain stable.

Jobs
Job creation continues to be driven by the Health Care, Government and Travel & Leisure sectors that have been responsible for 1.7 million of the 2.7 million jobs created over the last year. In addition to unemployment rising to 4.1% the 3.9% average hourly earnings increase y/y was the smallest since 2021 and is another indication the economy is cooling as inflation improves.
These considerations will not force the Fed to act before they are assured inflation will not reignite and that was mentioned by Mary Daly, President of the San Francisco Fed and voting member of the FOMC, “I don’t want to pull up too short or too early and then have inflation stay high. That’s a terrible, terrible situation. I refuse to do that.”
The Week Ahead
A busy week with active Fedspeak as Chairman Powell appears before Congress, the quarterly Treasury refunding, and more inflation data that should be helpful.
Monday –Treasury sells $140 billion 13 & 26 week Bills.
Tuesday – 504 program announces its July debenture sales, Treasury sells $58 billion three-year Notes, Jay Powell testifies before the Senate.
Wednesday – Treasury sells $39 billion ten-year Notes, Jay Powell speaks to the House.
Thursday – 504 program prices its July debentures, CPI forecast at 0.1% and 3.1% y/y, Treasury sells $22 billion thirty year Bonds.
Friday – PPI forecast at 0.1% and 3.2%.
July 1, 2024
Unexpected
After marking time while waiting for Friday’s Personal Income and PCE data the market got consensus level numbers and shrugged them off. Personal Income came in at 0.5%, a bit higher than expected and the PCE price index was 0.0% (down from 0.3%) and 2.6% y/y, down 0.1%. Market reaction disinverted the 2/10 curve to -35 bps as CT-10 moved 12 bps higher on the week to close at 4.39% with more supply in that maturity not due until next week.
It does seem unusual that with a 72% probability of a rate cut at the Fed’s September meeting the rate for the ten-year benchmark is 42 bps higher since January 1.

With that inflation data out of the way the market will now wait for this holiday shortened week to provide jobs data on Friday after a JOLTS report (Job Openings and Labor Turnover Survey) on Tuesday and the ADP private payroll figures on Wednesday. These reports may complement the improving inflation data to influence the Committee as it receives more PCE data just ahead of its next meeting on July 30-31, though no action is expected at that meeting. As mentioned, the September meeting is targeted as it is the last meeting before the November 5 election.
Other Data
- The Conference Board reported an uptick in Consumer Confidence after a downward revision.
- Durable Goods orders were 0.1% vs. 0.7% in April.
- 2Q2024 GDP was revised to 1.4%.
- Case Schiller Home Price Index was +0.4% and 7.2% y/y.
- - New Home Sales were sharply below consensus at 635K annualized.
Those last two items illustrate continued price appreciation and mortgage rates above 7% are central to a Morgan Stanley report that identifies two thirds of all outstanding mortgages have a rate less than 4% creating a “lock in” effect for homeowners to stay put to enjoy their low cost of finance while benefitting from accumulated price appreciation.
This Harvard University chart shows the gap that has resulted from higher interest rates over the last four years reducing supply and limiting affordability in a sector of the economy that normally accounts for 3-5% of US output.

The Week Ahead
Some Fedspeak, including Chairman Powell, a light week for Treasury and Friday’s jobs report for anyone not enjoying a long holiday weekend.
Monday – Treasury sells $140 billion 13 & 26 week Bills, ISM Manufacturing report.
Tuesday – Jay Powell speech in Portugal.
Wednesday – Factory Orders expected to be 0.3%.
Thursday – Happy Independence Day!
Friday – Non-Farm Payroll forecast at 195,00 with 4% Unemployment.
June 24, 2024
A Quiet Week
A holiday shortened week left bonds and stocks pretty much where they started the week with some economic reports, Retail Sales in particular, affirming some concern about consumer spending. At 0.1% with April revised down to -0.2% spending was curtailed by high prices even though the price of gasoline declined $.14 per gallon to $3.45. Analysts attribute this weakening trend to a cautious consumer looking for relief from high interest rates.

Another indication of consumer caution is the third consecutive month of declining Existing Home Sales that were down 0.7% on the month and 2.8% y/y. High mortgage rates (6.87%), low inventory, and rising prices are the cause of this conundrum for home buyers. This National Association of Realtors chart shows the national median price of a home to be $419,300 in May, a 50% increase from when the pandemic began in March 2020. That four-year increase almost doubles the 27% increase in existing sale prices for the four years prior to the pandemic and illustrates the cumulative impact of inflation resulting from a 525 bps increase in the cost of money.

As quiet as last week was, this week contains the potential for some volatility with the second revision for 1QGDP and Friday’s release for Personal Income and Personal Consumption Expenditures. The latter is the Fed’s preferred inflation gauge and is expected to decline monthly and y/y.
The Week Ahead
Heavy Fed speak and Treasury issuance with PCE on Friday and Consumer Confidence reports from both the Conference Board and the University of Michigan.
Monday – Treasury sells $140 billion 13 & 26 week Bills.
Tuesday – Consumer Confidence from the Consumer Board and Treasury sells $69 billion 2-year Notes.
Wednesday – Durable Goods and Treasury sells $70 billion 5-year Notes and $28 billion 2-year TIPS.
Thursday – Jobless Claims, second revision of 1QGDP expected to be 1.3%, and Treasury sells $44 billion 7-year Notes.
Friday – Personal Income expected to increase to 0.4% and PCE forecast at 0.0% and 2.6% y/y, U of M Consumer Confidence survey.
June 17, 2024
Dot Plot vs. Data
Starting with the May CPI numbers that were modestly better than expected, Wednesday was an active day for the markets as the Fed did as expected by announcing no change to policy, but with a hawkish tone to the announcement and Chairman Powells’s press conference. Their “dot plot” projects just one rate cut for 2024, down from three when last disclosed in March, but the rates market assigned a 64% chance of two cuts this year anyway and that optimism reduced the benchmark ten-year rate by 11bps to 4.32%.
That leads to the short term vs. long term perspective that identifies the difference in the Fed’s “dot plot” projections and what the market expects. Since policy is data dependent the Fed plan may change but whether there is one or two cuts this year the longer term projection of nine rate cuts over three years is unchanged.
| Year | Previous | Current |
|---|---|---|
Thursday’s PPI report was sharply lower than expected with the May number at -0.2% vs. a +0.1% consensus and with the y/y rate of 2.2% also lower than expected. That pushed the bond rally further to 4.24%, a closing level not seen since March 30, and through the 50 and 200-day Moving Averages for the benchmark. Here is the end of week close, 20 bps lower on the week and reflective of how the market is more focused on data than a dot plot.

The next FOMC meeting ends July 31 and though there is an 88% probability there will be no rate cut the market now expects there will be at least two by year end. There will be three CPI reports before the September 8 FOMC meeting that is the last one scheduled before the November 5 election, so that meeting is attracting attention for a potential policy change for obvious reasons.
Fifteen of nineteen FOMC members expect the Fed will cut rates this year and that group is evenly split between one and two cuts, meaning the next three CPI reports and PCE reports will be crucial for policy decisions.
Other Central Banks
- Bank of Japan has announced it plans to significantly cut back its bond buying program as it unwinds its easy money policy while reducing its balance sheet. Compared to the overnight funds rate in the US of 5.25-5.50% the BoJ rate is zero to 0.1%.
- Bank of England Policy Committee meets Thursday with central banks in Australia, Norway and Switzerland also meeting.
The Week Ahead
Fed speak has resumed, a light calendar for reports and Treasury.
Monday – Treasury sells $140 billion 13 & 26 week Bills.
Tuesday – Treasury sells $13 billion 20-year Bonds, Retail Sales forecast at 0.2% and Industrial Production consensus is 0.4%.
Wednesday – Federal holiday for Juneteenth.
Thursday – Treasury sells $21 billion 5-year TIPS.
Friday – Manufacturing PMI is released.
June 10, 2024
Market conditions were favorable, and improved, as we moved through the June 2024 504 debenture offering. The Thursday prior to the announcement 10-Year Treasury Notes yielded 4.56%. However, subsequent releases of a mildly weaker consumer spending report, an as expected Personal Consumption Expenditures report (little progress in the Fed’s Fight Against Inflation), and a weaker ISM Manufacturing Index report (45.4 vs. an expected level of 49.5 (a 3-month low)) caused Treasury yields to decline significantly. At pricing (following Thursday morning) the 10-Year Treasury Note yield had declined 25.5 basis points to 4.305%. This despite comments from several Fed officials including Minneapolis Fed President Neel Kashkari that “many more months of positive inflation data, I think, [are needed] to give me confidence that it’s appropriate to dial back [policy]”; and despite the impending release of the closely watched U.S. employment report due out the following morning. That report proved stronger than expected as nonfarm payrolls rose by 272k in May, surpassing the 180k gain expected marking the largest gain in two months. This caused an immediate upward spike in interest rates (see chart below). The good fortune of having priced the June 504 offerings 1-day earlier saved small business borrowers approximately 12 bps.

Investor response to the $16.4 million 20-Year and $388.5 million 25-Year 504 offerings was quite positive and resulted in spread narrowing from initial indications on both issues; on the 20-Year from +78 bps to +75 bps and on the 25-Year from +75 bps to +73 bps. Light new issue competing supply in the agency commercial mortgage-backed-securities market was certainly a contributing factor. The June 25-year debenture rate, at 5.04%, was 20 bps below May. The rate is 35 bps under the program life average of 5.39% and the spread over Treasury (+73) continued to contract (2 bps m/m) and was 6 bps below its program life average of T+79. It was pleasing to observe that spread-driven money managers who had recently expressed mild concern over narrowing spreads purchase almost 40% of the 25-Year offering. These buyers are typically very competitive and vigorously analyze investment alternatives.
June 3, 2024
As Forecast, Mostly
The event of the week was Friday’s Personal Income and PCE report that came close to forecast, helping interest rates recover and for stocks to close the month in positive territory.
Personal Income was 0.3% and 2.7% y/y with the core reading also unchanged at 2.8%. What was lower than expectations was Personal Spending. At 0.2% it was below its forecast of 0.3% and down from 0.7% in April with analysts speculating consumers are showing the effect of years of inflation on their savings.
This Factset chart shows the decline in the Chicago Purchasing Managers survey with its current weak reading of 35.4 in May almost matching its recent low during the pandemic.
Additionally, this report followed Thursday’s second revision of 1Q2024 GDP at 1.3%, down from its previous reading of 1.6% with expectations it could drop even lower.
Neither the PCE report nor a regional PMI report will cause any change in policy at the June 12 FOMC meeting, but they do reflect signs of a consumer slowdown which could complicate Fed policy decisions. Friday’s jobs report will be the next significant report ahead of that meeting.

A Poor Start to the Week
Hawkish Fedspeak and weak demand for almost $184 billion of two, five, and seven year Treasury Notes began the week by pushing rates higher as fears of a more restrictive Fed took hold. The benchmark ten-year Note yielded as much as 4.61% before closing the week at 4.50%. This risk off attitude carried over into stocks as the market assigned a slightly better than 50% chance of a rate cut in September, the Committee’s last meeting before the November 5 election.
Inverted Curves & Recessions
The Treasury curve inversion that began four months after the Fed began raising rates in March 2022 was expected to herald a recession, but analysts now are questioning how accurate that concept is. This Federal Reserve Bank of St. Louis chart shows the curve’s status at -68 bps but with consistent job growth and 1Q2024 GDP at 1.3% risk of a recession has been fading. Though GDP has been declining, Friday’s jobs report is expected to match the April number of 175,000 with the unemployment rate unchanged at 3.9%.

Recent weakness in equities seems as much related to markets being overpriced as to an economic slowdown but identifies why the bank is being cautious about cutting rates while inflation remains above its target level. Some Fed officials like Neel Kashkari, President of the Minneapolis Fed, suggest the neutral rate may be higher than it was before the pandemic and the market could tolerate a higher rate than 5.50%. That balance of selecting a rate that neither spurs nor slows growth is the dilemma faced by the Fed.
The Week Ahead
Fedspeak takes a pause ahead of the FOMC meeting, the 504 program prices its June debentures, a light week for Treasury, and the jobs report is the main event.
Monday – Treasury sells $140 billion 13 & 26 week Bills.
Tuesday – 504 program announces its June debenture sale, Factory Orders forecast at 0.7%.
Wednesday – ISM Services expected to increase.
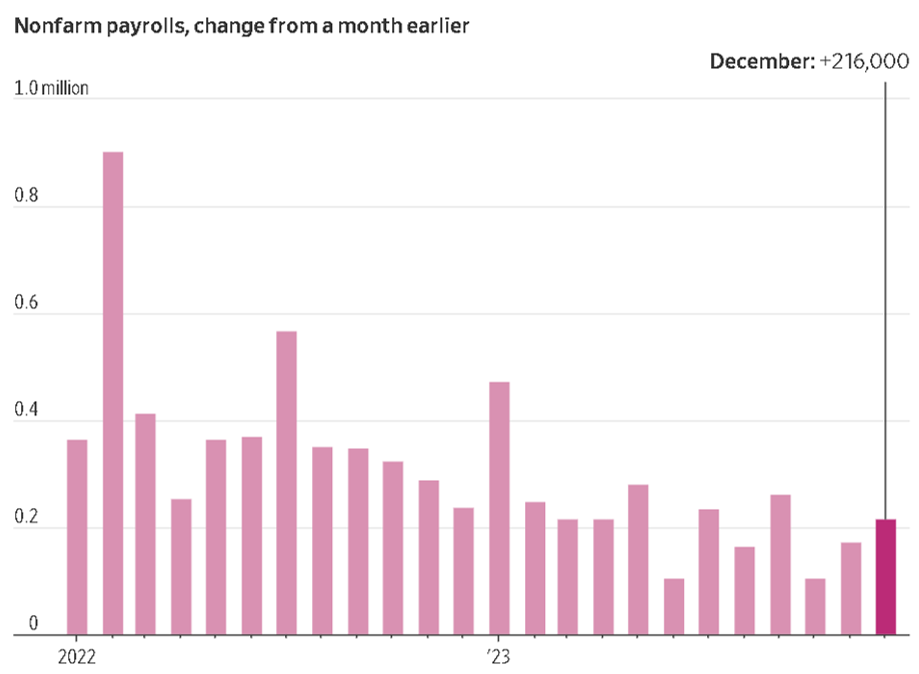
Thursday – 504 program prices its June debentures, Jobless Claims expected to be flat at 216,000.
Friday – Non-Farm Payroll consensus is 175,00 with unemployment unchanged at 3.9%.
May 28, 2024
Reduced Volatility
A quiet week leading up to a holiday weekend ahead of the next piece of inflation data on Friday. PCE is what the Fed watches most closely and is expected to decline to 3.7% y/y. Both equities and rates moved sideways with the rates markets seeing reduced supply and a light number of economic reports. Closing the week at 4.48% the ten-year benchmark is flat with where it was for the 504 program’s May debenture pricing.
MOVE is the Merrill Option Volatility Index that is a measure of market expectations for future volatility and this declining trend is a positive for ACMBS products supporting risk and credit spread tightening.

Fed Minutes Disappoint
Rate cut expectations and stocks buoyancy both subsided Wednesday as minutes of the May meeting identified Fed concerns about persistent inflation and the timing of rate cuts. The previous month’s minutes singled out the sticky inflation numbers and that perception remains in place as sentiment for a rate cut has been reduced to one later this year.
Not Everyone is Cutting Rates
After eight years of negative interest rates the Bank of Japan is withdrawing its support of bond purchases as its ten-year Note now yields 1%, its highest rate since 2013 and after it was as low as -0.30% as recently as four years ago.
This tighter policy is directed at support for the Yen which had slid to its weakest level in 34-years.

The Week Ahead
More Fespeak, an active Treasury calendar, and Personal Consumption Expenditures on Friday.
Tuesday – Treasury sells $140 billion 13 and 26 week Bills, $69 billion 2-year Notes and $70 billion 5-year Notes.
Wednesday – Treasury sells $44 billion 7-year Notes and $28 billion 2-year FRN’s.
Thursday – 1QGDP expected at 1.6%.
Friday – Personal Income and Personal Consumption Expenditures.
May 20, 2024
Rally Continues
Weaker employment data coupled with lower than expected core CPI numbers have helped markets move up rate cut expectations to as soon as July. This stockscharts.com chart shows how the benchmark 10-year Note has returned to its 50-day Moving Average after having briefly touched its 200-day Average of 4.33% last Thursday.
As strong as this response has been equities have hit record levels with the DJIA closing above 40,000 for the first time in history, helped by a core CPI rate of 3.6% that was its lowest annual rate since April 2021, and following three months of stronger than expected numbers.
While not declining as fast as desired, Wednesday’s release at least suggests prices and economic activity are not reaccelerating, something a flat Retail Sales number helped to support.

It was a very active week for Fed officials led by Chairman Powell who stated that” by many meany, many measures” interest rates are high enough to slow demand as he repeated the Committee will have to see where the data fall out and people should not focus on one release but look at economic data in the aggregate.
One out of Three Not Enough
This chart shows how the main components of the Fed’s preferred inflation gauge have performed with the cost of housing and services still elevated with housing being the most stubborn. To get to 2% inflation the Fed does not need for each category to reach that level but housing at its current level of 5.6% in March does need to decline to the 3-3.5% area.
Mortgage rates that have been as high as 8% have been a deterrent to homebuyers so they have turned to renting and those rates have been slower to decline, possibly lengthening the time it takes to impact overall inflation.
The core PCE rate in March was 2.8% and the April report is scheduled for May 31.

The Week Ahead
Active Fedspeak continues, a light week for Treasury and economic reports.
Monday – Treasury sells $140 billion 13 & 26 week Bills.
Wednesday – Treasury sells $16 billion 20-year Bonds, Minutes of the May FOMC meeting are released.
Thursday – Treasury sells $16 billion 10-year TIPS, Jobless Claims and New Home Sales.
Friday – Durable Goods expected to be -0.5% and University of Michigan Consumer Sentiment.
May 13, 2024
Market conditions were favorable for the May 2024 504 debenture offering. Treasury yields had been on the rise between offerings from stronger economic data and consequent reduced chance of Fed rate cuts this year. The Friday before announcement, however, non-farm payroll gains were weaker than expected. On Thursday morning, before pricing, the CPI data came in as expected. Treasury coupon supply was not disruptive and there was no serious competing supply in our agency CMBS market.
Bank investors in the 504 offerings had been pretty scarce. especially after SVB and Signature Banks failed last March. Fed tightening led to sharply rising bank funding costs while more seasoned fixed rate assets in bank portfolios continued to pay low coupons. Some bank failures resulted as this negative carry punished banks. In recent months, however, banks have been repairing balance sheets while the Fed stopped tightening. As a result, more banks returned to the 504 debenture offerings. Banks took a substantial 44% of the May 25-year debenture pool.
Insurance buyers have been strong participants with the regular availability of higher 504 pool coupons, thanks to that rough bear cycle in interest rates. In the May offering, insurance buyers took a notable 40% of the 25-year pool.
That left spread-driven money managers to take just 16% of the 25-year pool this month. These buyers are critical to cover the deals when banks and insurance investors pull back. But they require a competitive spread to other products to be enticed to buy. As bank and insurance company buyers stepped up in the past six months, and benchmark comparable markets rallied in spread (agency MBS and agency CMBS), underwriters were able to place the 504 debenture pools at steadily tightener spreads to Treasury, from +115 bp in November to +75 bp in May for the 25-year maturity.
As we move toward summer, both the benchmark 504 debenture rate and spread have returned to right around 504 program lifetime averages as seen in the table below:

It’s fitting to return to program lifetime averages as Eagle changes guard in Selling Agents from me, Steve Van Order, to Glenn Doran starting in June. It has been my honor and pleasure to serve all of you in the 504 program for nearly 17 of the past 23 years, as I managed 199 debenture sales.
My successor, Glenn Doran, is a leading expert in federal agency finance. For many years Glenn ran all funding programs for the nationwide Federal Farm Credit Bank System, currently with $416 billion in debt outstanding. Glenn retired from Farm Credit at the end of April. Please join me in welcoming Glenn. Frank Keane, program Fiscal Agent since 2012, will continue to be your very expert and steady hand. Frank and Glenn will make a very strong team for years to come.
May 6, 2024
Fewer Jobs, Weaker Wage Growth
- 175,000 new jobs vs. a 240,000 forecast
- The unemployment rate rises to 3.9%
- Average hourly earnings rise just 0.2%, and decline to +3.9% y/y
- The benchmark ten-year rate drops 16 bps
- Stocks rallied to end the week higher, after having been weaker in previous sessions
- Traders increase expectations to two rate cuts this year
The markets recovered from a weak tone that had been set on Tuesday when the Employment Cost Index was higher than forecast at 1.2%, adding to inflationary pressures that the previous week’s PCE report had already established. At that point, ten-year Treasuries were higher by 38 bps on the month and the more policy sensitive two-year Note had reached 5%.
Supply
This stickier than expected inflation has amplified concern over the budget deficit and Treasury financing that is needed at a time when some auctions for longer dated maturities have seen reduced demand.
Some relief was provided Wednesday when Treasury announced plans to sell $1 trillion of bonds from May to July but said it would hold auction sizes steady. Additionally, they would cut by more than half the runoff from their balance sheet, to $25 billion per month from $60 billion.
As seen below the ten-year benchmark is 6 bps lower than when the 504 program priced its April debentures and this week’s sale will occur during the Treasury’s quarterly refunding for 3, 10 and 30 year auctions, but with a light ACMBS calendar.

FOMC
Resigned to fewer rate cuts than hoped for the FOMC meeting that concluded on Wednesday was as expected, no policy change but with a Jay Powell comment that soothed the market: “it’s unlikely the next policy move will be a hike.” As mild as that seems it did counter some analysts’ expectations that another 25 bps increase could happen.
Mr. Powell believes a soft landing for the economy is possible and though it is taking longer than thought there is a better balance of achieving the Committee’s employment and inflation goals. It is that balance that was supported by the jobs report that showed leisure and hospitality hiring slowed to 5,000 jobs in April from 53,000 in March. Coupled with food-service providers reports from Heinz and Starbucks showing increased caution among consumers Starbucks was as an outlier in Friday’s rally as its share price declined 15.9% on the week due to reduced demand in comparable store sales in the US and China.
The Week Ahead
Fedspeak resumes, the 504 program prices its May debentures, Treasury is active and few reports other than jobless claims.
Monday – Treasury sells $140 billion 13 & 26 week Bills.
Tuesday – 504 program announces its May debenture sale, Treasury sells $58 billion 2-year Notes.
Wednesday – Treasury sells $42 billion 10-year Notes.
Thursday – 504 program prices its May debentures, Treasury sells $25 billion 30-year Bonds, Jobless Claims.
April 29, 2024
Tech Rebounds
A week that saw Treasury rates inch higher to 4.67% on the ten-year benchmark saw equities rally sharply after Microsoft and Alphabet beat estimates with their Thursday night releases. The Friday rally came despite another round of inflation data suggesting it remains higher than the Fed would like, yet it is not accelerating.

Close Enough
Personal Income was as forecast at 0.5% as was the monthly inflation rate of 0.3%, but the y/y rate of 2.7% was +0.2% above the February level, another reminder of how sticky inflation has become. Money markets are now pricing in only one rate cut this year, possibly as late as December, which is a big change from earlier this year when as many as six cuts were expected.
Orderly
It should not be a surprise that Treasury rates rose last week as the market absorbed $183 billion worth of Note auctions. Of the three maturities the $69 billion two-year Note was most in demand, attracting $182 billion in bids on Tuesday while demand for the seven year maturity on Thursday attracted the least amount of interest as investor demand for duration remains lighter.

Matching economic growth and inflation became a bit more confusing with Thursday’s release of 1.6% for the second estimate 1Q2024 GDP, far below the 4Q2023 rate of 3.4% and the previous estimate of 2.5% for the quarter. This slowdown as well as the recent inflation trend will be addressed on Wednesday as the FOMC announces its policy decision with Chairman Powell expected to confirm why recent data has forced the Committee to push back its timetable for rate reductions.
Other Reports
- High mortgage rates (7.45%) did little to affect New Home Sales for March that were above consensus at 693,000.
- Durable Goods was above consensus at 2.6% but February’s gain of 1.4% was reduced by half to 0.7%.
The Week Ahead
No Fed speak until Wednesday’s FOMC announcement, a light week for Treasury issuance, and Friday’s jobs report is the main data release.
Monday – Treasury sells $140 billion 13 & 26 week Bills.
Tuesday – FOMC meeting begins, Consumer Confidence expected to decline.
Wednesday – FOMC announcement and Jay Powell press conference.
Thursday – Factory Orders expected to increase to 1.6%.
Friday – Non Farm Payroll expected to be 250,000.
April 22, 2024
Policy vs. Supply
As the second global conflict has passed its six-month mark in a seemingly choreographed fashion it is interesting to note not only what has happened, but what hasn’t happened, and that is a safe-haven trade in Treasuries. Since the October 7 attack by Hamas the benchmark ten-year Note has risen 75 bps as inflation has been described as sticky and sentiment has turned from expecting as many as six rate cuts this year to possibly one or two with some speculation the Fed may not cut at all.
Much of this recent shift can be traced to the April 10 CPI report of 0.4% that was above forecast and pushed this rate higher by 20 bps on the day and was followed by a weak auction for a thirty-year bond the next day. The Treasury announcement last Fall that it would emphasize debt issuance in the front end of the curve helped stabilize longer term rates and now that Fed officials and money market futures contracts identify just one or two cuts attention has turned to the supply of debt that will be needed to fund a deficit that is unlikely to decline in an election year cycle.
On a positive note, there could be some relief on inflation with this week’s PCE report that is expected to show its core rate unchanged at +0.3% with its y/y/ core rate declining to +2.7%.
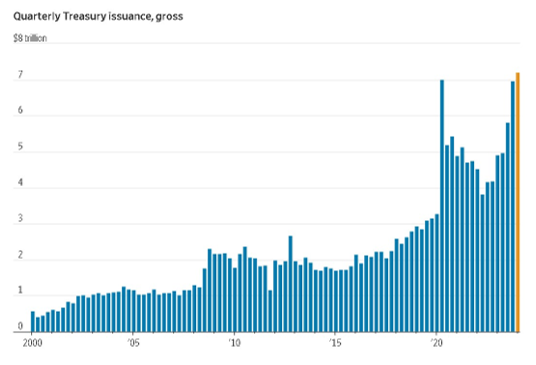
Record Quarter
In the first quarter of this calendar year Treasury sold $7.2 trillion of debt, the largest quarterly total on record, and that builds on $23 trillion of debt sold last year. The Fed could aid absorption of this supply if it reduces its Balance Sheet runoff as it indicated at its March meeting. Currently, $60 billion of Treasuries and $35 billion in mortgage-backed securities mature each month and most officials favored reducing this amount by “roughly half.”
Unusual Situation
That is a description Chairman Powell used recently to describe how the economy has not become tighter in response to higher interest rates and an illustration of that is the 15% gain for the S&P 500 index dating back to the October 7 Hamas attack in Israel. That leaves stocks higher and Treasuries weaker at a time when neither move would have been expected.
Reports
It was a light week for reports, but they captured the conflict we face in analyzing activity. Retail Sales was +0.7%, stronger than the +0.4% forecast with February revised higher to +0.9% from +0.6%. Reflecting the current 7.5% thirty-year mortgage rate Housing Starts & Permits were 10% lower than forecast at 1.321 million.
The Week Ahead
Fed speak is reduced leading up to the April 30-May 1 FOMC meeting, an active week for Treasury, GDP estimate and the Fed’s preferred inflation gauge.
Monday – Treasury sells $140 billion 13 & 26 week Bills.
Tuesday – Treasury sells $65 billion 42 day Bills and $69 billion 2-year Notes.
Wednesday – Durable Goods forecast at 2.8%, Treasury sells $70 billion 5-year Notes and $30 billion 2-year FRN’s.
Thursday – 1QGDP estimate revised to 2.2%, Treasury sells $44 billion 7-year Notes.
Friday – Personal Income forecast at 0.5% and core PCE 0.3% and 2.7%.
April 15, 2024
Last month we wrote the following: “This long bond bear fever has finally broken. Last week the Fed Chair stated the central bank was getting close to comfortable with starting to cut the target Fed funds rate. Markets expect a quarter-point cut in June. Actual and expected market volatility measure moderated thus far in 2024. “Risk-on” trading dominated and stocks hit new highs.”
That view was tested for this 504 offering. In April the Bond Bear came hungry out of hibernation. The March CPI inflation data disappointed and showed a mainly sideways trend in recent months, remaining stuck well above 3%. “Higher for longer” has returned with the futures market now pricing in only one or two quarter-point rate cuts from the Fed by year-end. Earlier in the year the market priced in up to six cuts. The ten-year T-note yield rose 48 bps from the March debenture pricing to 4.58%.
With the Fed finished with rate hikes, however, we recognize there has been a transition from a bear cycle to a bull cycle in its early stages. Painful bearish corrections like this are to be expected. What would change this view is if inflation trended stubbornly higher and the Fed had to reverse position on being finished with rate hikes and put them back on the table. That would be a rough ride. Market confidence in the nascent bull market was definitely shaken this month. The bull’s horns are quite nubby.
The April 25-year debenture rate, at 5.38%, was 41 bps above March and the highest rate since November of last year. The rate sat just 2 bps under the program life average of 5.40%. *The 25-year debenture rate spread over Treasury, however, continued to contract (7 bps m/m) and at T+80 bps was back to program life average. The recent bear cycle high for the spread was a half-point wider at T+130 bps in November 2022 and it was +115 bps as recently as last November. Despite the selloff in Treasuries, investors were in “buy the dip” mode which allowed for the spread tightening. This confidence to buy on dips in bond prices (e.g. on a rise in yields) comes from the belief the Fed tightening cycle is complete.
*We switched to using the 25-year maturity as the benchmark for rate and spread as of July 2019.
April 8, 2024
Slippage
Since the Fed has said its rate cut decisions will be data driven it is appropriate the market has slipped the last two weeks as it waited for end of week data like the previous week’s PCE that was disappointing.
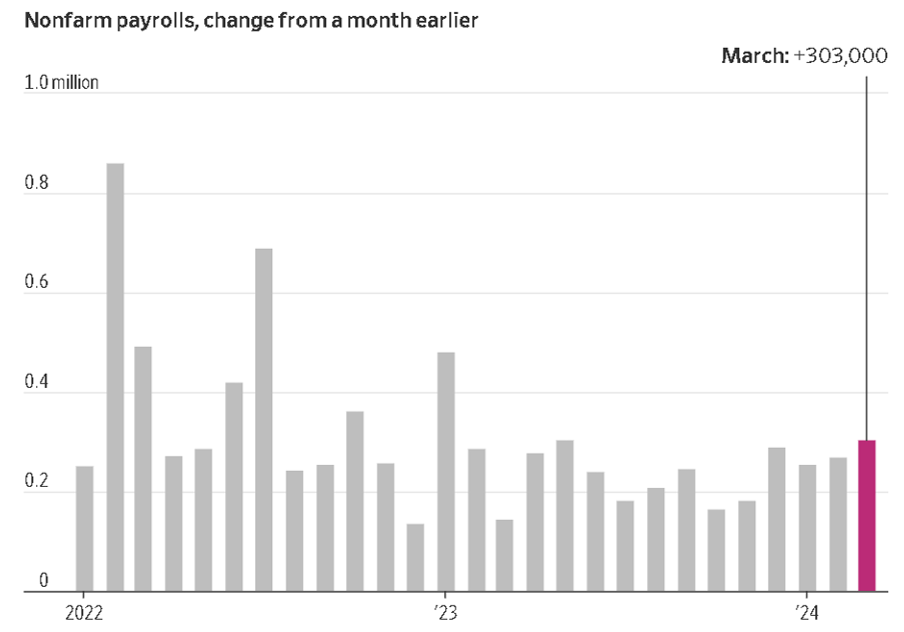
Last week saw rates rise as market consensus embraced a slower path for the bank as it awaited Friday’s Non-Farm Payroll report, which was 303,000, far above its 208,000 forecast with the Unemployment rate declining to 3.8%, not traditional results for a tight monetary policy.
Market reaction saw stocks rally after a lackluster week while Treasuries continued to slip, closing the week at 4.41%. This weakness identifies the market’s concern that the Fed recognizes it has a sustainable economy and is more focused on controlling inflation and may be more patient than previously thought. That uninspiring performance for stocks ahead of the report also captures the mood of most people as a WSJ survey states: “What’s wrong with the economy? It’s you, not the data.” By significant margins respondents are negative on inflation, investment returns and the economy and though this is broad based it is interesting how much things have improved.
Acknowledgement of this strange economic twist can be found in comments by Chairman Powell last Wednesday when he said: “The economy isn’t becoming tighter, which it ordinarily would. It’s actually becoming a little looser, and you’re seeing inflation come down—very unusual situation.”
More data is forthcoming as CPI and PPI for March are released this week on the same days when Treasury will auction ten and thirty year maturities and the 504 program comes to market.
Higher
What is not unusual is that the market has moved to rates last seen in December as it questions whether a rate cut may happen as soon as June. At 4.41% we are 31 bps above where the 504 program priced its March debentures, but credit spreads are firm and secondary trade activity is brisk.
The Week Ahead
More Fed speak, the 504 program prices its April debentures, the quarterly Treasury refunding and inflation data.
Monday – Treasury sells $140 billion 13 & 26 week Bills.
Tuesday – 504 program announces its April sale, Treasury sells $65 billion 42 day Bills and $58 billion three year Notes.
Wednesday – CPI forecast at 0.3% and 3.7% y/y, Treasury sells $39 billion ten-year Notes, Minutes of the March Fed meeting are released.
Thursday – PPI forecast at 0.3% and 504 program prices its 20 & 25 year debentures.
Friday – Consumer Confidence expected to decline.
April 1, 2024
Sideways
The market moved sideways waiting for Friday’s PCE report and while markets were closed in observance of Good Friday the numbers came in as expected, leaving markets close to unchanged on the holiday shortened week.
The PCE price index excluding food & energy increased 2.8% on a 12-month basis and was up 0.3% from January.
Consumer spending increased 0.8% on the month, higher than the 0.5% estimate while personal income at 0.3% was softer than its 0.4% forecast.
Following this release in prepared remarks Chairman Powell repeated three quarter point interest rate reductions are planned while admitting “our position is we don’t know if progress on inflation will slow for more than two months.”
While the markets were stable, headlines were made by Fed Governor Christopher Waller who emphasized that strength has removed any urgency to cut rates, saying there is “no rush” to cut interest rates and the bank should push back the timing of cutting rates from their 23-year high. Waller also noted that the number of policy makers backing fewer than three cuts this year has risen. Lingering signs of strength can be found in recent increases in gas prices compounded by supply chain disruptions in the Middle East and now in the Baltimore port.
Reports
- Durable Goods orders were up 1.4% partially offsetting January’s level of -6.2%.
- New Home Sales were lower than forecast at 662,000.
- 3rd estimate of 4QGDP was 3.3%.
The Week Ahead
A heavy calendar for Fed speak with light Treasury supply and few reports, but with Employment data on Friday.
Monday – Treasury sells $140 billion 13 & 26-week Bills, ISM Manufacturing report.
Tuesday – Treasury sells $65 billion 42-day Bills, Factory Orders forecast at -3.6%.
Wednesday – Jay Powell speaks.
Thursday – Jobless Claims.
Friday – Non Farm Payroll expected to be 275,00, Unemployment 3.9% and Wages +4.1% y/y
March 25, 2024
Bumpy Road
Last week’s FOMC meeting was as expected with no change in policy as the Fed affirmed its plan for three quarter point rate reductions this year as the Committee expects “price pressure will continue to ease, and our policy rate is likely at its peak for this tightening cycle.” In his press conference Chairman Jay Powell admitted the path to lower inflation has been a bumpy road but the last two months don’t change the overall story.
That last two months’ comment refers to the recent inflation reports that were above forecast, pushing rates higher yet also sending stocks to record high closes.
Overall, markets are supportive of the central bank’s patient policy but there are pessimists who question why the Fed is announcing plans to cut rates when recent trends don’t support it.
This Financial Times chart is part of a story about an economist, Torsten Slok, who questions just that as the fed’s preferred inflation gauge is tracking higher over the last three months.
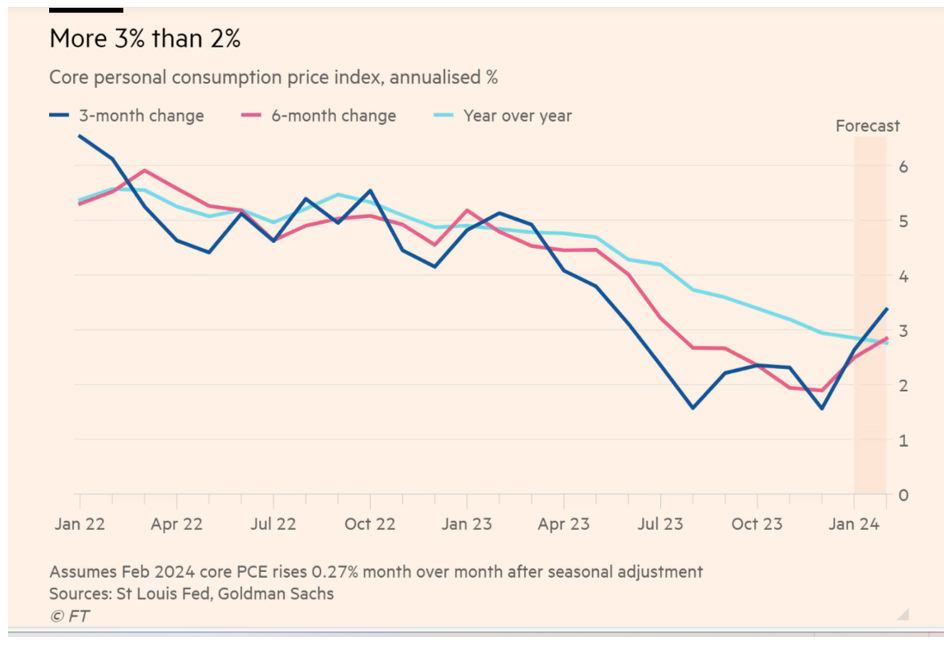
Slok believes that the Fed’s dovish pivot in December has created a strong tailwind for consumer markets, financial markets, and capital markets and this is causing inflation to reaccelerate and keep rates higher for longer.
Additional skepticism of rate cuts continues to come from former Treasury Secretary Larry Summers who believes the Fed has “itchy fingers” and needs to be more patient even as the Committee slightly increased its appropriate rate policy for 2025 to 3.6% to 3.9% and for 2026 to 2.9% to 3.1%.
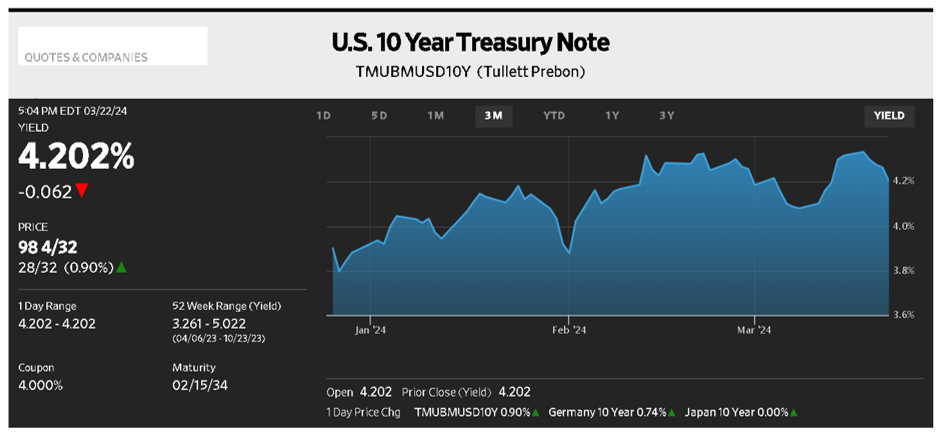
This three-month chart of the daily close for the ten-year benchmark captures its rate dating from the “dovish pivot” in December to where we are today, slightly below its 4.33% range high and lower by 10 bps on the week.
Reports
Last week was light on reports focusing instead on the FOMC meeting, but this week provides the Fed’s preferred inflation report, Personal Consumption Expenditures and that is not expected to be lower.
The Week Ahead
More Fed speak with Chairman Powell speaking Friday, Treasury has an active week, and we get GDP and PCE updates.
Monday – Treasury sells $143 billion 13 & 26 week Bills and $66 billion 2-year Notes.
Tuesday – Treasury sells $67 billion 5-year Notes and Durable Goods expected to be +1%.
Wednesday – Treasury sells $43 billion 7-year Notes and $28 billion 2-year Floating Rate Notes.
Thursday – 2nd revision of 4QGDP expected to be 3.2%, Jobless Claims to be flat at 214K.
Friday – Personal Income expected lower at 0.4%, PCE forecast slightly higher at 0.4% and y/y at 2.5% with the yearly Core rate unchanged at 2.8%.
March 18, 2024
6 to 3
That is the change in the number of rate cuts the market expects now that inflation remains stubbornly high, and it is in sync with FOMC expectations. Markets now put the chance of an interest rate cut by June at just one in three vs. a 100% probability last month.
This alignment of thought pushed the ten-year rate higher by 22 bps on the week and the move started with strong CPI data that was later enhanced by the PPI Final Demand report on Thursday, plus a poorly received 30-year bond auction.
This news also impacted equities as the S&P 500 index suffered consecutive weekly losses for the first time since October.
Here is a table listing the monthly and annual numbers for the two reports and it was the PPI numbers that accelerated the rise in rates as inflation remains sticky amidst stronger than expected economic growth.
| CPI | PPI | ||||
|---|---|---|---|---|---|
| Prior | Consensus | Actual | Prior | Consensus | Actual |
With no change expected at the FOMC meeting this week analysts note it would take just two members to switch to two rate cuts this year and move the Committee’s dot plot higher. Such a move could also put at risk the number of rate cuts in 2025.
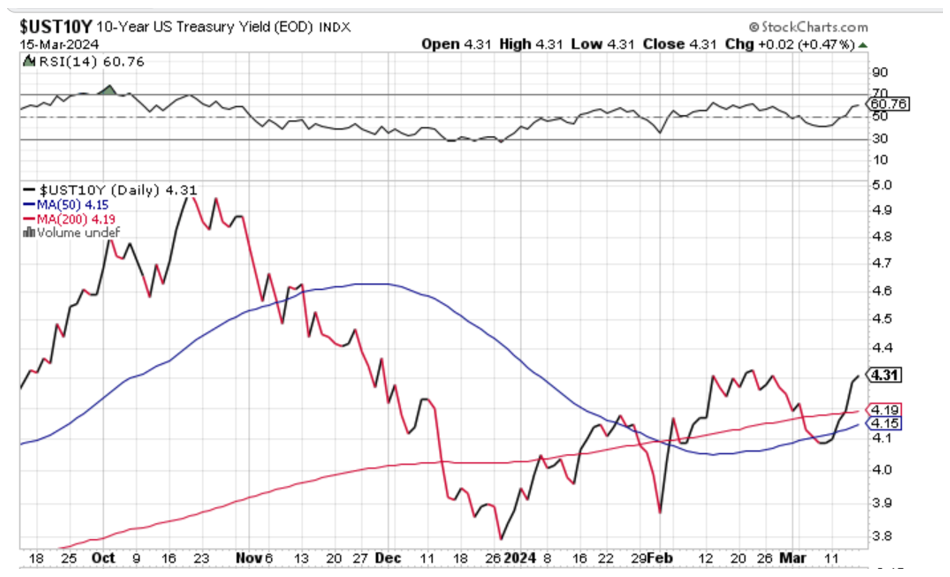
This stockcharts.com chart shows the ten-year Note’s four-month journey from 5% when “higher for longer” was in vogue to as low as 3.8% last month only to resume its rise after a second month of disappointing inflation data.
The Fed has indicated it is prepared to cut rates just not yet, so bond bulls need more patience as the data dependent central bank looks to avoid any stop/start approach to monetary policy especially as Treasury supply is expected to increase by $1.7 trillion this year. This amount is lower than last year but more weighted to longer term bonds which are riskier for investors and more difficult for the market to distribute.
Other Reports
- After declining by 0.8% in January Retail Sales increased by a less than expected 0.6% in February.
- Jobless claims were slightly weaker than expected.
- The University of Michigan Consumer sentiment survey declined as consumers appear to be in a holding pattern.
The Week Ahead
No Fed speak until the FOMC announcement on Wednesday, a light week for reports and Treasury has an assortment of maturities including the less than popular 20-year bond.
Monday – Treasury sells $146 billion 13 & 26-week Bills.
Tuesday – FOMC meeting begins, Treasury sells $46 billion 52-week Bills and $13 billion 20-year Bonds.
Wednesday – FOMC announcement and Chairman Powell press conference.
Thursday – Treasury sells $16 billion 10-year TIPS, Jobless claims, and Existing Home Sales.
March 11, 2024
A calm market prevailed for the third-straight month for the March 2024 SBA 504 debenture offering. The benchmark 25-year rate ranged between 4.97% and 5.07% over the last three offerings. Sub-5% debenture rates for March were the first in nine months. Investor total demand has been very stable in 2024, at approximately $1.6 billion per offering. This excess demand over the amount offered allowed Eagle and Underwriters to tighten the debenture spread to Treasury from +113 bp in December to +87 bp in March, a reduction of 0.26 point. The benchmark 10-year Treasury yield fluctuated in a tight range of just 12 bp at the past three pricings.
The March benchmark debenture rate of 4.97% was 43 bp below the life of program mean. This past bear market cycle high was 5.82% in October 2023. The spread to Treasury of 87 bp was only 7 bp above life of program mean. This past bear market cycle wide was +130 bp in November 2022.
This long bond bear fever has finally broken. Last week the Fed Chair stated the central bank was getting close to comfortable with starting to cut the target Fed funds rate. Markets expect a quarter-point cut in June. Actual and expected market volatility measure moderated thus far in 2024. “Risk-on” trading dominated and stocks hit new highs.
Here’s hoping the period of calm lasts at least well into the summer. The markets have done a good job of ignoring geopolitical and domestic political risk, a testament to the powerful primary influence that US central bank decisions have over the markets. The political issue that poses the greatest risk to the bond market remains the debt ceiling, which is now firmly tied to debt default brinksmanship. Last year’s debt ceiling deal moved the issue to 2025, so that game will play out all over again post-election.
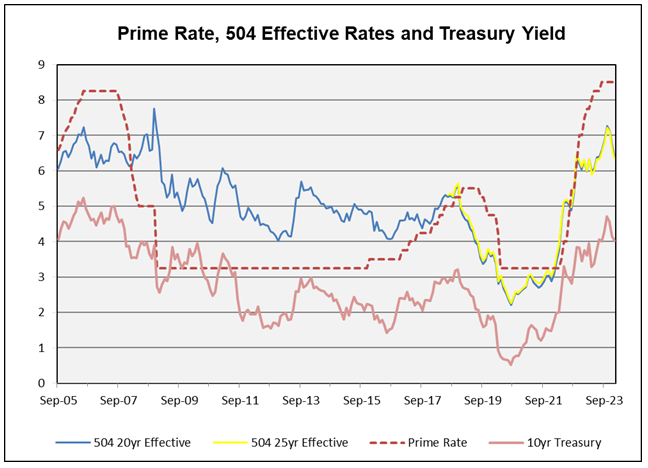
Our last comment is that for the remaining months the Fed funds rate is at a cycle high, there should be a cycle wide of the Prime Rate spread over the 25-year 504 effective rate. We can see this in the chart below, a chart Eagle posts on the website each month.
To put some numbers on it, this March the Prime Rate was 222 bp above the 25-year 504 effective rate. In the two prior Fed tightening cycles the Prime over 504 effective rate spread peaked at +179 bp in September 2019 and +216 bp in December 2006. *This month’s spread is in line with the 2006 experience that featured a Prime Rate of 8.25%, nearly identical to today’s 8.5% In 2019 the Prime Rate was much lower at 5.5%.
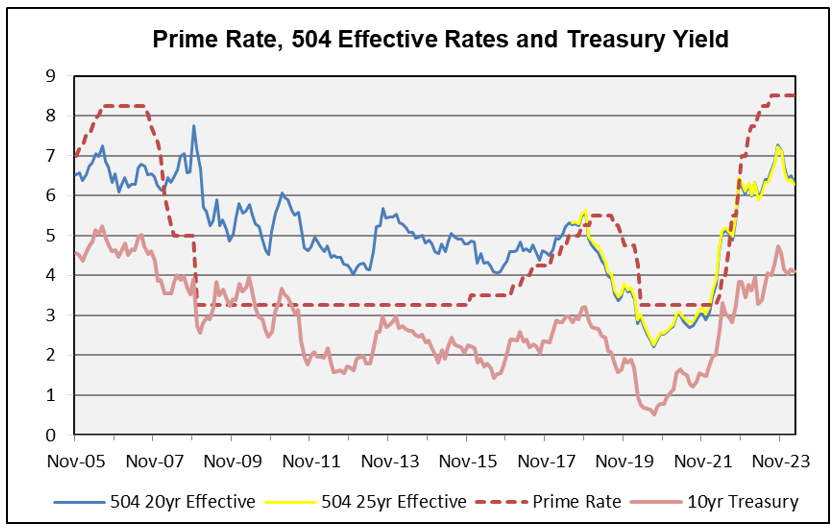
*The 504 effective rate was based on the 20-year debenture rate in 2006.
Inching Closer
It was a good week for inflation reports in the US and Europe with this Financial Times chart showing how the Fed’s current range of 5.25-5.50% has reduced CPI to 3.1% in January, down from a high of 9.1% in June 2022.
While this Financial Times chart refers to CPI it was last week’s PCE report that came in as forecast at 0.2% monthly and 2.4% y/y, with core readings of 0.4% and 2.6% y/y that fortified this improvement. These numbers remain above target, but the market is now resigned to slower and fewer rate cuts as the economy seems headed for a soft landing without an appreciable rise in unemployment, a feat few analysts expected.
One person who did believe in that is Fed Governor Christopher Waller whose philosophy was the usual jump in unemployment resulting from a tight monetary policy could be avoided if employers scrapped vacancies instead of laying off workers and it seems that is what happened since unemployment remains historically low at 3.7%.
Like this US trend Eurozone inflation declined 0.2% to 2.6% in February and while the ECB is not expected to cut rates at its meeting this week it is expected to give guidance for its first rate cut.
Rates
After rising midweek, the benchmark ten-year Note closed at 4.19%, possibly driven by a weaker than expected ISM Manufacturing Index report that was weaker than expected, leaving the Note 3 bps higher than when the SBA 504 program priced its February debentures.
Reports
In addition to the inflation data other reports were weaker than expected, a reminder of the Fed needs to balance its two objectives:
- New Home Sales were below consensus at 661K with 30 year mortgage rates at 7.06% vs. a recent low of 6.625% in December.
- Second revision of 4Q2023 GDP was 3.2%, .01 lower than its previous report.
- Durable Goods orders fell more than expected to -6.1%.
The Week Ahead
More Fed speak with Jay Powell before Congress, the 504 program prices its March debentures, a light week for Treasury, and the jobs report.
Monday – Treasury sells $149 billion 13 & 26 week Bills.
Tuesday – 504 program announces its March debenture sale, Treasury sells $80 billion 42-day Bills, Factory Orders forecast at -3.1%.
Wednesday – Jay Powell reports to Congress.
Thursday – 504 program prices its March debentures, Jay Powell reports to Congress.
Friday – Non-Farm Payroll expected to be 210,000 vs. the previous month’s 353,000.
February 26, 2024
Paused
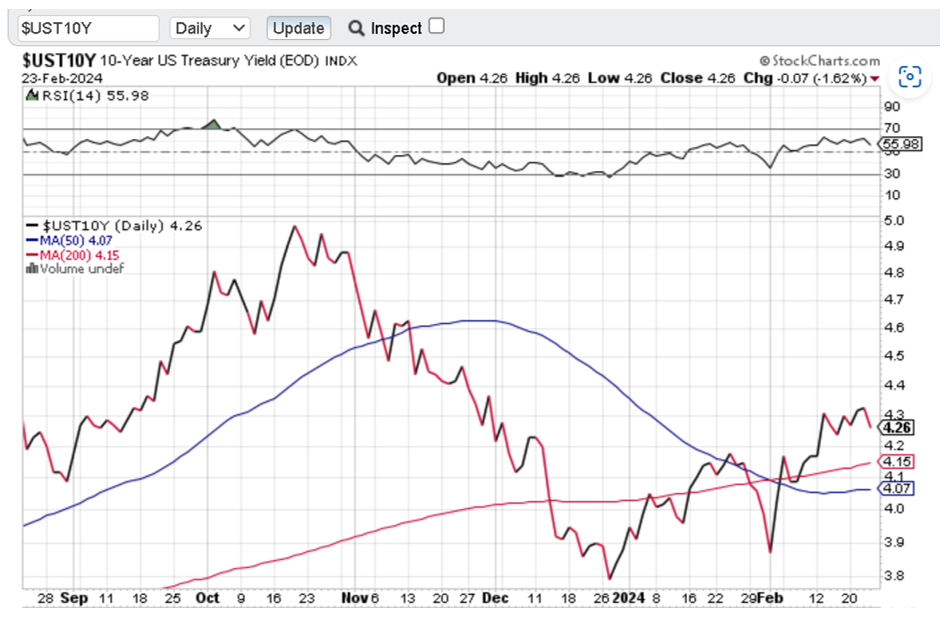
The recent rise in rate took a break last week with the benchmark ten-year rate declining slightly to 4.26% as the 2/10 curve inverted further to -44 bps as hopes for a March rate cut have been dashed. This level is where it was last October before it rose to close near 5% on increased inflation fears. One difference between then and now, besides that same fear, is the Fed has convinced traders that an imminent cut in rate is not forthcoming and the number of cuts will be fewer than expected.
Wednesday’s release of the Minutes from the January 30-31 FOMC meeting underscored the Committee’s patience to be data dependent on any policy change with only two members highlighting the risks of keeping rates too high for too long. The Committee was wrong in 2021 when it believed inflation was transitory and does not want to ease prematurely only to be faced with a stop/start action should inflation rise again, and rates would need to be increased. Concern about inflation was evidenced by the comment that the Committee was “highly sensitive” to inflation risks and policy hawks could interpret that as the Fed being willing to raise rates should inflation persist. That is a view expressed by Larry Summers, a former Secretary of the Treasury, who believes there is a meaningful chance (15%) that the Fed could raise rates if they don’t see it trending lower. A Financial Times article notes that is the same odds of an NFL kicker missing a 37 yard field goal, but also the odds the New York Times gave of Donald Trump winning the 2016 election.
Reports
It was a very light week for reports but that changes this week as we get data on all the Fed’s topics of interest – the economy, inflation, and jobs.
- Economy – Wednesday’s release for second revision of 4QGDP is forecast at 3.3%. Durable Goods forecast is -0.5%, continuing the weakening trend in manufacturing.
- Inflation – Thursday is Personal Income and is expected to be 0.3% with Personal Consumption Expenditures forecast at 0.3% and 2.4% y/y with the core numbers slightly higher.
- Jobs – Jobless claims expected to be 206,000, consistent with recent weeks and following the larger than expected January jobs report.
The Week Ahead
Treasury issuance is active early in the week:
Monday – $149 billion 13 & 26 week Bills, $63 billion two-year Notes, and $64 billion five-year Notes, New Home Sales expected to be 680,000.
Tuesday – $42 billion seven-year Notes.
Wednesday – 4QGDP revision and Durable Goods report.
Thursday – Personal Income and PCE, Jobless Claims.
February 19, 2024
One, Two
After absorbing the first punch from CPI on Tuesday bond bulls took another hit on Friday when PPI also came in above expectations. Dovish sentiment weakened after the January 31 FOMC meeting and again after a Jay Powell interview on 60 Minutes that delayed rate cut expectations until June and reduced expectations to just 100 bps in 2024. An exclamation point for that sentiment is the admission the Committee will not even discuss rate cuts at its March 19-20 meeting.
Until that interview the market had continued to front-run the Fed in expectation of more rate cuts because:
- A hard landing for the economy was being discounted.
- PCE readings were moving in the right direction.
- Unemployment, while lingering near a historically low rate, was showing signs of increasing.
This benchmark Note had reached as low as 3.88% on February 1st and is now moving north of its 200-day Moving Average of 4.13%.
Reports
- Though the 0.3% monthly rate for CPI was not much higher than expected the 3.1% y/y reading, while lower than January’s 3.4% was above the forecast of 2.9%, triggering a spike in interest rates and a sharp decline in stocks where the DJIA had just recorded its fourteenth highest close this year.
- Retail Sales disappointed with a decline of 0.8% vs. December’s gain of 0.5% while vehicle sales represented a large portion of that drop at 0.6%.
- Industrial Production was expected to rise 0.2% but declined 0.1% and the Capacity Utilization Rate also was lower.
- PPI has consistently been lower than CPI as increases were not being passed along to consumers, but their nominal increases of 0.3% and 0.9% y/y were joined by their ex food and energy components of 0.5% and 2%, all above forecast.
Even with this softness the economy remains strong so it shouldn’t be a surprise that consumers may be taking a pause, but that could be the result of depleted pandemic savings and government support. Bank of America repots credit card and auto loan delinquencies are above pre pandemic levels with 30-year mortgage rates rising to 7.14% and those considerations could weigh on monetary policy should they continue.
So, the market waits for a June rate cut and the Fed stays true to its data dependency.
The Week Ahead
Fed speak continues; Treasury is active with a light week for economic reports.
Tuesday – Treasury sells $149 billion 13& 26 week Bills and $80 billion 40-day Bills.
Wednesday – Treasury sells $16 billion 20-year Bonds.
Thursday – Treasury sells $9 billion 30-year TIPS.
February 12, 2024
Another Strong Offering. The 504 debenture offering in February drew another round of strong investor demand, offering the opportunity to notably reduce spread over Treasury e.g., by 12 bps m/m for the 25-year pool. Strong anticipated and actual demand in recent months led Underwriters to recommend consistently tighter spreads to Treasury to the tune of a cumulative 24 bps tightening since the November offering. A strong bond market January Effect lingered into this offering, with investors flush with cash to put to work. Underwriters continued to draw from an expanded buyer base, 28 accounts participated in the 25-year offering, just one shy of the record 29 accounts in January.
Deal size helped results as well, with $315MM the smallest since January 2021. The 20-year pool size was under $13MM, the smallest since 1987, during the dawn of the 504 program. It seems there was a combination of calendar and seasonal effects behind the size. The processing window was a few days shorter than typical and, historically, there has been a bit of a seasonal effect regarding February producing smaller deal sizes. It’s reasonable to expect some rebound in March. Loan approval pipeline growth remains positive.
The 5.07% debenture rate for the benchmark 25-year pool was up 6 bps versus the prior offering and the spread was 12 bps tighter. This tightening of the spread offset much of the rise in the T-note benchmark yield.
Debenture Rates Nominal, Captain. Let’s put the current 25-year debenture rate and spread to Treasury in long-run historical perspective. The 504 program is in its 38th year and has been through many monetary policy cycles and crises of various magnitudes. Over the life of the program the rate for the benchmark 504 debenture maturity ranged from 1.01% (Aug. 2020) to 10.75% (Oct. 1987). The spread over Treasury for the 504 benchmark ranged from negative 4 bps (May 2021) to positive 349 bps (Dec. 2008).
February’s 504 benchmark rate of 5.07% and spread to Treasury of +91 bps were quite close to life of program means. We can measure that snugness looking at the z-score, or number of standard deviations from the mean, for the recent results. We display several measures, including the z-scores, in Table 1.
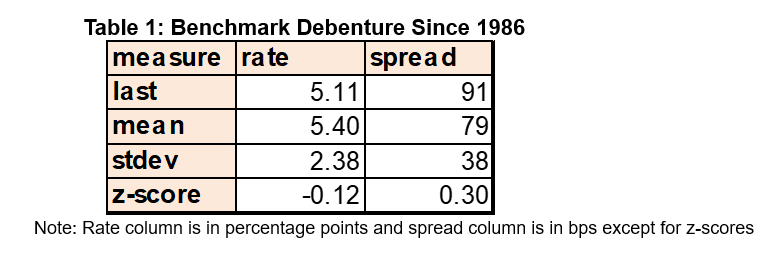
The debenture rate for February was 39 bps below the life of program mean with a z-score of -0.12 standard deviations. The spread to Treasury was 12 bps above the life of program mean with a z-score of +0.30 standard deviations. None of these measures are remarkable.
Free of The Bear, or Fooled Again? The market a year ago was in a similar situation to today. There’d been a rally in rates and spreads on expectation the Fed was nearly finished tightening and inflation was getting under control. The market front-ran the Fed, pricing in few or no more tightenings and a backing off of QT.
We know what happened, it was a very bad front-running call. Inflation moderated but the Fed kept hiking the Fed funds rate and kept up QT. Rates and spreads shot steadily higher from April through October. The market, in fact, twice failed to successfully front-run the Fed in this latest tightening cycle. The first bad call resulted in a selloff from August into November 2022.
As we discussed in December 2023 commentary, the bond market has again front-run the Fed. As a result, over the last several months, CDCs benefited from a sharp reduction in debenture rates, worth 71 bps for the 25-year maturity since October. Recently, however, the Fed and good economic data pushed back on the bulls. In just the past week the 10-year T-note yield rebounded off a retest of 3.80% up to 4.20%. That’s a sign the market is not yet fully out of the grip of bond bear.
There is good reason to hope the bond bear cycle is finally over. The Fed is forecasting a few rate cuts later this year. But the market yet persists in running too far in front of the Fed, leading to sharp corrections. It’s very pleasing debenture rates have declined so much in recent months, but we do caution that potential for high volatility still lurks.
*Stat-oriented folks may find it interesting that the median for rate and spread (5.32, +71) are pretty close to the mean, suggesting the distributions are not terribly skewed.
February 5, 2024
No Fed
The FOMC decision was to hold rates steady and indicate that any cuts were not imminent. A key phrase in the announcement was “the risks to achieving the inflation and employment goals are moving into better balance” and could lead to “adjustments” to the current target range of 5.25-5.50%. Chairman Powell stated that a rate cut in March was unlikely, putting more focus on May being the earliest that one could be expected.
The week began with rates finding support and declining into Wednesday when the FOMC announcement combined with the quarterly financing calendar for the Treasury and concerns over NY Community Bancorp’s stock declining 38% after a fourth quarter loss sent rates lower.
- Jay Powell took a March cut off the table and the market will now focus on May or June for the first of what is expected to be multiple rate cuts. Rates eased back once it was released and then resumed their move lower. The gains had accelerated earlier on Wednesday after the ADP jobs report came in at 107,000, significantly lower than its 145,000 forecast.
- Adding to that move was the Treasury’s announcement for its quarterly financing needs which will see the largest ever debt auctions with a maturity longer than two years. Of more interest was the caveat that if current projections are correct, they did not expect to increase auction sizes in future quarters.
- NY Community Bancorp cut its dividend after reporting a loss of $252 million after having purchased the assets of Signature Bank last year. This event, coupled with warnings from other banks about commercial loan losses, led the KFW Regional Bank Index to its worst day since the Silicon Bank collapse last March.
U-Turn
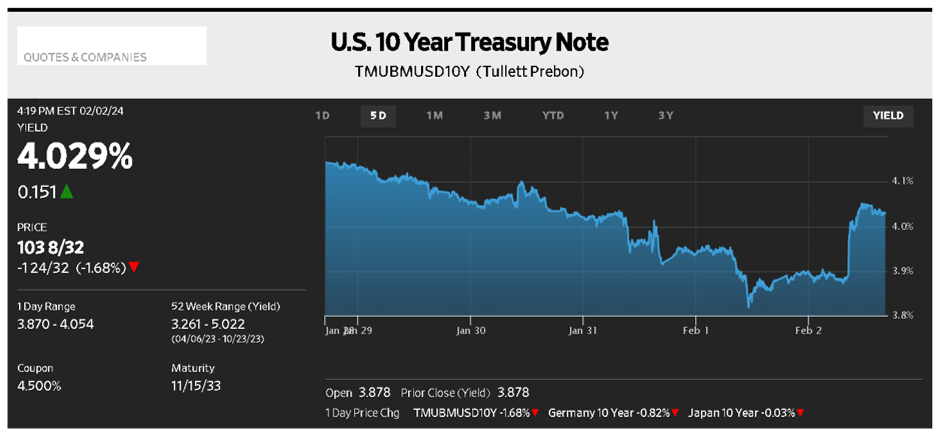
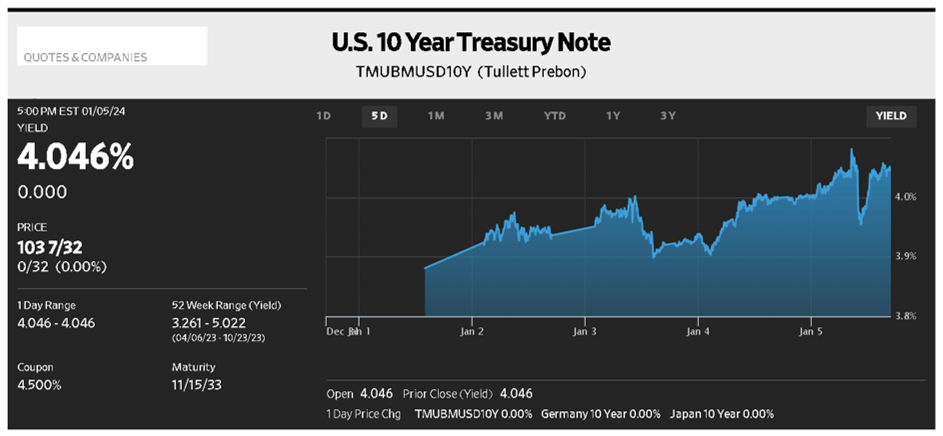
After extending its rally to a low of 3.82% the benchmark ten-year Note reversed course on Friday in response to the much stronger than expected jobs report showing a gain of 353,000 in January with an upward revision of 117,000 for December. Unemployment remained at 3.7% and the additional strength of 0.6% in average hourly wages (4.5% y/y) identifies how hot the economy is. This is one category the Fed will closely watch as it strives to balance employment and inflation.
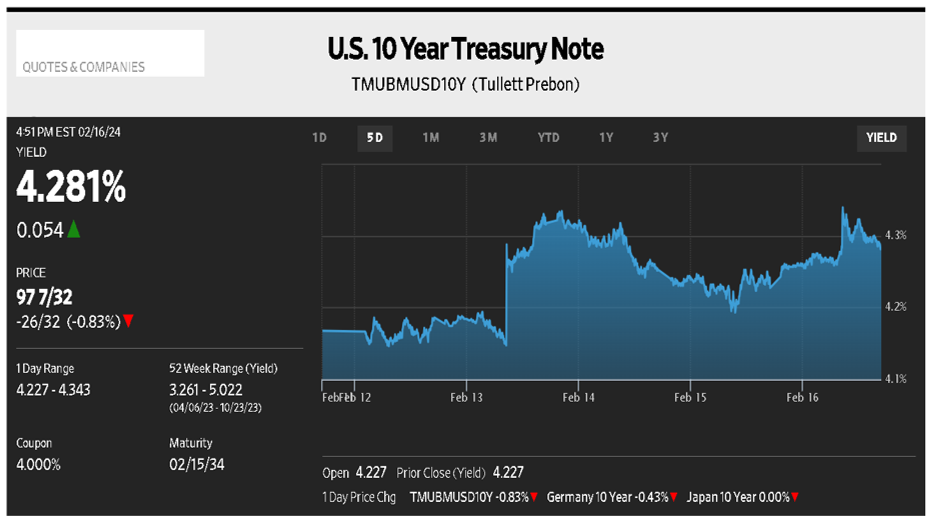
As seen in this WSJ chart the benchmark Note is basically unchanged from when the 504 program priced its January debentures.
Other News
- Like the Fed, the Bank of England left its key rate of 5.25% unchanged but signaled it is likely to reduce the rate sometime later this year.
- With borrowing costs expected to fall the International Monetary Funnd said the global economy is likely headed for a soft landing this year.
The Week Ahead
Fed speak resumes, SBA 504 program prices its February debentures, Treasury conducts its quarterly refunding, and a light week for reports.
Monday – Treasury sells $149 billion 13 & 26 week Bills.
Tuesday – 504 program announces its sale, Treasury sells $54 billion three year Notes.
Wednesday – Treasury sells $42 billion ten year Notes.
Thursday – 504 program prices its February debentures, Treasury sells $25 billion thirty year Bonds, Jobless Claims.
January 29, 2024
Support or Resistance?
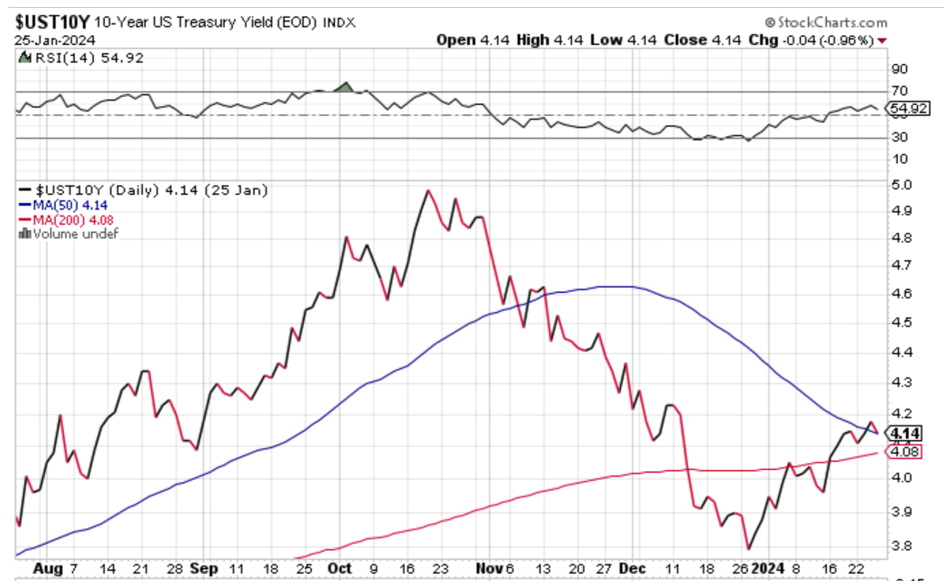
With the ten-year benchmark closing at 4.14% Friday the question is – does it bounce back off that 50 day Moving Average or continue its move higher, above the 200 day average of 4.08%. In just three months, with market sentiment not Fed action driving its moves, we have seen the rate as high as 5% and as low as 3.88% as higher for longer gave way to expectations of as many as four rate cuts this year.
Supply
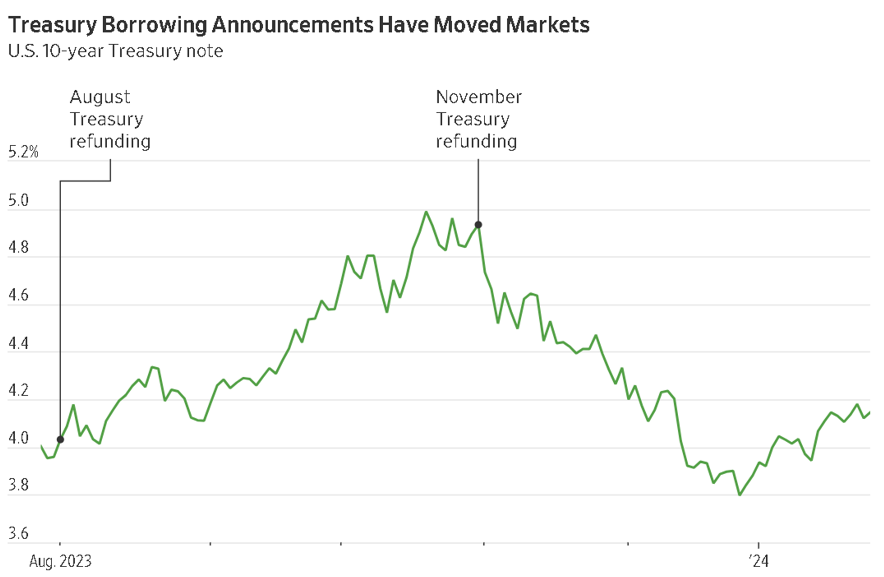
And now we prepare for Wednesday’s Treasury announcement of its upcoming quarterly refunding that can have a market impact based on where the supply is concentrated. Sensitive to demand for longer term debt, terms of the November refunding skewed towards shorter maturities and along with improving inflation data contributed to the year-end rally and partial normalization of the 2/10 Treasury curve.
With a stronger than expected 3.3% gain for 4Q GDP, coupled with a 2.6% y/y increase in the Fed’s preferred inflation gauge, Friday’s jobs report will be another item for the Fed to consider before making any policy change. Estimates for that release are 180,000 just like in December when the report was stronger than forecast at 216,000.
The market is expecting a rate cut at the March 19-20 FOMC meeting so the Committee will have two employment reports to analyze along with one more report on Personal Consumption Expenditures as it balances those numbers with an economy that has been surprisingly resilient.
The Week Ahead
Fed speak blackout until after this week’s FOMC concludes on Wednesday, a light week for Treasury and reports.
Monday – Treasury sells $149 billion 13 & 26 week Bills.
Tuesday – FOMC meeting begins.
Wednesday – FOMC meeting concludes followed by Jay Powell press conference. Treasury announces its quarterly refunding plans.
Thursday – Jobless claims forecast at 210,000.
Friday – Non-Farm payroll forecast at 180,000.
January 22, 2024
Fed Speak
That is what started the move higher in rates last week and there was a lot of it. There were as many as seven speeches given by Fed officials starting with Christoper Waller, a member of the Federal Reserve Board of Governors, who began the week by downplaying the need to rush to cut rates and subsequent speeches echoed that theme, driving the benchmark ten-year rate higher by 19 bps on the week.
That talk was joined by a poorly received 20-year bond auction and strong economic data as both Retail Sales and Industrial Production came in above forecast, like 4QGDP is expected to do when it is released tomorrow. Consensus is for a 2% increase that would put its annual rate at +2.8% from a year earlier.
This strength identifies the dilemma faced by the Fed as it prefers the market to be more cautious about rate cuts that might support economic expansion when it is not needed.
Recent Fed comments that more rate hikes are unlikely fall short of the central bank easing policy and the slope of the 2/10 cure reflects that uncertainty. It closed 2023 at -37 bps, moved to a more normalized level of -18 bps on January 12 and resumed more inversion at -26 bps last Friday. To be determined is how the curve will move, by short term rates declining due to rate cuts or by long term rates rising because rates will remain higher for longer.
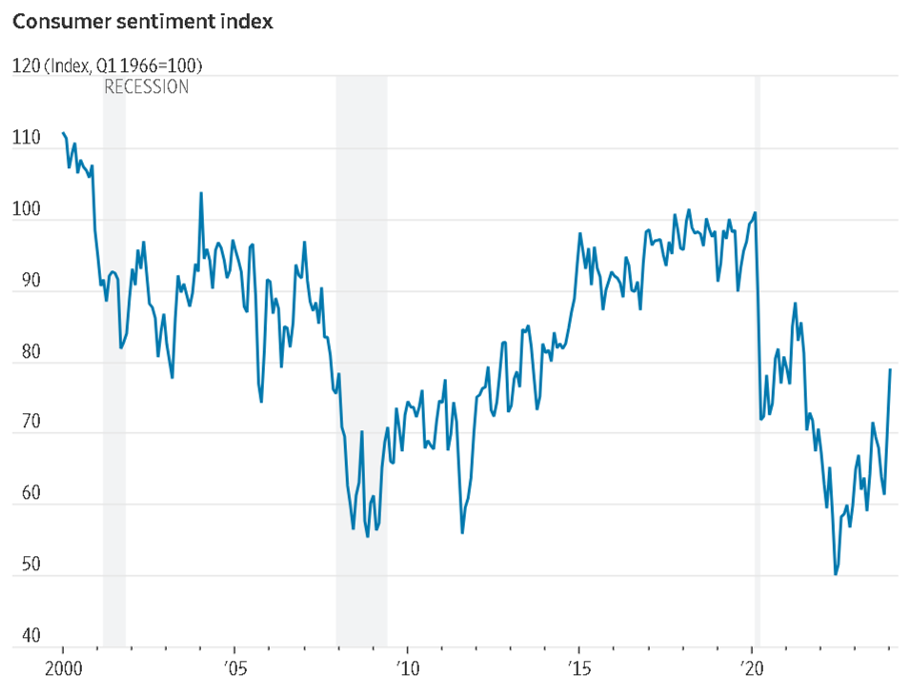
Surge of Confidence
The University of Michigan Consumer Sentiment Index surged for the second consecutive month with a two-month increase of 29%, the largest two month gain since 1991.Reflecting the moderation of inflation, coupled with Fed comments that rate increases are behind us can lead to increased consumer spending and make the Fed more cautious about lowering interest rates.
The six month reading for the Fed’s preferred inflation gauge ended December at 2% and Friday’s release will be the week’s key report leading up to the January 30-31 FOMC meeting.
The Week Ahead
Reduced Fed speak leading up to the meeting, an active Treasury calendar and PCE on Friday. Continued elevated amounts of Investment Grade issuance can be expected as January has so far represented the largest amount of sales since 1990.
Monday – Treasury sells $147 billion 13 & 26 week Bills.
Tuesday – Treasury sells $46 billion 52 week Bills and $60 billion two-year Notes.
Wednesday – Treasury sells $61 billion five-year Notes and $28 billion two-year FRN’s.
Thursday – Treasury sells $46 billion seven year Notes. 4Q2023 GDP estimate, Durable Goods forecast at 1.5%.
Friday – Personal Income forecast at 0.3% and PCE expected to be flat and 2.6% y/y.
January 15, 2024
The 504 debenture offering in January drew strong demand for all three pools offering us the opportunity to reduce debenture rate spreads over Treasury and take advantage of a somewhat lower 10-year Treasury yield versus December. The 5.05% debenture rate for the benchmark 25-year pool declined 23 bps versus the prior offering and was the lowest in seven months.
Spurring the strong demand from investors was the belief, supported by Fed leadership, that the tightening cycle was complete. The market, as is typical, then front-ran the Fed, pricing in Fed funds rate cuts as early as the spring, a move is not supported by Fed guidance.
The market tried and failed a few times earlier in the tightening cycle to time the Fed and the result of the failures was not pretty as bond yields and spreads to Treasury quickly made new legs higher. The recent calming of key inflation rates and more neutral Fed speak, however, gives the market a longer leash, and has improved investor sentiment toward bonds quite dramatically. After the fast run in the 10-year T-note yield from 5% to 3.8% (before correcting up to 4% lately) it seems the market has more consolidation and/or correction ahead.
The chart below shows four key interest rates for the 504 program. We can see in recent months the sharp drop in 20- and 25-year 504 effective rates from around 7.25% in October to below 6.5% in January. The 504 effective rates for January were roughly 200 bps below the Prime Rate and that’s about as wide as it got at the end of prior tightening cycles. Looking ahead, based on Fed funds futures prices the market, in effect, very much expects the Prime Rate to be reduced along with the Fed funds target by a quarter point in March.
January 8, 2024
Slight Reversal
After the euphoric end to 2023 markets reversed course last week, ending a nine-week rally that saw stocks reach near record highs with this benchmark Treasury moving back above 4%. At 4.05% the market is 17 bps lower than the 504 program its December debentures.
As always, there are multiple interpretations for price action and for Treasuries there are at least two observations.
With the release of the minutes from the FOMC’s December 12-13 meeting last Wednesday the rates market began trending higher as it interpreted the release for confirmation of an end to rate hikes and the timing of rate cuts that might be slower than thought, but the text of the minutes disclosed some policy makers want a discussion on the circumstances under which their Quantitative Tightening policy can be revised. That policy put trillions of dollars into the virus affected economy with the Fed’s balance sheet soaring to $9 trillion. From that peak in May 2022 sales and maturing debt have reduced it to $7.2 trillion with a possible end to that runoff. Ending the policy would permit the bank to reinvest proceeds of maturing debt into their preferred investment of Treasuries which could partially offset the increased need for Treasury to fund the country’s $1.7 trillion budget deficit. It was that funding need in the second half of 2023 that helped push rates higher as the market had lost its biggest buyer, the Fed.
A recent survey of Treasury dealers expected an end to QT by December and speculation of earlier action is premature, but like the market front-running the Fed on rate cuts in 2023 a similar action could happen again this year.
Stronger than expected
The final push to higher rates on Friday was provided by the Non-Farm Payroll report that came in stronger than expected (216,000) while leaving the Unemployment Rate unchanged at 3.7%. For all of 2023 employers added 2.7 million jobs, lower than 2022’s total of 5.2 million but greater than the years leading up to the pandemic.
The labor market’s steady gain, coupled with the reduction in inflation is providing comfort for a soft landing to the economy which would preclude additional rate hikes. Aiding that assessment is the annualized six-month rate of core PCE inflation that fell to 1.9% last quarter.
The Week Ahead
The SBA 504 program prices its January debentures, Treasury is active with its quarterly refunding, and we get more inflation data.
Monday – Treasury sells $143 billion 13 & 26-week Bills.
Tuesday – 504 program announces its 10, 20 & 25 year debenture sale, Treasury sells $52 billion three-year Notes, Trade deficit expected to be $65 billion.
Wednesday – Treasury sells $37 billion ten-year Notes.
Thursday– 504 prices its debentures, Treasury sells $26 billion thirty-year Bonds. CPI forecast at 0.2%.
Friday – PPI forecast at 0.2%.
December 18, 2023
Commentary will resume on January 8, 2024.

December 11, 2023
The $422 million December debenture offering was sizable given the relatively short processing window and the overall backdrop in low origination/issuance activity in other lending spaces. For calendar year 2023, $5.1 billion in 504 debentures were issued. While that figure is fully $2 billion lower from the (perhaps unassailable) 2022 record, it is over $1 billion above the average of the three years before the pandemic.
Sharp m/m drop in debenture rates. CDC’s benefited from a sharp m/m drop in the debenture rates of 41 bps and 43 bps, respectively, for the 20- and 25-year maturities (rates were 5.23% and 5.28%). This is the third time in this now 45-month bear market in bonds the 504 debenture rates fell over 40 bps m/m. The prior two drops were followed by a quick resumption in the uptrend in interest rates. We must remember, this remains a bear market that no active fixed income professional has experienced.
Let’s take these m/m debenture rates drops when we can get them! Another nice note is that debenture rates now have fallen for two consecutive months, something not seen since Jul-Aug 2022.
Another “front run” attempt. The sharp drop in debenture rates from November resulted from yet another attempt by the market to push back against the Fed’s policy stance, i.e. front run the Fed. Fed leadership keeps talking Fed policy rates staying at least as high as currently and for longer. Another rate rise is on the table according to them. But the market has (again) moved forward the expected timing of the first rate cut of the next easing cycle. Back in October, using money market futures prices, the market priced a first rate cut well into the second half of 2024. Recently market pricing has that first cut moved up into the spring of 2024.
Driving the market optimism is a turndown in the economic surprise index, seen in the chart below (blue line). This downturn tells us that actual economic data results had been well above forecast but now are only a bit above forecast. In other words, the economy is doing better than expected, but not by so much, the soft landing may be upon us. Thus, the market concludes, the Fed’s work tightening is done and policy rates, in fact, may be too restrictive and eventually slow the economy too much. Therefore, the Fed will have to cut rates sooner than leadership has signaled. If that’s the case then let’s jump ahead of the Fed and buy bonds! That’s been the market response.
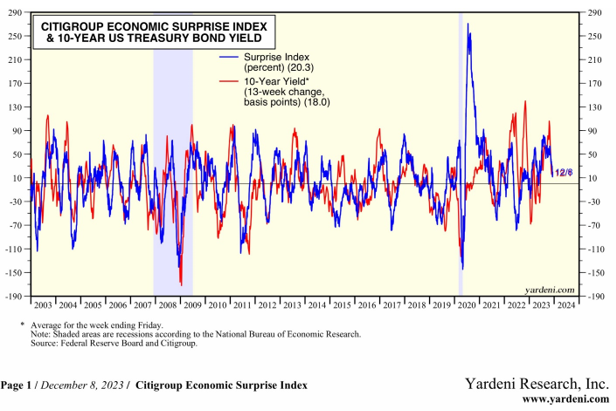
Who’s right? Will the Fed view or the market view be right this time? Face it, no one - Fed, individual or market - can consistently predict economic or interest rate directions. That is the only thing we know with certainty. So it remains to be seen which view prevails. This tug of war is age-old. For example, as our annotated 10-year T-note yield chart below shows, the market has now tried to clearly front run the Fed way three times in this bear cycle. We can see the market lost the first two tries as rates resumed the uptrend after the first two attempts. It remains to be seen for this third try whether the bear cycle peak is in place. Hope springs eternal.
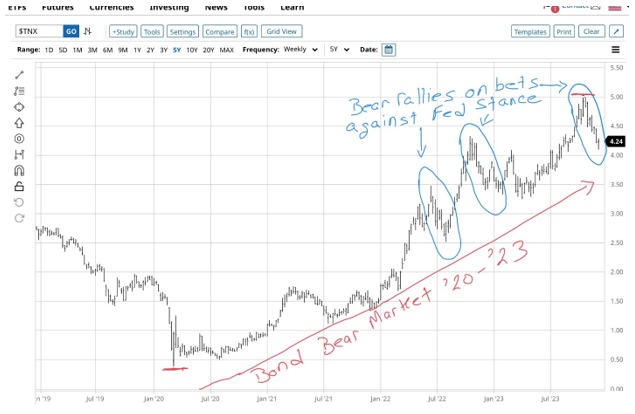
In the meantime, let’s enjoy the benefit of the recent sharp drop in debenture rates, some good news in a historically strong bear market in bonds. Eventually the market will get the bet mainly correct, the Fed tightening will be done, and the bear cycle will end offering a chance for a further correction lower in interest rates. But no one will quite know exactly when. Maybe this time?
December 4, 2023
Against the Odds
As much as Chairman Powell insists future rate hikes remain on the table and more data is needed to support rate cuts the market disagrees. This WSJ chart shows the ten-year benchmark closing last week at 4.20%, down 29 bps on the week, 36 bps lower than when the 504 program priced its last sale and just six-weeks removed from when its rate was 5% and market sentiment was very negative. What changed for the market to front-run the Fed so decisively? The answer is elusive but recent inflation data has helped and seems to have encouraged the market that the Fed may accept a sliding scale of inflation numbers on its path to 2%, not wait for that absolute level.
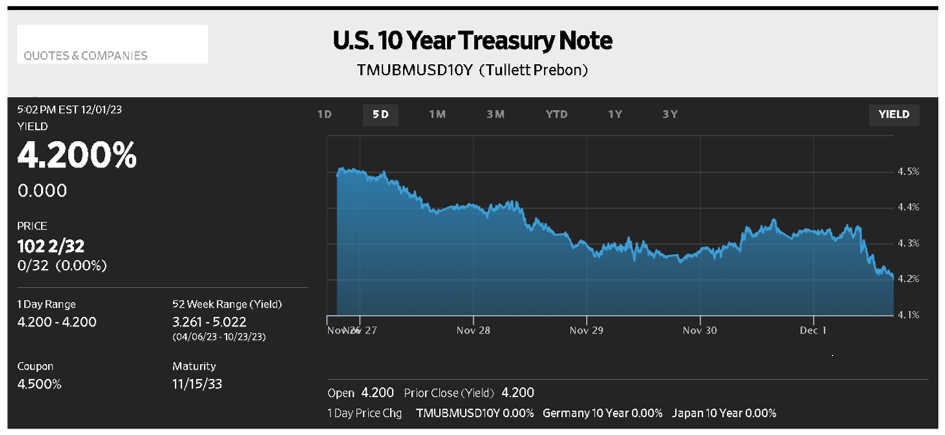
What stands in the way is the increasing debt burden that needs to be financed along with the fact the level of Treasury rates already sits where many firms expect them to be in late 2024 after the Fed actually reduces rates. Bank of America expects to see 75 bps of rate cuts nest year with a five-year rate of 4.15%, yet that issue currently yields 4.20% so that would indicate we are currently overpriced before any cuts take place.
On Friday Chairman Powell admitted the Committee’s policy setting “is well into restrictive territory, meaning that tight monetary policy” is slowing economic growth, but cautioned it is premature to think its goal has been achieved.
Performance
- The rates market started the week well, accommodating Treasury and Agency CMBS supply, then overcame a 3QGDP report of 5.2% that was stronger than expected and was possibly offset by a New Home Sales report of 679,000 that was below consensus, reflecting the still high 30-year mortgage rate of 7.09%. It was Thursday’s Personal Income and Personal Consumer Expenditures report that got things frothy. At 0.2% PI was as forecast but PCE was 0.0%, down from 0.4% in September and 3.0% y/y vs. 3.4% a year ago. This possibly reflects the optimism people may have for an incremental approach to the Fed’s 2% goal, regardless of what is said.
- Global stocks recorded their best month in three years on hopes of interest rate cuts, as the Nasdaq gained 10.7%.
- Helping that move is the decline in the Vix, Wall Street/s “fear gauge,” that closed the week at a four year low, exhibiting confidence that the Fed can control inflation without causing a recession.
The Week Ahead
SBA 504 progarm prices its December sale, a light week for Treasury and Friday’s jobs report is a highlight.
Monday – Treasury sells $148 billion 13 & 26 week Bills.
Tuesday – 504 program announces its 20 & 25 year debenture sales.
Thursday – 504 program prices its debentures.
Friday – Non-Farm Payroll report forecast at 195,000.
November 27, 2023
B+
The rates market gave a little ground on the week but was able to pass a test accommodating Monday’s sale of $16 billion twenty-year bonds with good demand, unlike other recent longer-dated sales. Rates did ease on a shortened trading day Friday, perhaps in anticipation of heavy Treasury supply early this week.
For the week the ten-year benchmark was up 3 bps in yield and is 9 bps lower than when the 504 program last priced as the market seems to be embracing a soft landing for the economy while hoping there is no need for more rate hikes.
This WSJ one-year chart for the benchmark shows how it touched 5% last month before rallying as the Fed’s caution of higher for longer seems to have lost its emphasis.
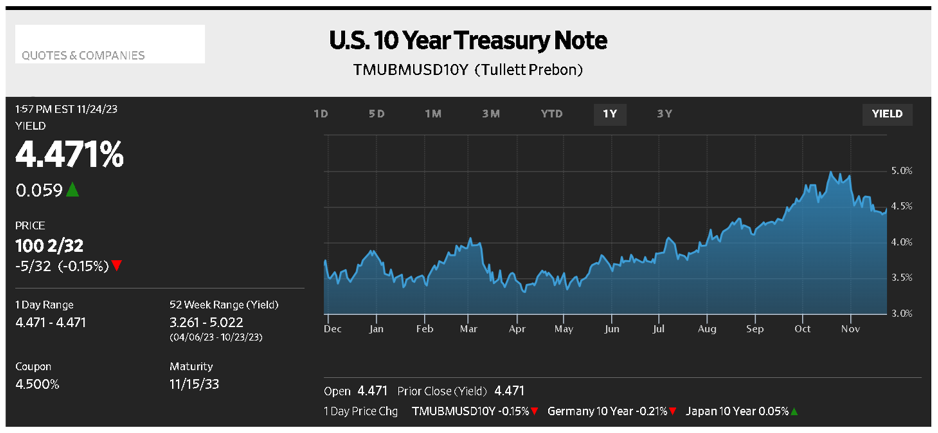
What’s Changed?
As a Financial Times article points out this approach that higher rates will cause a recession and end the historic decline in government bond prices sounds like the forecast of one-year ago but now the difference is the recession is expected to be mild, not the hard landing that was feared.
This leaves the market with at least these questions:
- Will slower growth outweigh the potentially bond weakening impact of increased Treasury supply and credit product refinancing?
- Is the current presence of highly sensitive marginal buyers of long-term debt like hedge funds sufficient to support the market?
- Can traditional investors withstand the market volatility that saw rates rise from 4% in September to 5% in October and then reverse half that move in just six weeks?
- Institutions and investors alike have $5.7 trillion parked in cash-like money market funds, many of which yield 5% or more. Are those funds going to remain there or be committed to more permanent equity and fixed income investments?
Linked to Treasury performance is the stock market that ended its fourth consecutive week of gains and is headed for its best monthly performance in a year. Their selloff from late July through October reflected the higher for longer belief but optimism the Fed won’t raise rates is building.
Expectations
Traders in interest rate derivatives are pricing in a nearly 23% chance that the Fed will cut short-term rates at it its March meeting, according to CME Group’s Fed Watch tool.
Adding to this trend is the forecast for Thursday’s Personal Income and Personal Consumption Expenditures reports that are forecast to decline, both m/m and y/y.
The Week Ahead
Fed speak, an active Treasury and the Fed’s preferred inflation gauge on Thursday.
Monday – Treasury sells $143 billion 13 & 26 week Bills, $54 billion two-year Notes, and $55 billion five-year Notes.
Tuesday – S&P Case Shiller Index, Consumer Confidence, and Treasury sells $39 billion seven-year Notes.
Wednesday – 2nd estimate of 3Q GDP 4.9%.
Thursday – Personal Income & Outlays, PI forecast at 0.2%.and PCE consensus is 0.1% and 3.1% y/y.
November 20, 2023
Which is It?
Since the last FOMC meeting the market was resigned to the Fed’s higher for longer mantra until recent reports, like last week’s modestly improved inflation numbers shifted sentiment to soft landing with rate cuts.
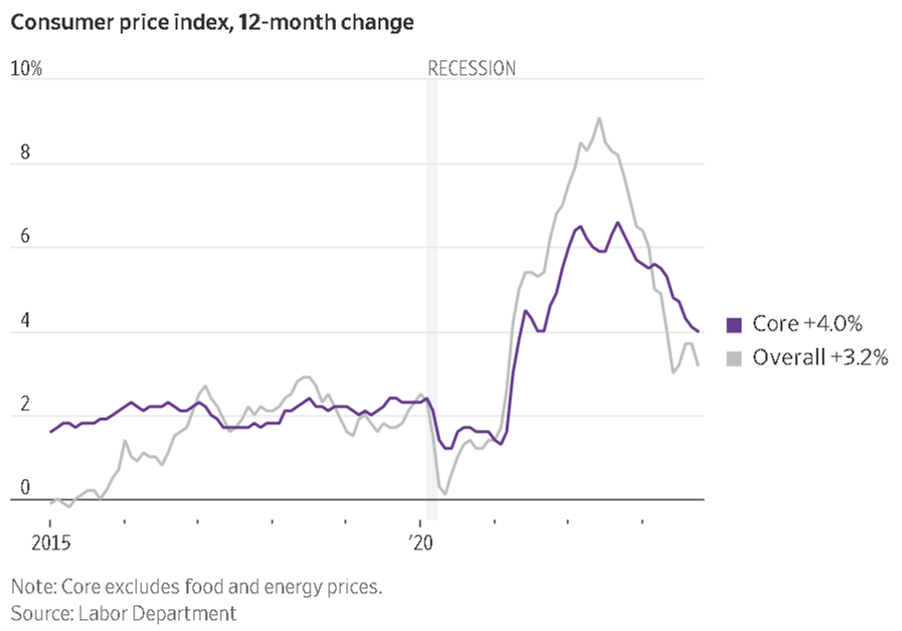
Both stocks and bonds reacted as they should to the positive news, but it seems they overreacted with the Russell 2000 gaining 5.4% and the ten-year Treasury at 4.44%, down 21 bps on the week and solidly below its 50-day Moving Average.
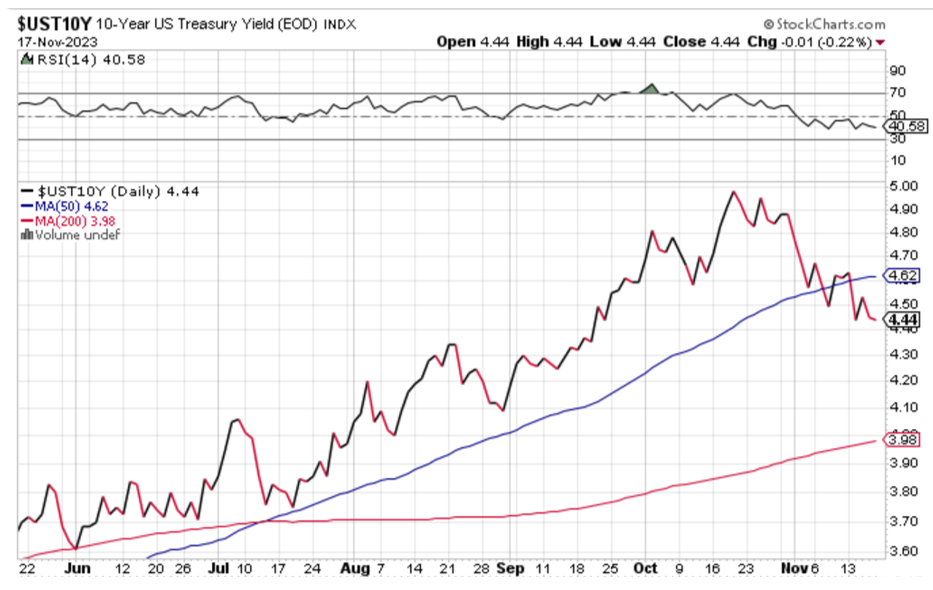
The Numbers
- CPI came in at 0.0% vs. a 0.1% forecast.
- Y/Y was 3.2% vs, 3.3% forecast with ex food & energy at 4%.
- PPI was more drastic at -0.5% vs. 0.1% forecast.
- Y/Y was 2.9% vs. 3.0% forecast.
Encouraging for sure but uncertainty remains as to how determined the Fed is to hold rates here or higher before they are convinced higher inflation will not return. Short covering was part of the move as rates had risen the previous week after tepid demand for a 30-year bond auction had left investors wary of the market’s ability to absorb new issuance. Monday will provide another opportunity to gauge investor demand for longer-term debt as Treasury auctions a 20-year bond.
Supply
Whether the rates market experiences the soft landing or not it must cope with increased supply that will fund our deficit. $2 trillion in new debt has already been issued this year and foreign buyers are accounting for a smaller piece of it. Ten years ago, they held 43% of Treasury debt and that figure is now 30% with China and Japan having reduced their holdings the most. For now, the market is optimistic about Fed policy close to changing but rates are already lower than their year-end projections.
The Week Ahead
A short holiday week with Fed speak, an active Treasury, and a light week for reports that includes Fed Minutes.
Monday – Treasury sells $143 billion 13 & 26 week Bills, $16 billion 20 year Bonds.
Tuesday – Existing Home Sales, Treasury sells $15 billion ten-year TIPS and $16 billion two-year FRN’s, FOMC minutes from the November 1 meeting.
Wednesday – Durable Goods forecast at -0.5%.
Friday – PMI Composite Flash

November 13, 2023
The $467MM November offering was the largest since May. The debenture rates for the 10-, 20- and 25-year pools, respectively, were 5.47%, 5.64% and 5.71%. Click this link for more pricing data: Current Debenture Pricing (eaglecompliance504.com)
There were a couple of key developments that influenced the reception and pricing of the offering:
- Benefit of a bond bear market rally. About two weeks before 11/9 pricing, the 10-year T-note yield repeatedly tested the 5% level which projected to 504 debenture rates clearly above 6%. By pricing, however, the T-note yield had fallen to 4.56% and so debenture rates were lower. This bear market rally lower in yield was typically sharp and caught many participants on the wrong foot, triggering short covering that fueled the rally. The Fed has repeatedly leaned against market betting that rate hikes are over and that rate cuts would start sometime in 2024. But the timing of the latest quick short-covering rally benefited CDC’s that received debenture rates a bit below the prior month. The bond market remains in the worst bear cycle in memory, one that in retrospect started off the 2020 pandemic low yield of 0.5% for the 10-year T-note. Any opportunity to produce stable m/m debenture rates in this difficult bear market seems a gift.
- Historically large SBA bid list. A large investor, a heavy participant in SBAP(1) and SBIC sales from 2019-21, put out a $460MM current face bid list of SBAP and SBIC the day before the 504 debenture offering was announced. The size and timing made this an historically anomalous event – over 37 years it never happened before. Both underwriters stepped up, bid strongly, and between them bought the entire list, then traded a good chunk immediately. The underwriters performed a crucial job they are hired to do - to use the balance sheet to support the SBA name in stressful situations. Clearly, between the bid list and the debenture offering, having $925MM of SBA name hit the market on Monday and Tuesday counts as an SBA-market-stressing event. Underwriters handled the situation with aplomb and as a result it did not disrupt the new offering.(2) Underwriter support assures SBA, CDC’s, Fiscal Agent, and investors that the SBA market will function smoothly through stressful events.
The maturity of the SBAP product, featuring well-accepted pricing convention, strong underwriter balance sheet support, and a good-sized buyer base, allowed for stable and solid execution in November. Below are updated rate/supply and effective rates charts.
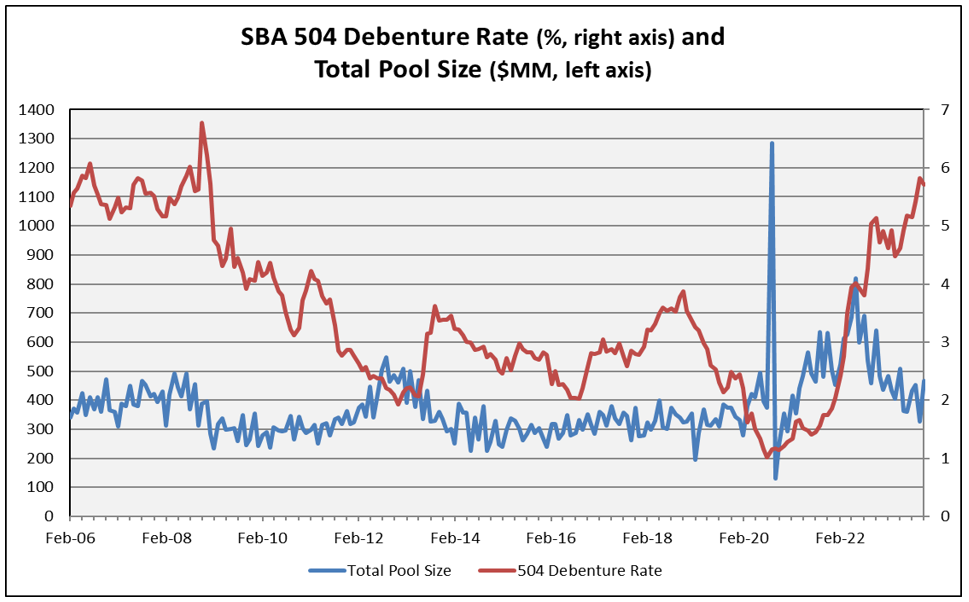
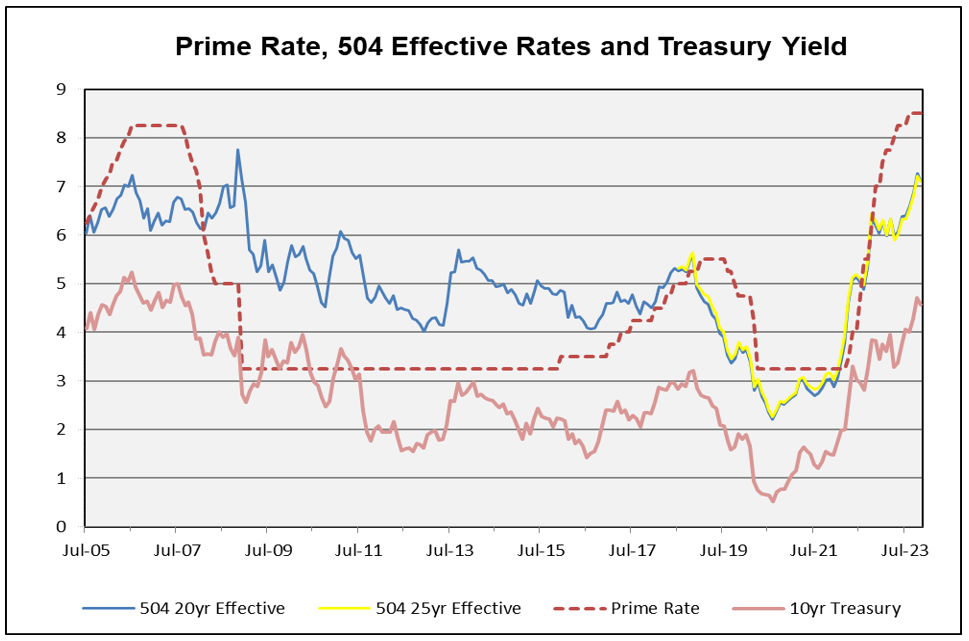
(2)A few investors who bought chunks bonds re-offered from the list did not participate in the new offering having used up their available cash.
November 6, 2023
Slow the Pace
That seems to be how the market interpreted Chairman Powell’s comments as he cited tight financial conditions yet kept the door open to more rate increases. Stocks traded higher and Treasuries rallied the most since March and the Silicon Valley Bank distress.
This dovish interpretation of Fed policy reflects the likelihood of no change at the December 12-13 meeting and a rate cut possibly in 2Q2024. Also implied is a soft landing for the economy as job growth is slowing but not affecting the economy.
Friday’s Non-Farm Payroll report of 150,000 was below expectations with its three-month average of 201,000 far below the 701,000 pace in the summer of 2021. Adding that to the Fed’s preferred inflation gauge showing 3.4% vs. 7.1% last summer it is understandable the market believes the data is trending in the right direction for 2% inflation.
This Reuters chart shows how the cost of funds has increased 525 bps since March 2022 and at 4.55% the ten year benchmark has increased by 233 bps.
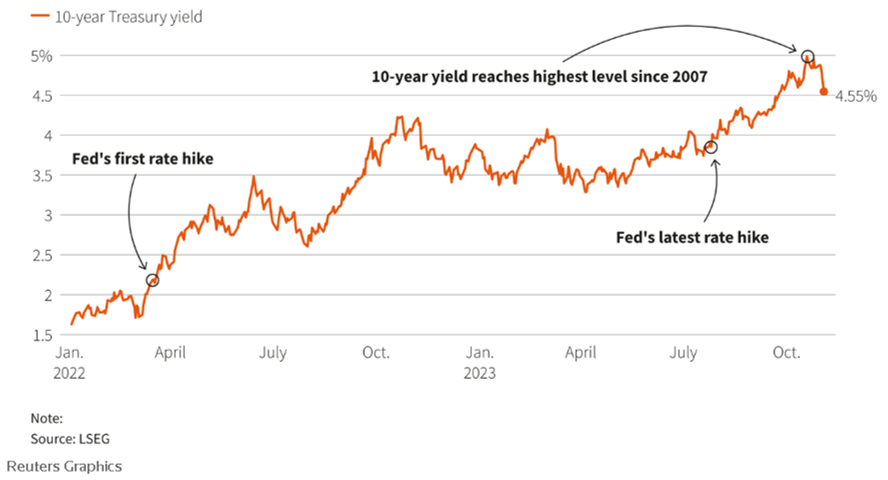
By Friday’s close the S&P 500 index had gained 5.9% on the week and Treasury rates had declined 40 bps from their recent highs, leaving the ten-year benchmark 17 bps lower than when the October SBAP debentures were priced.
These gains started after the Wednesday press conference and accelerated after Friday’s jobs report that included the unemployment rate rising to 3.9% and with wage growth slowing. Unemployment has increased 0.5% since April and average hourly earnings increased 4.1%, down from 4.3% in September and from 6% in March 2022.
As much as this decline in rate is beneficial it is difficult to be optimistic when you consider the future funding needs without the benefit of central bank buying and the cost of that debt service at rates significantly higher than during QE.
Other Reports
- The Treasury announced its quarterly funding schedule and while they will increase the size of it it will slow the pace of longer term financing. This, plus a weaker than expected ISM Manufacturing index report may have helped the post Powell news conference rally.
- Jobless claims were on target at 217,000.
- Factory Orders exceeded its forecast at 2.9%.
- The UK also held rates firm, at 5.25%.
The Week Ahead
Fed speak resumes, the SBA 504 program prices its November debentures, Treasury sells its quarterly funding program, and a very light week for reports.
Monday – Treasury sells $143 billion 13 & 26-week Bills.
Tuesday – 504 program announces its debenture sales, Treasury sells $48 billion three-year Notes.
Wednesday – Treasury sells $40 billion ten-year Notes.
Thursday – 504 program prices its November debentures, Treasury sells $24 billion thirty-year Bonds.
Friday – University of Michigan Consumer Sentiment expected to weaken.
October 30, 2023
Unsettled
On the week the ten-year benchmark traded as cheap as 5.02% and as high as 4.81% before it ended its erratic journey unchanged. Markets have shifted from locking in duration ahead of anticipated rate cuts to both the reality of increased issuance coupled with the Fed’s commitment to hold rates higher for longer. At 4.84% the benchmark sits just 12 bps above where the October debentures for the 504 program were priced.
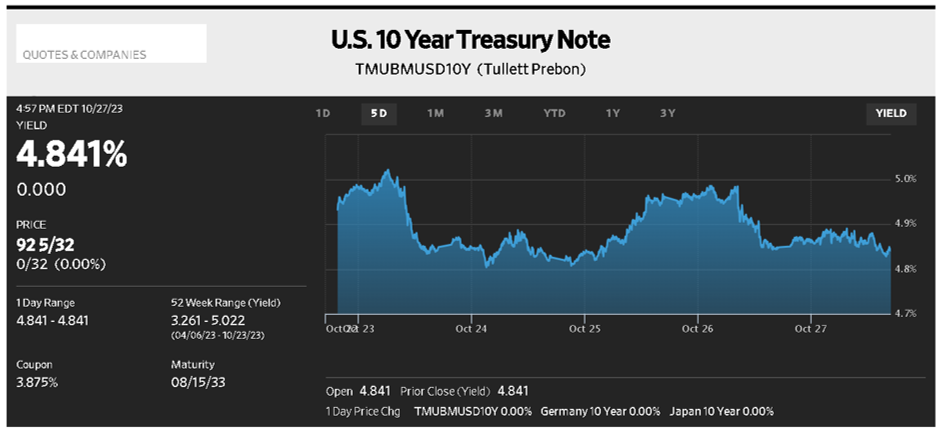
This Financial Times chart is part of their seasonal tradition to show the scariest chats in finance and this one displays the impact of significant borrowing during the pandemic with the rise in interest rates. As its header reads, “2023 total interest payment has reached the same level as 1980 total debt.”
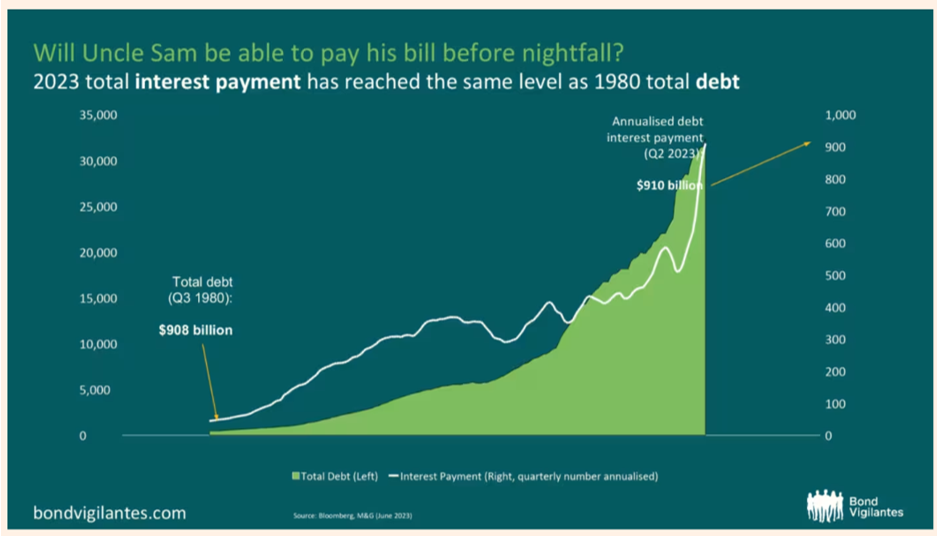
With the Fed continuing to roll off its purchases that inflated its balance sheet, plus reduced foreign buying of Treasuries it is hoped rates are high enough to attract buyers for the increased supply of debt. At a real yield of 2.43% (nominal ten-year rate less ten-year TIPS rate) EPFR (a service that tracks fund flows and allocations) reports that through the seven days ending October 25 funds bought $5.7 billion bonds, the highest amount on record.
Part of that activity was by Pershing Square, owned by Bill Ackman, a billionaire investor who covered his short position in thirty year bonds that he set in August, netting a $200 million profit. His rationale is “there is too much risk in the world to be short long term bonds at current long term rates.”
Reports
- 3Q2023 GDP at 4.9% was much stronger than consensus and greater than the 2Q rate of 2.1%.
- New Home Sales of 758,000 for September were much stronger than August’s level of 676,000.
- Durable Goods was 4.7% vs. a forecast of 1%.
- Personal Income declined to 0.3%.
- Personal Consumption Expenditures was unchanged at 0.4%, down slightly at 3.4% y/y, with the Core also down 0.1% to 3.7%.
Summary - economic strength continues to contradict forecasts for slower growth and increased unemployment while the Fed’s preferred inflation did decline.
The Week Ahead
No Fed speak until chairman Powell’s 2:30 press conference on Wednesday, a light Treasury calendar with focus on Wednesday’s decision, and jobs reports.
Monday – Treasury sells $143 billion 13 & 26-week Bills.
Tuesday – FOMC meeting convenes, Case & Schiller Index.
Wednesday – decision day for FOMC with Chairman’s press conference, Treasury quarterly funding announcement, ADP’s report on private sector employment.
Thursday – Jobless Claims expected to hold around 213,000.
Friday – Non-Farm payroll forecast at 183,000, down from September at 336,000.
October 23, 2023
What Safe Haven?
As the Israel-Hams war continues, the traditional flight to quality was muted as Treasuries sold off with the ten-year benchmark touching 5% before closing the week at 4.92%, higher by 19-bps on the week. Confirming that unsettled condition the 2/10 curve disinverted, going from -40 bps to -17 bps. In addition to increased Treasury supply part of the selloff in the back end of the curve might be attributed to Wednesday’s auction of $13 billion of a maturity that does not fit easily into many portfolios. The 20-year Treasury was auctioned at a median yield of 5.18% but the high yield award, or stop, for the bond was 6.5 bps cheaper meaning bidders were awarded more bonds than they thought. With a curve that is inverted but with pockets that are positively sloped (5/10 at +6 bps) the 20 year bond is 22 bps cheaper than the 30-year maturity.
And then Chairman Powell spoke on Thursday affirming the bank would extend the interest rate pause by indicating the Committee would not raise rates when it next meets on October 31-November 1.
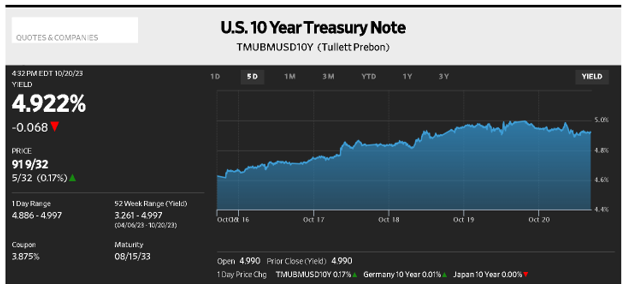
Mr. Powell stated in his speech the whole point of raising interest rates is to “affect financial conditions, and higher bond rates are producing tighter financial conditions right now.” That approach identifies the bond market doing the work of the Fed, allowing it to pause rate hikes and is interpreted by the market as such.
As for value, this rise in yield has made investment in fixed income products more attractive as real yields (Treasury yield minus TIPS rate) now stands at 2.42% for the ten-year benchmark, as seen in this Nasdaq.com chart.
Unlike the period of Quantitative Easing when real yields were negative investors are being fairly compensated now. That is why little more is expected from the Fed and why the Committee embraces a higher for longer concept.
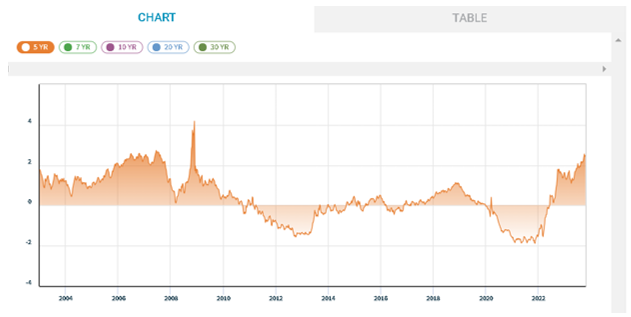
Reports
Last week’s reports were stronger than expected, adding to stronger economic growth than expected.
- Retail Sales at 0.7% exceeded the 0.3% forecast.
- Industrial Production at 0.3% exceeded its 0.0% forecast.
- Existing Home Sales maintained a 3.96 million annual rate, overcoming 30-year mortgage rates that approach 8%.
The Week Ahead
No Fed speak during the blackout period leading up to the October 31-November 1 FOMC meeting, Treasury is active as is the ACMBS market, and the Fed’s preferred inflation gauge is on Friday.
Monday – Treasury sells $143 billion 13 & 26 week Bills.
Tuesday – New Home Sales, Treasury sells $51 billion 2-year Notes.
Wednesday – Treasury sells $52 billion 5-year Notes and $26 billion 2-year FRN’s.
Thursday – Durable Goods expected to be 0.1% and 3Q GDP forecast to rise to 4.1%, Treasury sells $38 billion 7-year Notes.
Friday – Personal Income at 0.4% and Personal Consumption Expenditures at 0.3% and 3.4% y/y are slightly lower on the month.
October 16, 2023
A Flexible Curve
The terrorist attack in Israel produced a flight to quality as the ten-year benchmark moved from 4.80% to a low of 4.53% before closing the week at 4.63%. That move resulted in the issue’s outperformance as the curve resumed its inversion, moving from -28 bps to -42 bps with the two-year Note remaining above 5% at 5.05%.
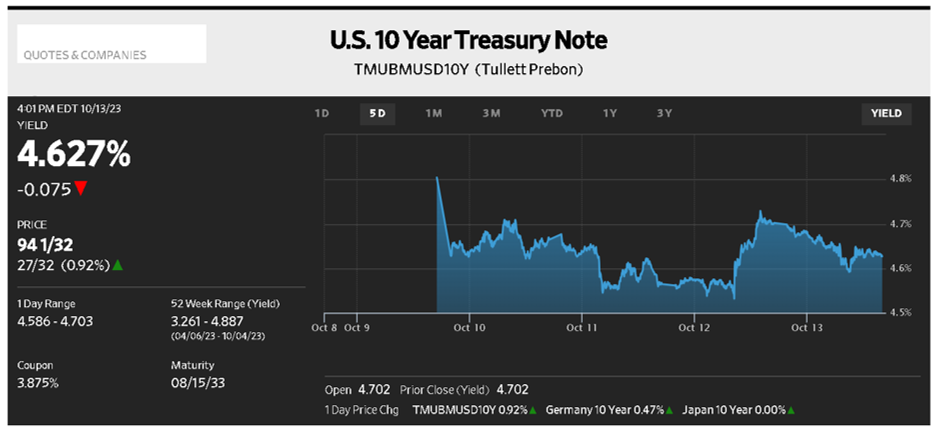
The already unsettled market is now compromised by this escalating conflict as Fed policy will be challenged by the market no longer doing the central bank’s job by having moved to higher rates. That was halted by demand for Treasuries while pressuring credit spreads wider as evidenced by a 30-year mortgage rate of 7.66%.
Slower Pace
Over the last 12-months the Fed has raised rates 225 bps yet at 4.63% the ten-year benchmark has risen just 61 bps with most of that increase coming in the last two months from increased Treasury issuance and repeated resolve from the Fed to keep rates higher for longer. With the Congressional Budget Office projecting a budget deficit of 5% to 7% of GDP for every year of the next decade, government policy will require increased issuance of debt which seems at odds with what the Fed hopes to achieve. Together, those events may reinforce the higher for longer concept even if the terminal rate has already been reached due to global influences.
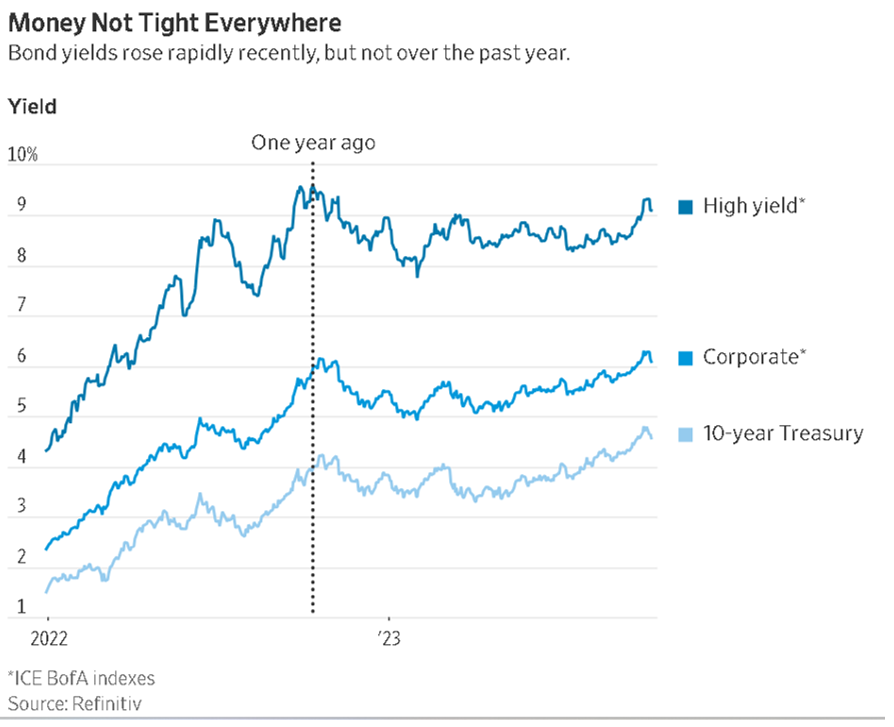
Reports
The week was dominated by inflation reports which came in higher than expected and coupled with weak demand for Treasury’s 30-year bond auction caused the late week selloff in the market.
- PPI rose 0.5% vs. a 0.3% consensus with y/y at 2.2% vs. a 1.7% consensus.
- CPI was 0.4% vs. a 0.3% consensus with y/y at 3.7% vs. a 3.6% consensus.
- Consumer Sentiment fell sharply this month to a 63 reading, down from 68.1 in September. Expectations for inflation rose to 3.8%.
- Minutes of the September 19-20 FOMC meeting identified its members believe interest rates have become restrictive, they unanimously voted not to increase rates at that time, and a majority felt one more increase would be appropriate.
The Week Ahead
More Fed speak, more Treasury and ACMBS issuance and few reports.
Monday – Treasury sells $143 billion 13 & 26 week Bills, about $20 billion more than previous weekly auctions.
Tuesday – Industrial Production forecast to decline to 0.0%.
Wednesday – Housing Starts & Permits, Treasury sells $13 billion 20-year Bonds.
Thursday – Jobless Claims forecast at 210,000, Treasury sells $22 billion 5-year TIPS.
October 9, 2023
The Higher for Longer Blues. The October 504 debenture offering was conducted in some challenging market conditions. Yields were sharply higher, the curve got into a weird shape, volatility spiked and spreads to Treasuries on everything were wider. Agency RMBS continue to weigh on the securitized market with investors full up after the $100+ billion FDIC sales from SVB and Signature bank portfolios plus Fed roll off of RMBS holdings. The Fannie Mae current coupon RMBS benchmark was 10 bps wider on the month as was the investment grade corporate bond CDS premium. Closer to home, agency CMBS lagged and were about 5 bps wider. The Freddie Mac 30-year mortgage average was 7.49% last week, the highest since December 2000.
Yet the 504 debenture (called SBAP) underwriters were able to set spread talk for the October deal tighter by 3 bps on the month as flows in the SBAP were firm, primarily from insurance company buying at higher yields, plus the small size of the October offering at $326MM. The 20- and 25-year pools priced at T+108 bps and T+110 bps, respectively. The debenture rates, at 5.80% and 5.82%, were up 41 bps m/m and the highest since December 2008.
The chart below shows that 504 debenture rates over the past four months have entered a range last regularly seen from 2006 to pre-Lehman 2008. The rates in 2006-07 were very typical of the pre-GFC market. In the pre-GFC world it was perfectly fine for the economy and borrowers to have today’s level of long-term interest rates. With Fed funds now at a top range of 5.5% the central bank will have plenty of room to cut rates when the economic cycle next moves from expansion to contraction. Perhaps the bigger problem this cycle has been the speed at which rates rose accompanied by high actual and expected volatility - those periodic m/m spikes in debenture rates directly related to the spikes in the 10-year T-note yield. At least spreads to Treasury for SBAP have tightened some, from T+125 in May to T+110 this month for the 25-year pool.
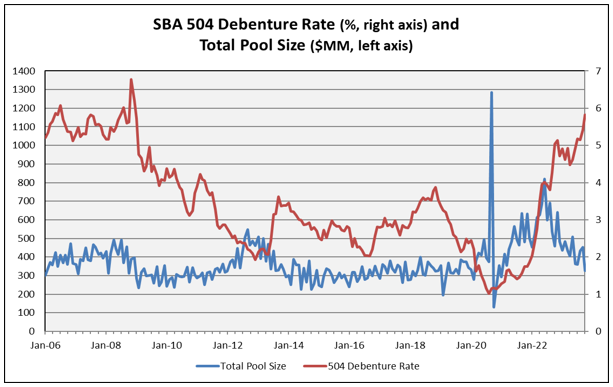
Once the Fed signals the tightening phase is through the yield curve will move back to a positive slope and spreads on mortgage-related securities like the 504 debenture pools should materially tighten and then be followed by other products such as SBAP. In 2006 for example the 20-year debenture spread ranged from roughly T+60 to 90 bps versus +108 bps in the October deal.
At the moment, however, the market has taken the Fed’s “higher for longer” message to heart and, combined with firm economic data and $1 trillion of Treasury borrowing slated for Q4, has beaten bond prices down. The Treasury yield curve is disinverting rapidly, the 2/10 spread was inverted over a point but now is inverted under 40 bps. The curve now has a weird shape as seen below.
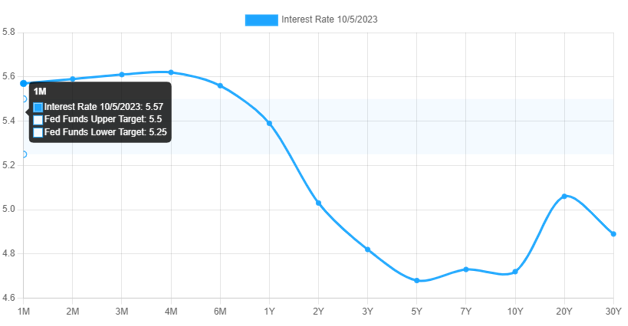
Short-term rates, such as Fed funds and T-bills, are well above 5% and have stabilized as the Fed nears finishing rate hikes. Longer-maturity yields moved sharply higher, however, for reasons mentioned above. This is a bearish move for sure. The higher for longer blues featured upside surprises in the economic data (e.g. non-farm payrolls) which really punished longer-term yields the last few weeks.
Long-term interest rates are likely to remain unsettled until the data suggest, and then the Fed confirms, that the market has priced in the appropriate amount of “higher for longer.” The problem is that may be a bit of a moving target.
October 2, 2023
Open for Business
As the debate raged in Congress Treasury rates continued north with the ten-year benchmark +14 bps on the week and +30 bps from when the 504 program priced its September debentures. The curve continues to heed Fed comments and has reset the 2/10 spread to -49 bps, 19 bps steeper from the September sale.
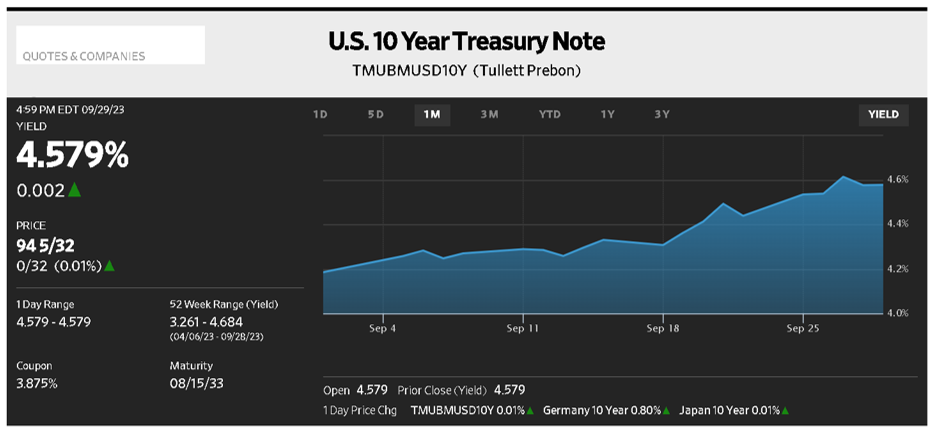
Just when it seemed stocks could sustain their rally the third quarter arrived, leaving the S&P 500 index holding on to a 12% gain ytd that is leaking as higher interest rates threaten the demand for risk. For the quarter, the index is down 3.6% with some of its biggest names like Apple down 12% as investors now have the option of risk-free, short term Treasury yields of 5.5%.
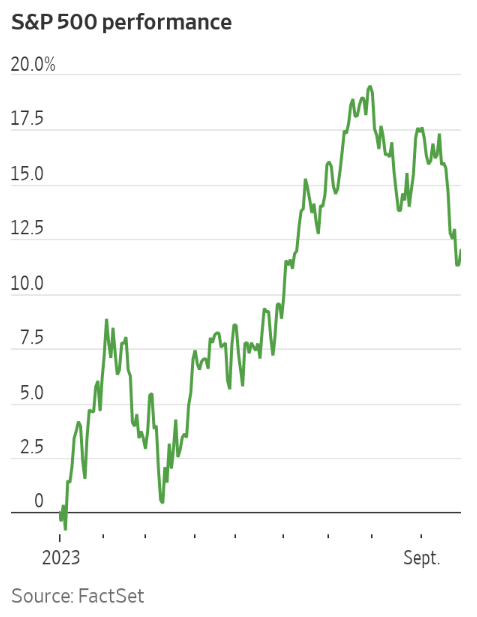
Continuing Resolution
Republican dissidents continued to thwart even short-term compromises, but with Democratic support Speaker McCarthy was able to extend funding to November 17 when spending cuts, funds for Ukraine, and border policy will again be debated. The need to seek a bipartisan deal highlights McCarthy’s precarious position as Republicans hold a thin four seat majority in the House.
Economic Impact
Even though this crisis is averted, any shutdown becomes a drag on the economy with cost to GDP of approximately 0.2% per week.
Additionally, a shutdown can hamper the Fed if certain agencies are unable to release economic reports essential for their analysis in a period affected by:
- The runup in interest rates
- A surge in oil prices
- The expanding auto worker’s strike
- The resumption of student loan payments
Reports
- Personal Income was as expected 0.4%
- Personal Consumption Expenditures were also 0.4% but weaker than consensus and core PCE is at its slowest monthly pace in three years.
- 2QGDP was 2.1%, below consensus.
- Durable Goods was 0.2%, stronger than the negative forecast.
- Jobless Claims were again below consensus.
The Week Ahead
The SBA 504 program is scheduled to price its October sale, a light Treasury calendar and Friday’s employment report highlight the week.
Monday – Treasury sells $135 billion 13 & 26-week Bills, ISM Manufacturing report.
Tuesday – SBA 504 program to announce its October sale, Treasury sells $44 billion fifty-two week Bills.
Wednesday – ADP Private Sector employment.
Thursday – 504 program to price its October sale.
Friday – Non-Farm Payroll expected to be 165,000, much weaker than its 236,000 12-month average.
September 25, 2023
No Fed, but Higher for Longer
One reason the back end of the Treasury curve held in so well was the market sentiment that the Fed was near its terminal rate and several rate cuts were expected before long. The desire to lock in duration of longer term debt was prominent, but that started giving way as short term rates approached 5.5% and investor attention turned to the front end of the curve with a willingness to roll-over investments at maturity.
Wednesday’s FOMC decision to leave rates unchanged pushed rates higher with a slight bear steepening trade that saw CT-2 trade as high as 5.20% while the ten-year benchmark broke out of its recent range by hitting 4.50%. Friday’s session saw rates decline as the market now knows we can expect:
- Another rate hike before year-end.
- Two rate cuts in 2024, down from four previously forecast.
- Inflation remains higher than the Committee expected.
- Unemployment is lower than expected.
- Higher rates for longer is real.
This WSJ chart identifies how this more gradual approach differs from traditional Fed actions where rate cuts were fast; this time the Committee hopes to take the stairs down and analysts are skeptical.
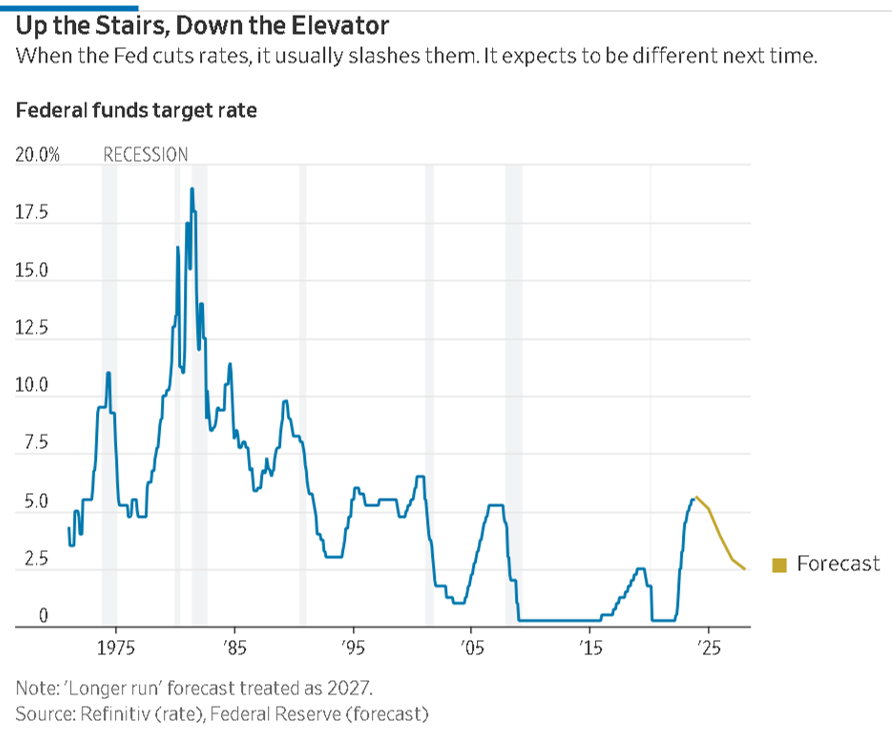
By doing this the article states “the Fed’s hope is an unusual one, growth will come in higher than expected, and inflation lower.”
With at least one more rate hike and just two cuts in 2024 the median forecast for rates next year has increased to 5.1% from the previously forecast 4.6%.
Surprising economic growth is in place after 525 bps of rate increases and the Fed seems confident of a soft landing while being more focused on achieving a sustained level of lower inflation. Two Fed Bank presidents on Friday affirmed interest rates will stay higher for longer and it is unlikely inflation will decline to 2% in 2024. The Fed’s Summary of Economic Predictions looks for inflation to be 3.3% this year, trending to 2.5% in 2024 and 2.2% in 2025.
- Equities continued a weak September with a choppy week in response to expensive oil and confirmation that Fed policy will not be reversed soon.
- Economic reports like Housing Starts and the PMI Composite Index came in weaker than forecast.
- UAW strike expanded to 38 facilities with auto makers closing additional sites that depend on that supply chain.
- Last Saturday was the not so happy 25th anniversary of “when genius failed,” the bail-out of the hedge fund Long Term Capital Management.
Countdown to October 1
House Speaker McCarthy may need Democratic support to overcome the faction of Republicans that have resisted attempts to fund the government. Unless that caucus softens its demands on the Speaker, he may be at risk of weakening his position by seeking Democrat votes and in doing so accommodate some of their demands that would further alienate that Republican faction and risk his tenure as Speaker. Two of the twelve bills needed to fund the government were already blocked last week and another vote is tentatively scheduled for Tuesday. At risk is a government shutdown that would see hundreds of thousands of Federal employees furloughed.
The Week Ahead
Budget talks are center stage with Treasury supply and the Fed’s preferred inflation gauge on Friday.
Monday – Treasury sells $131 billion 13 & 26-week Bills.
Tuesday – Treasury sells $48 billion 2-year Notes.
Wednesday – Treasury sells $49 billion 5-year Notes.
Thursday – Treasury sells $37 billion 7-year Notes.
Friday – Personal Income expected to increase to 0.4%, with Personal Consumption Expenditures forecast at 0.5%, 3.5% y/y and the core, ex food & energy, declining to 3.9%.
September 18, 2023
Rates and Inflation
Those topics lead to many questions, here are three of them:
- Is the Fed done?
- Bull or Bear market?
- Hard or soft landing?
The FOMC meets this week and there is a 95% probability there will be no change in rates, but at least one more increase is expected by year-end.
The ten-year Treasury benchmark rate has risen 15% ytd and closed last week at 4.33%, just 5 bps above where the 504 program priced its September debentures and analysts believe it is near its peak. The S&P 500 index is +16% ytd with much of its gains driven by the tech sector whose gains have slowed recently, leaving the major indexes flat last week and in need of some stimulus.
The debate over a possible recession swings back and forth but it seems a soft landing is more likely than not. What can affect that development is labor negotiations like the length of the selective strike that began Friday by the United Auto Workers and how long the strike lasts and how close the union can get to their demands for an estimated 36% wage increase. Not all 146,000 members walked out so the immediate impact is lessened, but the counteroffer from the three auto makers is not close to their wage demands nor does it address the impact that building electric vehicles will have on their union’s work force.
Good News on Inflation?
CPI came in as expected and PPI was higher than expected and did push rates higher late in the week.
| Index | Actual | Consensus | YTD | Core Y/Y |
|---|---|---|---|---|
| CPI | 0.6% | 0.6% | 3.7% | 4.3% |
| PPI | 0.7% | 0.4% | 1.6% | 2.2% |
The core rate for CPI was down from 4.7% in July and if there is a positive for this rate it would be in a shorter time frame since over the three months through August its rate on an annualized basis is 2.4%, down from a 5% rate for the preceding three months.
What might offset any optimism derived from this sample is a 4% weekly increase in Brent Crude as the output cuts initiated by OPEC put its ytd gain above 20%.
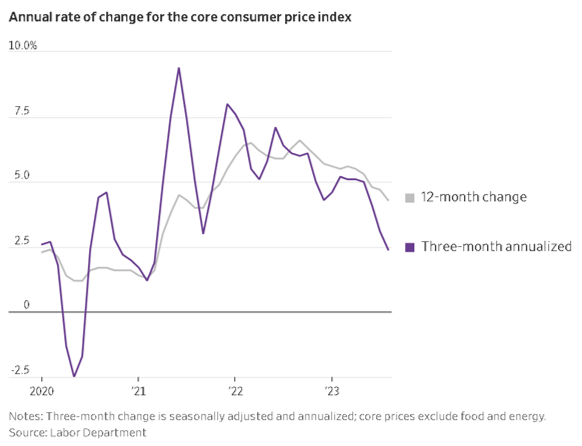
Countdown to October 1
We are two weeks away from government funding expiring and hard core Republicans want to expand their unfinished work from June when they protested a debt ceiling deal with President Biden. Their goal is to cut federal spending and increase border security and party leaders agree a short term continuing resolution will be needed but the dissidents worry that will include large scale spending for administration initiatives that would increase our $2 trillion deficit and $33 trillion national debt.
The Week Ahead
No Fed speak until Wednesday’s decision and the Jay Powell press conference, a light week for reports and Treasury.
Monday – Treasury sells $131 billion 13 & 26 week Bills.
Tuesday – FOMC meets, Housing Starts
Wednesday – FOMC announcement and press conference
Thursday – Jobless claims forecast at 225,000, Existing Home Sales
Friday – S&P Global PMI
September 11, 2023
Smooth sale amid heavy supply. The September SBA 504 debenture offering was smooth despite $36 billion of corporate supply from about 40 issuers that hit just on Tuesday, the day when we marketed the deal to investors. Underwriters did a good job of pre-holiday marketing and then got the deal placed amid that huge load of corporate issuance. On good demand, we were able to snug the spread to Treasury in by 2 bps m/m for the 20- and 25-year pools, +111 bp and +113 bps, respectively. But 10-year Treasury yield rose 28 bps m/m so the 20- and 25-year debenture rates were up 26 bps m/m. The 10-year pool debenture rate was similar to July’s. Details are available at this link: Current Debenture Pricing (eaglecompliance504.com)
That heavy corporate hedging plus investors clearing space for the new supply helps explain why the 10-year Treasury yield popped up in the days before the debenture sale. September is seasonally a time of heavy corporate supply. In general, supply in corporates, agency-guaranteed residential mortgage-backed securities (RMBS) and Treasuries has been a big story this year as the bond market rebounds from the horrible bear market of ‘22.
RMBS liquidations have affected 504 debenture spreads this year. More materially for 504 debenture spreads this year, the FDIC in April announced the sale of well over $100 billion in RMBS from the portfolios of failed Silicon Valley Bank and Signature Bank. While these liquidations were orderly, spreads on RMBS to Treasury had to widen from already wide levels, and stayed there as the auction lists were traded. RMBS spreads already had widened to adjust to the Fed rolling off $35 billion of RMBS per month as part of its quantitative tightening policy.
The RMBS market is massive, at $12 trillion outstanding, and spread movement there will act as a “tractor beam” on other securitized product spreads, including SBA debenture pools. When RMBS spreads widen, eventually SBA widens and vice versa. For example, comparing the two charts below, we see the notable correlation between mortgage spreads (top chart, in this case the 30-year mortgage average minus the 10-year Treasury yield, last around T+300 bps) and benchmark 504 debenture spread (bottom chart, last at T+113 bps).
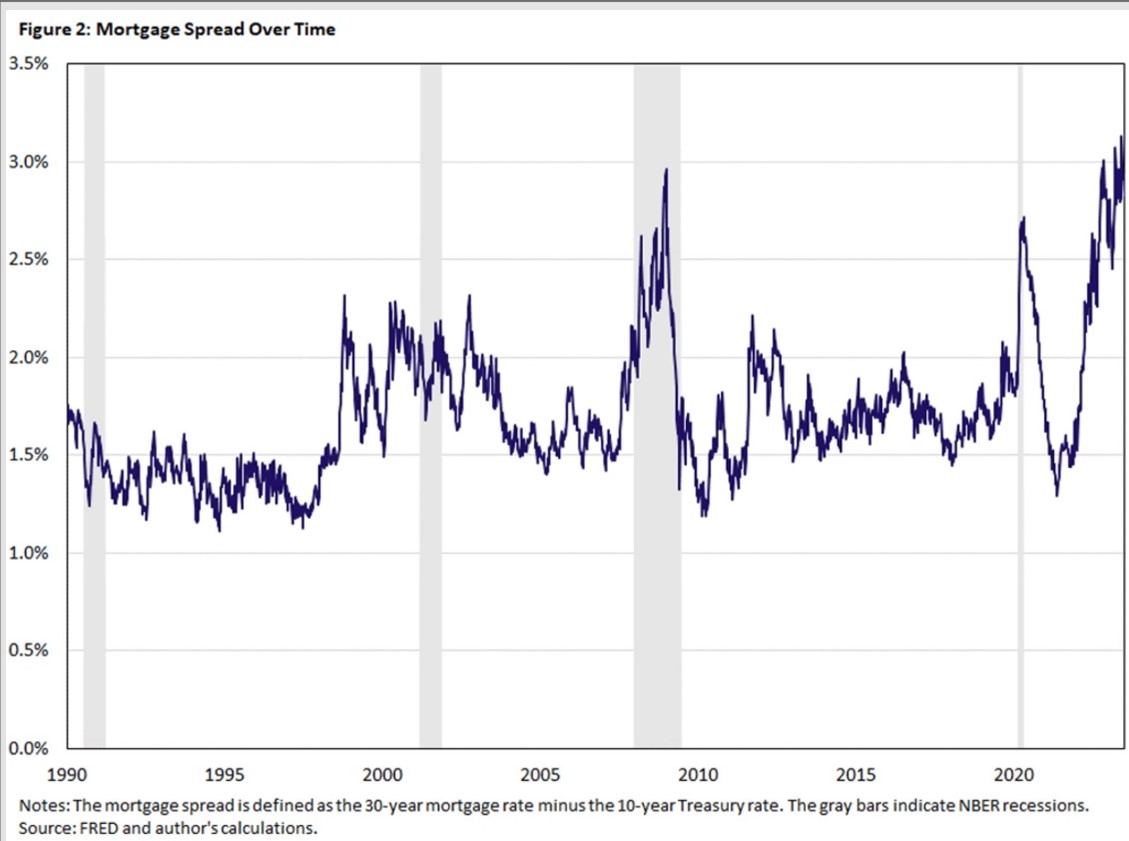
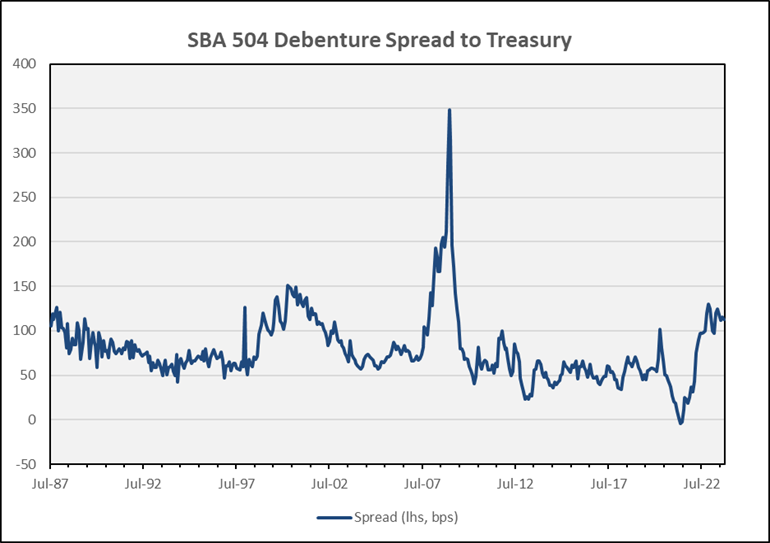
So heavy supply everywhere, including Treasuries of course, explains in part why 504 debenture spreads to Treasury remain wide despite recently lower historical and expected interest rate volatility, and even with the Fed possibly finished with rate hikes. Some good news is that the FDIC has completed the RMBS auctions which should help stabilize MBS spreads, but possibly at very wide historical levels. The protracted deeply inverted Treasury yield curve, however, continues to contribute quite a lot to these stuck-wide spreads in prepayment-sensitive products like 504 debenture pools.
Effective Rates remain well below Prime. Looking ahead our hope is that a sidelined Fed will stabilize Treasury yields in a stable range and with the bulge of supply past, offer the opportunity for debenture spreads to tighten a bit. Overall, however, if Treasury yields remain rangebound, then 504 debenture rates will tend to remain range bound. It’s worth noting that SBA 540 effective rates remain well below Prime, at a spread (minus 169 bps in Sep.) in the past associated with the end of a Fed tightening cycle. Eagle posts a chart of effective rates and Prime at this link: Monthly 504 Interest Rate (eaglecompliance504.com).
September 5, 2023
JOLTS
That is the acronym for Job Openings and Labor Turnover Survey from the Bureau of Labor Statistics whose Tuesday’s release showed demand for labor in July was 8% below forecast, reflecting less demand. That pushed the benchmark ten-year yield as low as 4.05% before moving higher after Friday’s Non-Farm Payroll report where an unemployment rate increase to 3.8% confirmed the job market is slowing in response to eleven rate hikes from the Fed.
This closing level is 18.6 bps above where the SBA 504 program priced its August debentures, and the futures market reflects a 93% probability that the FOMC will not raise rates when it meets on September 19-20.
Short-term rates reflected this cautious optimism as they rallied more than the back end of the curve with the 2/10 curve dis-inverting by 14 bps to -70 bps.
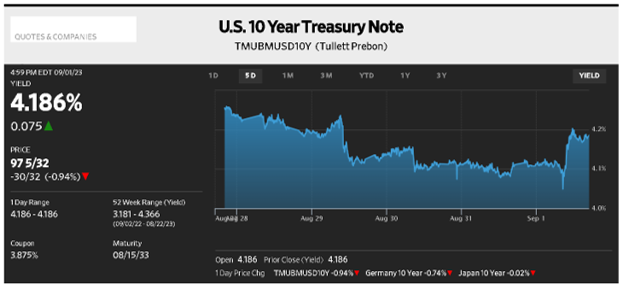
Friday’s jobs report of 187,000 was close to its forecast but June and July were revised down by 110,000 reducing the three-month average to 150,000 vs. the March-May average of 238,000, further confirmation of slowing growth while consumer demand and inflation remain high.
Reports
The week had many reports that mostly captured the softer economy where Fed action is data dependent as the Committee balances economic stability with its hawkish monetary policy.
- JOLTS was sharply lower, its lowest level in two years.
- Second estimate of 2Q2023 GDP declined to 2.1%.
- The Consumer Confidence report on Tuesday was sharply lower m/m and from the consensus.
- Personal Income declined to 0.2% from 0.3%.
- Personal Consumption Expenditures were unchanged at 3.3% y/y with the core reading at 4.2%.
Summary
The economy seems to be slowing as inflation moderates but remains above the Fed’s 2% target.
Stocks gained an average of 3% on the week but ended down for the month while rates were lower on the week, even after bond bears were squeezed and some hawkish Fed speak advocated for another rate increase.
No Fed action is expected on September 20, though Chairman Powell cautions that previous rate hikes have not achieved as much as had been expected.
The Week Ahead
The SBA 504 program prices its three September debentures, no Fed speak leading up to FOMC meeting, a light week for Treasury and ACMBS issuance, with few reports.
Tuesday – 504 program announces its September debenture sales, Treasury sells $131 billion 13 & 26 week Bills, Factory Orders expected to be -2.5%.
Wednesday – ISM report on Business Services PMI expected to decline.
Thursday – 504 program prices its 10, 20 and 25 year debentures.
Friday – Consumer Credit forecast to increase by $16 billion in July.
August 28, 2023
Flat
That word summarizes last week’s market activity except for the 2/10 Treasury curve reinverting after Jay Powell’s speech on Friday. While the major stock indexes treaded water and the benchmark ten-yar declined 2 bps to 4.23%, the two-year Note’s rate increase moved the 2/10 curve from -68 bps to -84 bp as the Chairman reiterated that inflation “remains too high” and rates would be held here or higher until inflation is reduced to 2%. The takeaway from the speech is the Fed will “proceed carefully” on further rate increases, cautioning that previous increases had yet to slow the economy. The market does not expect a twelfth rate hike in September but does not expect a rate cut until June 2024, and that probability declined to 64% after the speech.
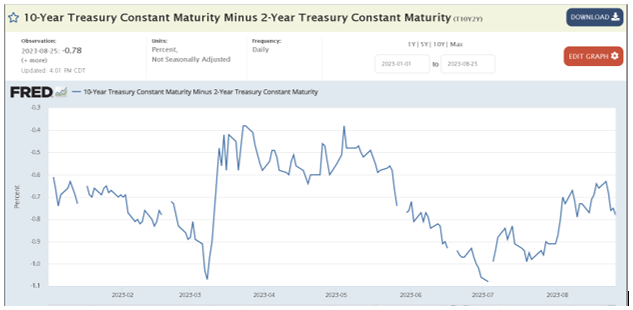
Stocks continue their August slog while fixed income securities, while subject to higher rates are now providing a safer and more attractive return for investors.
Downside Economic Risk vs. Upside Inflation Risk
This simple comparison captures the Fed’s dilemma as they balance taming inflation without putting the economy into recession. The fact that 525 bps of rate increases has not budged the unemployment rate higher than 3.5% adds to uncertainty about the future. We get the jobs update on Friday as well as more inflation data on Thursday.
Home Sales
With homeowners reluctant to sacrifice their sub 4% mortgage rates home sales have declined not because of price but lack of supply. Another consideration is the cost of financing that has increased to 7.23% for a 30-year mortgage, according to Freddie Mac. Applications have dropped to their lowest level since 1995 and fell for the fourth time in five months in July, but the national median value of homes increased to $406,700.
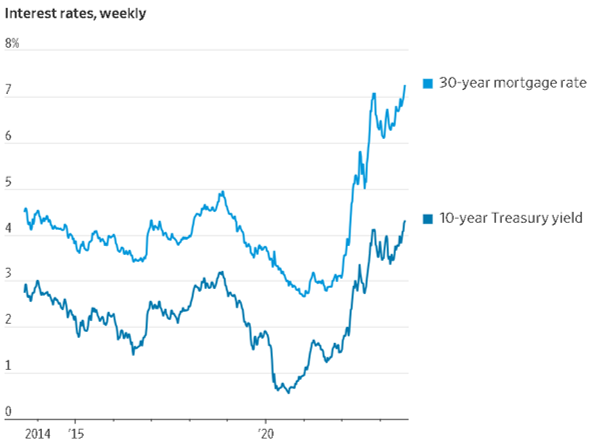
Reports
- Reflecting the supply of homes, existing home sales in July declined while new home sales increased.
- Durable Goods orders at -5.2% declined more than forecast vs. the June reading of +4.7%.
- Consumer Sentiment declined in July with year-end inflation expectations rising to 3.5%.
The Week Ahead
Fed speak, an active week for Treasury, and the Fed’s preferred inflation gauge expected to increase slightly, with job gains holding steady.
Monday – Treasury sells $131 billion 13 & 26 week Bills, $45 billion 2 year Notes and $46 billion 5 year Notes.
Tuesday – Case Shiller Home Index, Treasury sells $36 billion 7 year Notes.
Wednesday – 2Q2023 GDP expected to be 2.4%.
Thursday – Personal Income & Outlays, PI forecast unchanged at 0.3% with PCE 3.3% y/y and the core reading at 4.2% y/y.
Friday – Jobs report expected to be 170,000.
August 21, 2023
Rates Rise, China Declines, Markets React
Starting with US rates it seems that an increasing budget deficit matched by its need for increased Treasury issuance added to concerns of additional rate hikes to push Treasury rates higher. This WSJ chart shows the benchmark ten-year Note traded as high as 4.31% last week, close to its highest level in sixteen years. The closing rate of 4.25% is 25 bps higher than when the 504 program priced its August debentures eleven days ago.
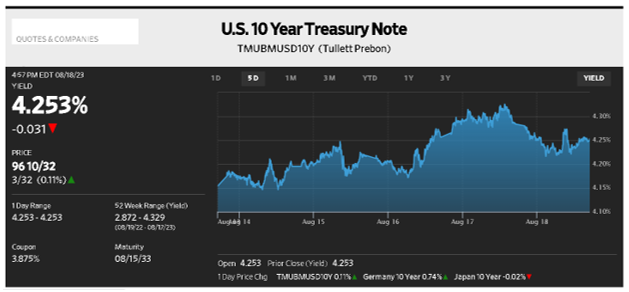
Minutes from the July FOMC meeting indicated the Committee felt there was “significant risk to upside inflation” even though many members are cautious about more rate hikes. Adding to the previously mentioned increased Treasury issuance is decreased buying from Japan and China, the two largest buyers of Treasury debt whose holdings are down 11% since last June.
Their reduced activity may have contributed to the recent rise in rates after a weak 30-year bond auction on August 10 ignited the recent selloff.
With Treasury issuing a net amount of $1 trillion this quarter most of the debt is in shorter-term Bills, explaining why Money Market funds attracted $36 billion in the week ended August 16. Since June investors have pulled $11.6 billion from stock funds and added $91.1 billion to money market funds now offering rates above 5%.
It seems unlikely for both stocks and bonds to weaken simultaneously, but they have, with the S&P 500 down 2% last week and 4.5% for the month.
So, the summary of events is increased issuance with decreased foreign buying with the potential of rates higher for longer.
Central Bank Moves

Those are the directions for Russia and China. With focus in the US fixed on how high and for how long the Fed will keep rates, these two countries are in a state of flux: Russia raising its key rate by 3.5 percentage points to 12% while China cut its key rate to 2.5%, its lowest level since 2014.
Russia is dealing with a sanction affected weak ruble that has devalued 35% this year as it finances its special operation in Ukraine while China tries to recover from its Zero Covid policy that shut down its economy.
Of more interest is China where slowing property sales and new construction have combined with weak retail sales and industrial production reports to cause concern. Preferring not to disclose rising youth unemployment levels China dropped the category from its recent report, leaving the June rate of 21.3% as its last indication.
The Week Ahead
Fed speak, more Treasury and ACMBS supply and a few reports.
Monday – Treasury sells $131 billion 13 & 26 week Bills.
Tuesday – Treasury sells $40 billion 40-day Bills, Existing Home Sales.
Wednesday – PMI Composite Flash expected to be unchanged for services and manufacturing, New Home Sales, Treasury sells $24 billion 2-year FRN’s and $16 billion 20-year Bonds.
Thursday – Advanced report on Durable Goods, Treasury sells $8.1 billion 30-year TIPS.
Friday – University of Michigan Consumer Confidence report expected to be flat with inflation projected at 3.3%, Jay Powell speaks.
August 14, 2023
Current Debenture Pricing
The combined August 504 debenture offerings were $433 million, a welcome increase in size from the prior two months, both of which were about $360 million. The 20-year debenture was $26 million, the smallest such issue since October 2020. The following table shows monthly average offering sizes for 20- and 25-year debentures in 2023 and 2022:
| 2023 average monthly volumes | 2022 average monthly volumes | |
| 25-year debentures | $387 million | $516 million |
| 20-year debentures | $35 million | $69 million |
Initial price talk for the issues was 10-year Treasury +113 for the 20-year debenture and 10-year Treasury +115 for the 25-year debenture. These levels were 3 bps wider than the levels for the 20- and 25-year July debenture offerings and that is where they were priced. The coupons on the 20-year and 25-year debentures were 5.13% and 5.15%, respectively, and were 3 bps lower than the coupons for the July debentures. The 10-year Treasury note was 4.00%, 6 bps lower than when the July debenture was priced.
The market tone for the August sale was somewhat soft, with credit spreads for Freddie Ks and Fannie DUS securities widening by 5 bps since the July sale. The 10-year Treasury yield was volatile over that period, ranging from 3.75% to 4.19%. The yield was stable during the offering period at 4.00%, as the market concern over the Fitch US debt downgrade and heavy upcoming Treasury supply was offset by a weaker than expected July employment report. The CPI report on Thursday morning prior to pricing was benign, but a weak 30-year Treasury auction Thursday afternoon triggered a market sell off, with the 10-year note yield rising to 4.15%. The question now is whether the recent bear market steepening of the yield curve due to rising long rate yields is driven by expectations for a hawkish Fed as the economy continues to show strength, or concerns over heavy Treasury supply (or both).
Adding to pressure in the back end of the curve was confirmation that as of August 9 the Fed has allowed almost $1 trillion of its $8.55 trillion portfolio to run off. The absence of this covid-era buyer, a form of Quantitative Tightening, only increases the supply of debt private investors need to absorb.
For the September 20 Fed meeting, futures are projecting a 10% probability of a 25 bps rate hike and a 30% bps probability of a 25 bps hike rate hike by year end.
Investor Distribution
2023-20H
| Money Managers | 46% |
| Banks | 19% |
| Insurance Companies | 35% |
2023-25H
| Money Managers | 45% |
| Banks | 6% |
| Insurance Companies | 49% |
The Week Ahead
Monday – Treasury sells $131 billion of 13 & 26-week Bills.
Tuesday – Retail sales forecast at 0.4%. Minneapolis Fed President Kashkari speaks.
Wednesday – Industrial production expected to be +0.3%. FOMC minutes of July meeting released.
Thursday – Leading Indicators expected to decline for the 16th straight month.
August 7, 2023
On Guard
The big event last week, ahead of the jobs report, was a second rating agency downgrading US debt to AA+. Fitch joined Standard & Poor’s 2011 downgrade by citing “frequent political skirmishes, a growing debt burden, and an omission of governance” as reasons for its action.
As an example of the growing debt burden this WSJ chart using CBO data identifies the changes in the agency’s ten-year estimate of Treasury debt as a percentage of GDP. Its title channels the Harry Doyle character from the movie Major League as this percentage is expected to accelerate above 100% compared to the 2011 estimate forecasting a 76% rate around the current fiscal year.
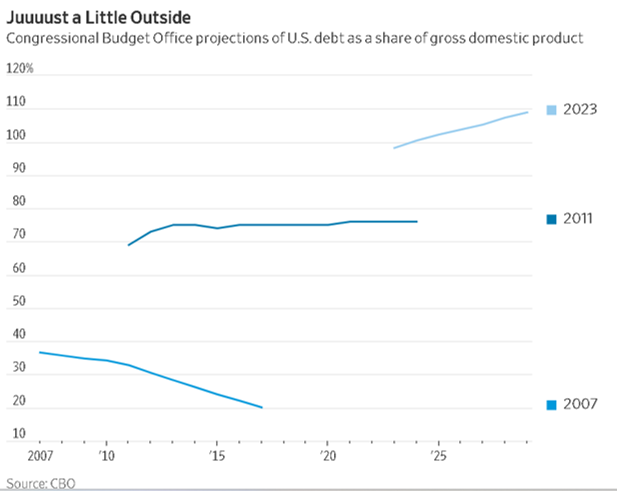
Net interest on this debt will reach $745 billion in 2024, about three quarters of discretionary spending ex defense, and with Treasury funding more of its debt in short-dated maturities the rollover cost will remain high until the Fed reverses its tight money policy.
Piling On
For 3Q2023 Treasury is expected to raise $1.077 billion in new money with $829 million of that in Treasury Bills with Q4 funding adding $852 million in new issuance with $513 million in Bills. This announcement may have contributed to the Fitch driven selloff that drew attention to a claim that a hedge fund is betting on long term rates rising because inflation is unlikely to reach 2% and the Fed may have to adjust its target.
One example of what is different from eleven years ago when S&P downgraded Treasury debt is that rates declined then, starting a decade long rally. Now, the market is paying renewed attention to inflation, tighter credit in an inflationary environment, and skepticism about the global economy. The short term effect last week was the ten-year benchmark rose as high as 4.20% before declining to 4.05% after Friday’s jobs report.
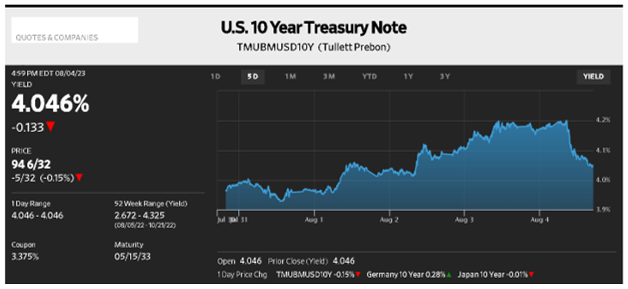
That level is just 1 bps off where the 504 program priced its July debentures though credit spreads have softened along with a changing, bear steepening Treasury curve. On the week the 2/10 curve steepened 19 bps to -73 bps as the front end of the curve outperformed. Perhaps the market now believes a soft landing is possible and if so then the market may be capable of tolerating higher rates for longer.
Economies
- It was a light week for domestic reports with the jobs numbers coming in below forecast at 187,000 with downward revisions for previous months. The unemployment rate declined to 3.5% and wages held firm at 4.4%, indications that employment is slowing, but not by much. The above chart shows how rates rallied but stocks lost most of their gains late and ended the week with indexes losing from 1.1% for the Dow to as much as 2.9% for the Nasdaq.
- Internationally, the Bank of England raised rates by 25 bps as it deals with an inflation rate at 6.9% while British Airways just offered its workers a 13% hike over 18 months.
- That increase pales to Lufthansa’s offer of 25% for captains and up to 50% for pilots, evidence of the labor challenges faced in aviation.
- China stands apart as it flirts with deflation due to weak consumer demand and private investment as it tries to recover from its Zero Covid policy that shut down its economy. The world’s second largest economy grew at 0.8% in 2Q2023, and its producer price index has declined for eight consecutive months.
The Week Ahead
SBA 504 Program conducts its August debenture sale, Fed speak, the quarterly Treasury refunding and inflation data.
Monday – Treasury sells $127 billion 13 & 26 week Bills.
Tuesday – 504 Program announces its August debenture sale, Treasury sells $40 billion 52 week Bills and $42 billion 3 year Notes.
Thursday – 504 Program prices its August debentures, Treasury sells $23 billion 30 year Bonds, CPI forecast at 0.2%.
Friday – PPI forecast at 0.2%, Univ. of Michigan Consumer Confidence is expected to weaken after a big jump in June. Year ahead inflation projected at 3.4%.
July 31, 2023
Central Bank Scorecard
It was a clean sweep for action as the Fed, the ECB, and the Bank of Japan all tightened policy though Japan’s move was more nuanced.
- On Wednesday the FOMC announced its eleventh rate hike moving its band for federal funds to 5.25%-5.50%, the highest level in 22 years.
- That was followed by the ECB’s decision to raise its benchmark rate to 3.75%, also its highest level since 2001.
- Bank of Japan’s decision was to soften its Yield Curve Control by effectively raising the upper end of the trading band for its ten-year yield to 1% from 0.50%, a level at which it would intervene in the market to buy the security. This was partly in response to the June inflation rate coming in at 4%, double the bank’s target.
The first two announcements were expected and had little effect on the market, but BoJ’s move surprised the markets on Thursday when rumors of the announcement led traders to speculate that a higher yield might influence Japanese investors to repatriate their cash, sending the ten-year Treasury yield higher by 14 bps to 4.01%.
This WSJ chart shows how the Note recovered on Friday to close the week at 3.95%, 11 bps lower than when the 504 program priced its July debentures 24 days ago. Since that day the 2/10 curve is slightly less inverted and ACMBS supply has increased, moving credit spreads a bit wider.
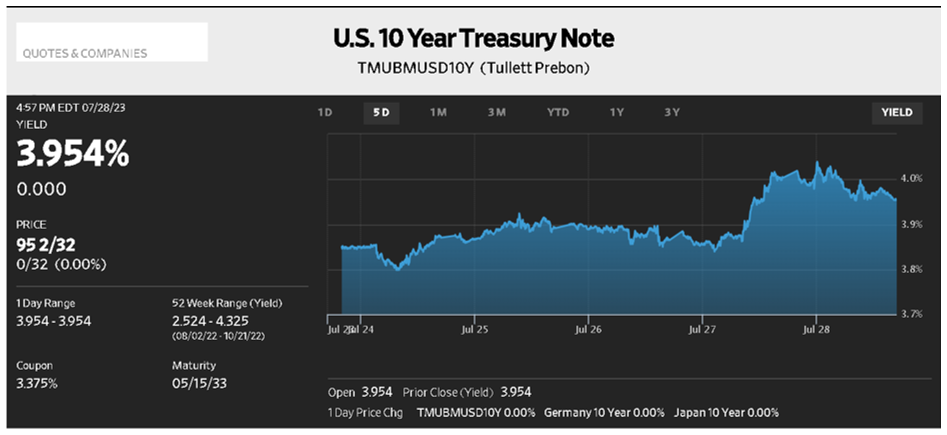
Other contributing factors to Treasury market weakness on Thursday might have been a weak auction for $35 billion seven year Notes combined with a stronger than expected 2.4% gain for 2Q2023 GDP. The GDP report did show slower consumer spending that was offset by strong business investment in both inventories and fixed assets. Confirming that analysis was the Durable Goods report that was far above consensus at 4.7%.
All Rise
The International Monetary Fund has raised its forecast for the global economy by .02% to 3% cautioning that strong labor markets and consumer demand will make it difficult to root out inflation. That sentence includes the two items that identify central banks dilemma:
- Is the Fed now achieving a soft landing bringing down inflation without major damage to the economy?
- Or is the economic strength going to make it harder to achieve their 2% inflation goal?
Adding to the confusion was Friday’s report on Personal Income and the Fed’s preferred inflation gauge, Personal Consumption Expenditures. Personal Income declined to 0.3% while both measures of PCE declined – the overall measure dropped 0.8% to 3% while the core index declined 0.5% to 4.1%. Very encouraging readings that the rates market mostly ignored on a quiet summer Friday.
Markets
Stocks enjoyed a better week as they sharply recovered from Thursday’s weakness in response to Friday’s inflation report. This chart shows continued improvement, especially for the tech heavy Nasdaq and investors who stayed the course with the S&P 500 have seen its 19% gain in 2023 match its 2022 decline.
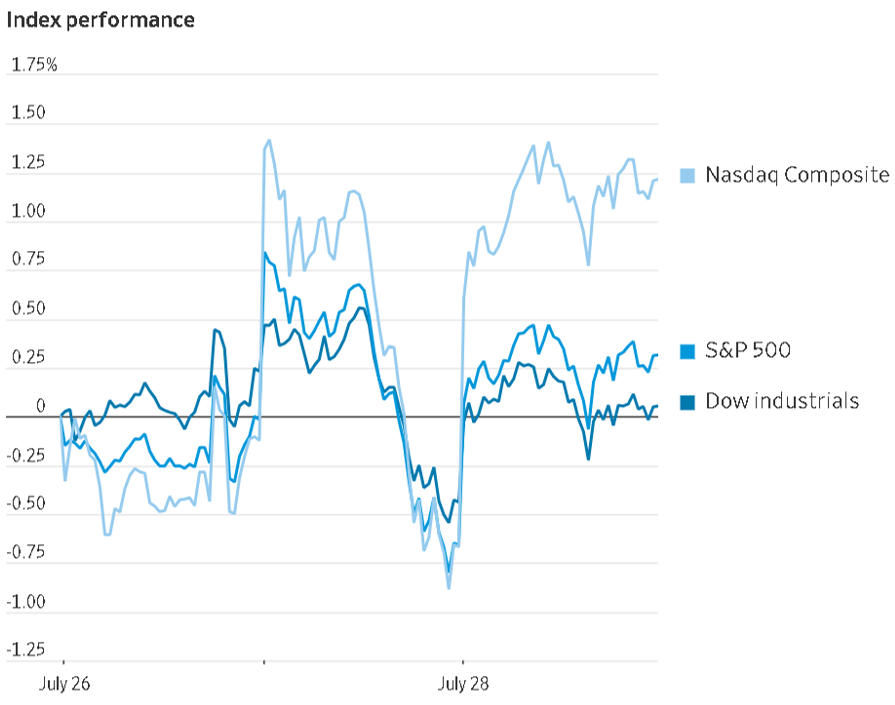
The Week Ahead
Fed speak resumes, a light week for Treasury with multiple Bill sales, and a light economic calendar that includes the jobs report.
Monday – Treasury sells $123 billion 13 & 26 week Bills.
Tuesday – Treasury sells $50 billion 42 day Bills, ISM Manufacturing index.
Wednesday – Treasury refunding announcement.
Thursday – Jobless claims.
Friday – Non Farm payroll expected to be 190,000.
July 24, 2023
ZZZ
A quiet week for markets as they await an expected 25 bps rate increase on Wednesday with the Bank of England and Bank of Japan also scheduled to raise rates this week. Below is a YTD chart for the benchmark ten-year Note and shows that after 75 bps of increases so far this year its yield has only increased by 9 bps. The two exceptions were in March when Silicon Valley Bank made news and earlier this month when the market seemed to capitulate to the Fed’s hawkish policy. That was quickly reversed when the June CPI data was more favorable than expected and the market reduced the expected terminal rate for the Note.
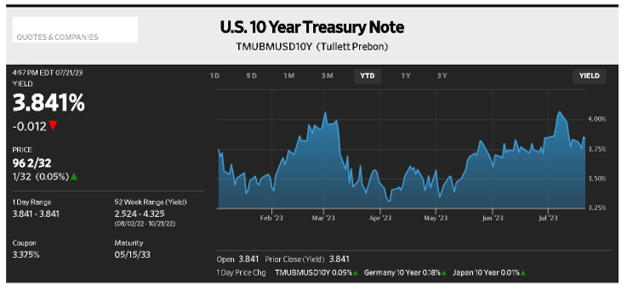
This performance has stabilized pricing for the SBA 504 debentures and helped tighten the credit spread investors have demanded due to the inverted curve. After pricing 2023-25D at +125 bps spread in April the 2023-25G spread was reduced to +112 bps.
Duration
As the market braces for a Fed Funds rate of 5.50% at the upper end of its band it seems odd that CT-10 should yield just 3.84% but it explains the demand for duration in a longer term maturity rather than a Treasury Bill at 5.40% that will mature in three months. That reflects reduced market volatility and sentiment for a shallow, if any, recession that will prompt the Committee to ease rates, making longer-term debt more valuable.
Policy
The desired effect of a tight monetary policy is to slow demand and soften economic growth but after 500 bps of rate increases the unemployment rate is unchanged at 3.6% from pre-pandemic levels, GDP is still positive near 2%, and consumer demand remains strong. Most economic models have been distorted by the government’s financial support that was provided during the pandemic and that has kept consumer spending strong which has helped domestic stock indexes outperform forecasts.
Reports
- Retail Sales at +0.2% were below forecast.
- Industrial Production was -0.5%, weaker than consensus.
- Jobless Claims were weaker than forecast at 228,000.
- Existing Home Sales were down at 4.18 million on an annual basis, a decline of 18.9% y/y. The current 30-year mortgage rate of 6.78% has a lot to do with that but it seems more than that homeowners who hold lower rate mortgages form the Quantitative Easing period are reluctant to sell as they prefer not to sacrifice their historically lower mortgages with rates as low as 2.5%. That lack of housing supply is what is spurring new construction that supports economic activity and job demand.
Upcoming
- Doves may find comfort in Friday’s report on the Fed’s preferred inflation gauge.
- Personal Income is expected to remain at 0.4% while Personal Consumption.
- Expenditures is forecast to decline to 3.1% y/y with the Core index declining to 4.2%.
The Week Ahead
We get the FOMC announcement on Wednesday with Chairman Powell’s press conference to follow, an active week for Treasury and important inflation numbers.
Monday – Treasury sells $123B 13 & 26-week Bills and $42B two-year Notes.
Tuesday – Treasury sells $50B 42-dy Bills and $43B five-year Notes.
Wednesday – FOMC announcement and press conference.
Thursday – Treasury sells $35B seven-year Notes, Durable Goods orders expected to be 0.5%, 2Q2023 GDP estimated to decline from 2% in Q1 to 1.5%.
Friday – Personal Income and PCE forecast to decline.
July 17, 2023
Narrative Shift
Just as the market seemed to accept the FOMC’s resolve to continue raising rates last week’s CPI report came in below forecast at 0.2% and 3% y/y. Treasuries moved lower in rate while reversing some of the recent curve inversion and stocks extended their improbable rally.
This ten-year Treasury chart shows its rate at 4.05% when the SBA 504 program priced its July debentures, close to its level in early March when SVB dominated the news. On Wednesday it moved as low as 3.76% before easing back to close the week at 3.83%.
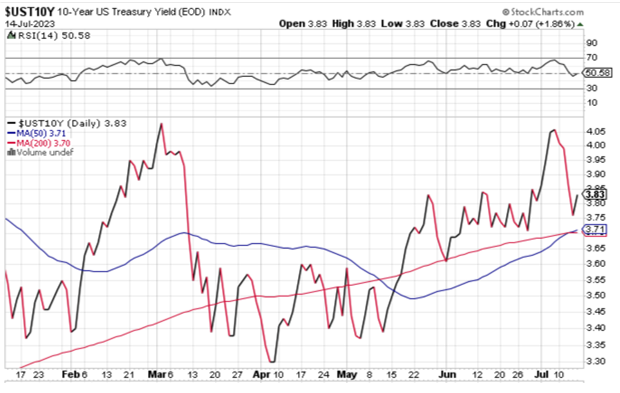
Buoyed by this improved inflation reading bulls are acknowledging another rate hike on July 26 but feel that may be the last before the Fed lets its potential 525 bps of increases to soften a consumer fueled economy without putting it into recession.
Soft Landing
A WSJ survey of economists shows a more optimistic evaluation for the economy with 2Q2023 GDP now forecast at 1.5% vs. 0.2% in the previous survey, softening to 0.6% in Q3 and contracting by 0.1% in Q4.
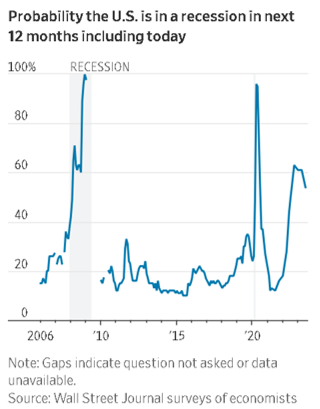
The reason for this optimism is the improved outlook for inflation though the Fed’s preferred gauge, Personal Consumption Expenditures, rests at 4.6% and is expected to only decline to 3.7% in 4Q2023, far above its 2% target. Barring shock news the economists in the survey believe rate cuts will not start until the first half of 2024.
Healthy Banks
Concern over banks’ ability to withstand deposit withdrawals resulting from the SVB fallout faded as JP Morgan, Wells Fargo, and Citi reported $49 billion in net interest income. With many urban office buildings still under occupied as companies attempt to correct the work from home environment JPMorgan acknowledged the commercial real estate risk by setting aside a net $1.5 billion in reserves to cover potential loan losses.
The Week Ahead
No Fed speak in the blackout period ahead of the July 26 FOMC meeting, few economic reports, and a light Treasury calendar.
Monday – Treasury sells $123 billion 13 & 26-week Bills, China reports on second quarter growth.
Tuesday – Treasury sells $42 billion 42-day Bills, Industrial Production expected to be flat, Retail sales forecast at 0.5%.
Thursday – Existing Home Sales forecast at 4.2 million, Leading Indicators expected to show a decline for the 15th straight month.
July 10, 2023
Rates Are Rising
The July 504 debenture sale was announced in a holiday-shortened week with a compressed offering period. The debenture offerings were again smaller than recent offerings and were almost the exact same size as the June offering ($361 million). Initial price talk for the issues was 5-year Treasury +80 for the 10-year debenture, 10-year Treasury +110 for the 20-year debenture and 10-year Treasury +112 for the 25-year debenture. These levels were 6 bps tighter than the levels for the 20- and 25-year June debenture offering, and 10 bps tighter than the May 10-year offering. The debentures were priced on Thursday at the initial price talk levels. The coupon on the 10-year (5.22%) was 4-6 bps higher than the 20- and 25-year coupons, reflecting the further inversion of the 5/10 year yield curve from +3 in May to -33 in July. Demand for the debentures was moderate, not surprising for a holiday week. Bank participation remains weak as banks have been losing deposits following the Silicon Valley Bank collapse. Loan approvals are running far behind 2022 levels ($6.5 billion through May 2022 YTD versus $4.2 billion YTD through May 2023), suggesting that we may continue to see smaller monthly debenture offerings.
Market conditions for the sale were favorable, with credit spreads in general improving since the June sale. The 10-year Treasury yield was range bound over that period, trading between 3.75% and 3.85%. The stable rate environment changed prior to month end, with hawkish comments by Chairman Powell causing an uptick in rates. A blowout ADP private payroll report on June 6 (double the expected number) triggered a further uptick in rates, just prior to the pricing of the July debenture offering. Rates on the 10-year Treasury jumped by 20 bps in the week leading up to pricing. For the July 26 Fed meeting, futures are projecting a 95% probability of a 25 bps rate hike and a 50% bps probability of another 25 bps hike rate hike by year end. Employment remains strong and inflation is not receding as quickly as Chairman Powell would like, so further rate hikes are likely.
Investor Distribution
2023-10D
| Credit Unions and Insurance Cos | 100% |
2023-20G
| Money Managers | 20% |
| Banks | 21% |
| Insurance Companies | 59% |
2023-20G
| Money Managers | 57% |
| Banks | 2% |
| Insurance Companies | 41% |
The Week Ahead
Fed speak on Monday, Wednesday, and Thursday.
Wednesday – Core CPI forecast is +.3% month over month
Thursday – Core PPI forecast is +.2% month over month
Friday – University of Michigan July consumer sentiment index forecast 65.5
July 3, 2023
Range Bound
At least that describes the ten-year benchmark that has risen just 10 bps since the 504 program priced its June debentures. Processing confirmation from Chairman Powell that the Committee’s “policy has not been restrictive for very long, so we believe that more restriction is coming,” the two-year Note has risen 26 bps in that time to continue its curve inversion. That 2/10 relationship now stands at -106 bps as the market awaits a probable 25 bps increase on July 26.
This inversion has resulted in wider credit spreads for the DCPC product, but spreads have stabilized as the program prepares for an accelerated schedule to announce and sell its July debentures in one day because of the holiday shortened week. This has been done before and the Underwriters are confident it will be done this week too.
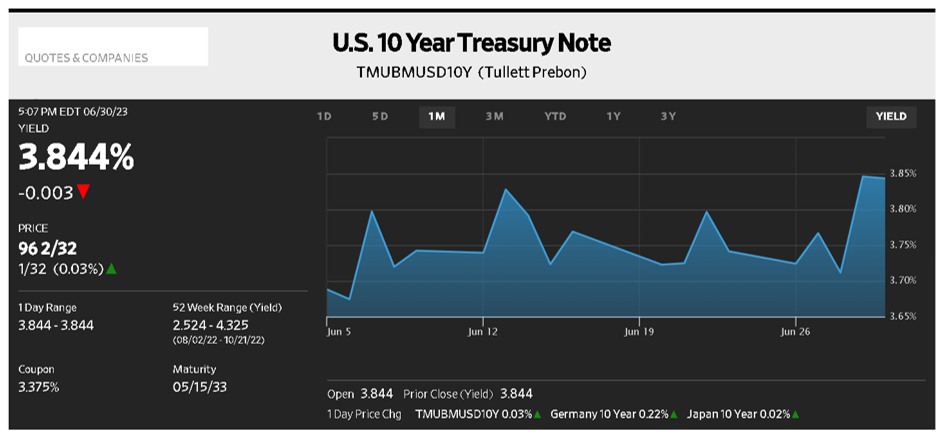
While fixed rate products brace for more rate hikes stocks are unfazed by the prospect as a brighter economic outlook has propelled the three indexes higher this year, Nasdaq much more so than the others.
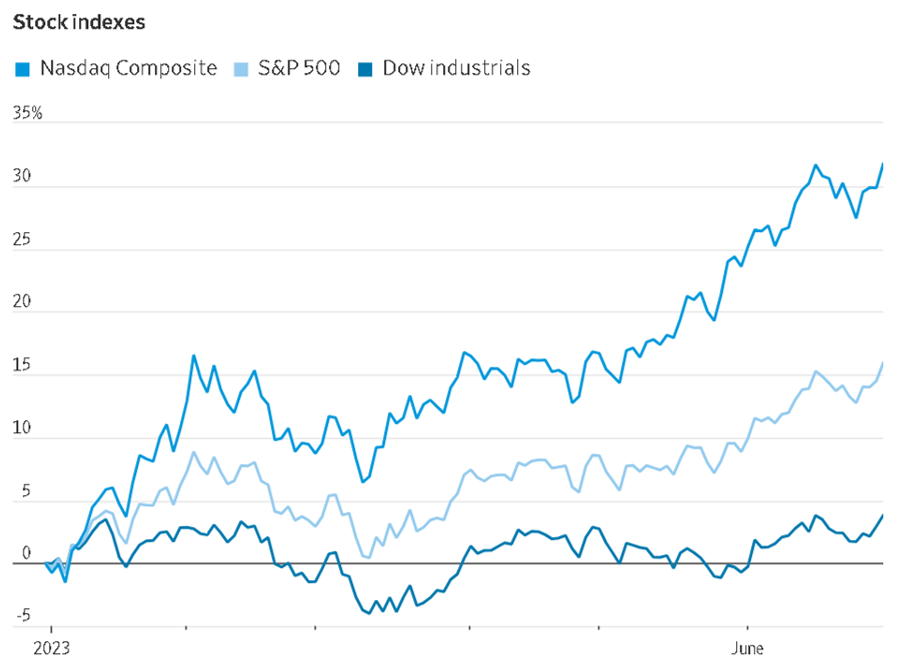
Mark to Market
Trading in the secondary market has been orderly since the June debenture sale as the market has absorbed the portfolio liquidation managed by FDIC and increased Treasury issuance that resulted from the debt ceiling agreement.
While the back end of the Treasury curve outperforms it does not mean investment in longer dated Treasuries and credit products has been that safe. Silicon Valley Bank and First Republic did not have sufficient cash to withstand the rise in rates and while larger banks do have stronger balance sheets, they have sustained significant paper losses on those securities. It is probable those losses will not be realized as the banks have sufficient liquidity though their interest spread and profitability have been reduced.
Regarding value, JPMorgan announced they were reducing their investment in Treasuries as the bank believes “their valuations seem rich and have outperformed.”
Less Stress
In a test conducted by the Federal Reserve Bank, 23 banks that hold 20% of the commercial and office loans held by banks would sustain $541 billion in losses but still meet minimum capital requirements and continue to lend in a severe recession. The terms of the test included a global recession with a 40% decline in commercial real estate prices, a substantial increase in office vacancies, and a 38% drop in house prices. Under these conditions unemployment could rise as high as 10% with reduced economic output; pretty grim stuff.
Reports
Helping to support the stock surge was a larger revision to 1QGDP of 2% and soft numbers for Personal Income of 0.4% and the y/y PCE report of 3.8%.
The Week Ahead
SBA 504 program prices its July debentures, a light week for Treasury and the major release is Friday’s jobs report.
Monday – Treasury sells $123 billion 13 & 2-week Bills
Wednesday – 504 program announces its 10, 20, & 25-year debenture sales
Thursday – 504 program prices its July debentures
Friday – Non-Farm Payroll expected to be 240,000
June 26, 2023
A Quiet Week
At least it was quiet in financial markets while political tension within Russia was reported Friday as the country’s mercenary force turned on its military leaders. Its effect on national security, the invasion of Ukraine, and the markets is to be determined.
Markets
Equities ended their eight week winning streak and Treasuries saw the ten-year rate decline slightly to 3.74% while the 2/10 curve inverted further to -101.2 bps as it awaits more Fed action. Congressional testimony by Chairman Powell affirmed the Committee’s intent to space out its rate increases, two more of which are expected before year-end. If so, that would put the upper end of the Federal Funds range at 5.75%, its highest level in 22 years.
Uneven Slowdown
Consumer spending continues to drive the US economy, keeping it out of recession, but business activity slowed this month, as seen globally in this chart for a purchasing managers index. The declining cost of goods is providing support to central bankers that their tight monetary policies are working and will remain in place.
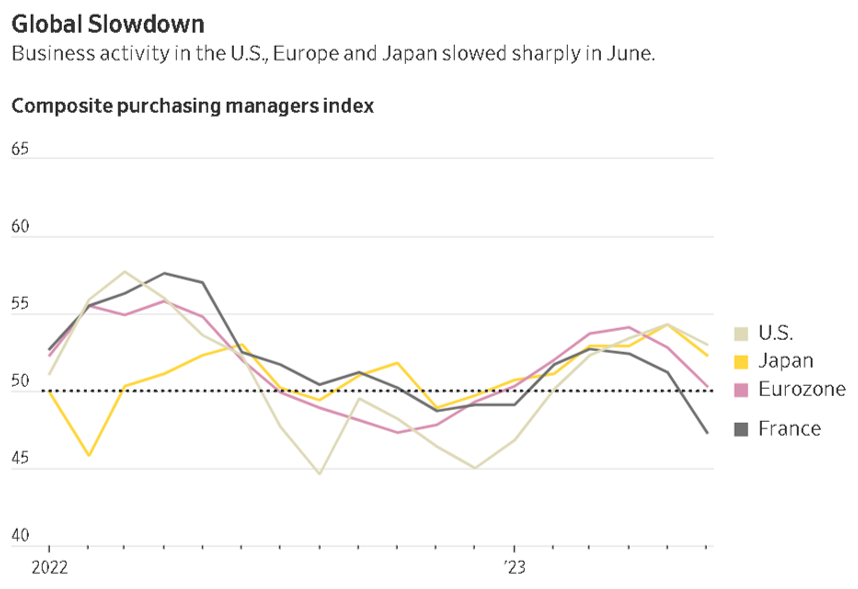
While the US central bank paused its series of rate increases the Bank of England raised its benchmark rate to 5% with analysts predicting it could rise as high as 6.25% which would be its highest level since 1998. Concerned that higher rates could devalue house prices by as much as 10%, UK banks have agreed to defer repossessions for up to 12 months before any could take place.
Commercial Real Estate
Expanding on last week’s comment about developers walking away from prime sites in San Francisco rising rates, a regional banking crisis that is curtailing credit, and a shift away from office work are disrupting the commercial real estate market. This Financial Times chart illustrates the 1Q2023 pace of foreclosures as one broker estimates office buildings in New York have lost $76 billion in value since their most recent sale prices.
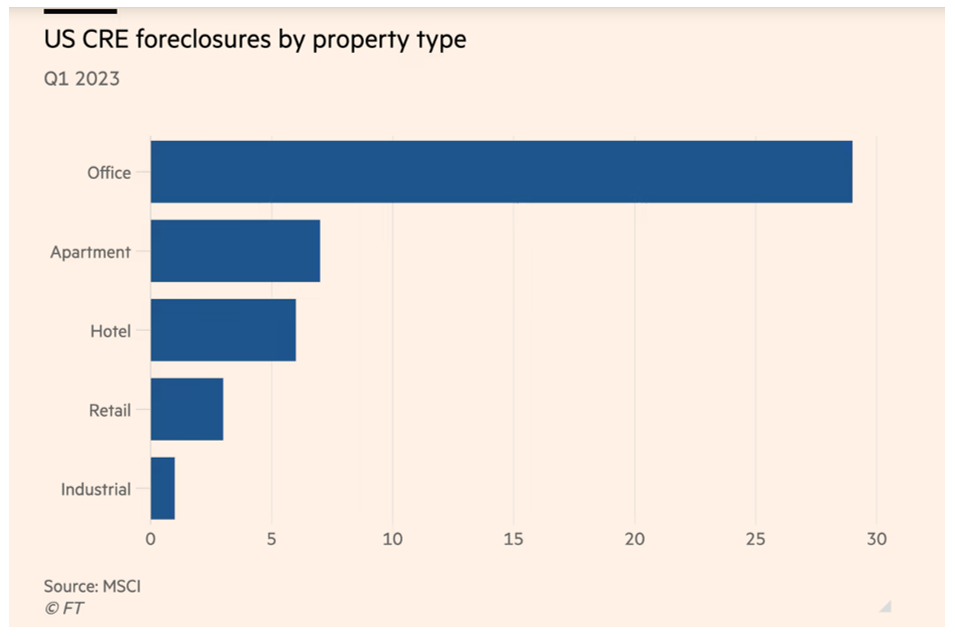
Reports
The holiday shortened week focused on housing reports and indicated the current 6.92% rate for 30-year mortgages is having little effect.
- Housing Starts and Permits increased to 1.631 million, exceeding forecasts.
- Existing home sales were also above estimate at 4.3 million.
The Week Ahead
Fed speak (Chairman Powell on Wednesday), 1Q2023 GDP estimate, an active Treasury calendar, and the Fed’s preferred inflation gauge.
Monday – Treasury sells $123 billion 13 & 26 week Bills, $42 billion two-year Notes.
Tuesday – Durable Goods orders forecast at -0.7%, Treasury sells $43 billion five-year Notes.
Wednesday – Treasury sells $35 billion seven year Notes and $22 billion twenty two month FRN’s.
Thursday – Third estimate of 1Q2023 GDP 1.6%.
Friday – Personal Income expected to be unchanged at 0.4% while PCE forecast at 3.7% y/y with Core PCE unchanged at 4.7%.
June 20, 2023
Fed Pauses, Remains Hawkish
Taking a break from ten consecutive rate hikes, the FOMC on Wednesday opted to pause while affirming its commitment to reducing inflation. Accidentally referring to the pause as a “skip” Fed watchers are certain Chairman Powell supports a July 26 increase as he did admit he prefers spacing them out. Ahead of the decision the CPI report for May was encouraging but left inflation at double the target even though at 4%, it is more than half of its year ago rate.
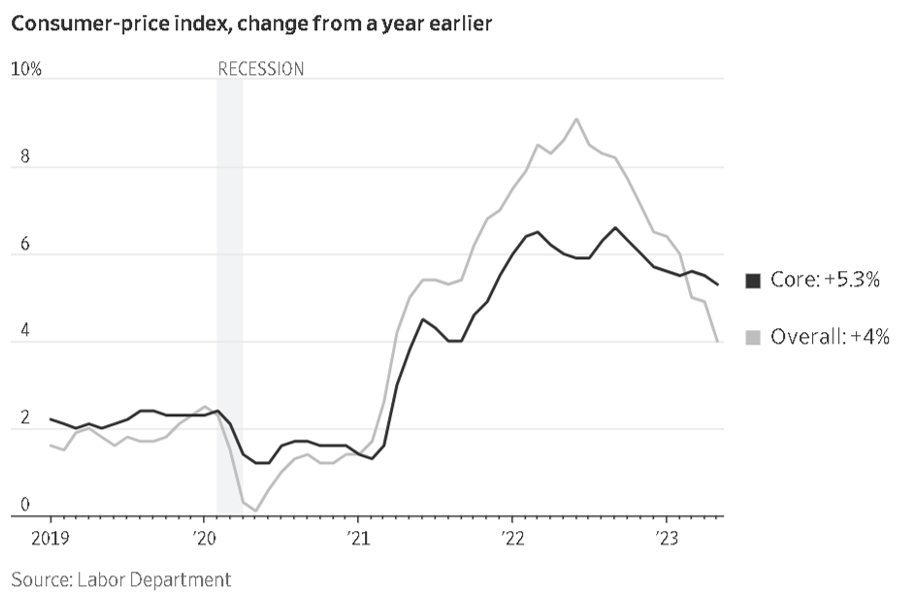
Another inflation report the next day showed PPI declined 0.3% and is +1.1% y/y. This helped the rates market stabilize as the benchmark ten-year Treasury closed the week at 3.77%, just 2 bps above where the 504 program its debentures on June 8th. What changed after the FOMC announcement was the slope of the curve as the 2/10 relationship widened to -95 bps, a change of 12 bps on the week as the front-end of the Treasury curve prepares for continued tightening and will then deal with how long it must wait for a reversal of policy.
Moves
The pause by the Fed will not make things more expensive but it will not make things more affordable either. With focus last week on the Fed there were other events linked to rates:
- Developers in San Francisco handed over the keys to two prime commercial properties that carried loans totaling $1.283 billion as reduced tourism, tech company downsizing, an exodus of residents and social ills have compromised the city.
- The ECB raised its key deposit rate to 3.5%, its highest level in twenty-years, and indicated there was more to come.
- China lowered its medium term lending rate for the second time in two weeks as it hopes to stimulate a slumping economy and its high rate of youth unemployment. Still looking to recover from its zero-Covid policy China’s GDP forecasts for 2023 and 2024 have been revised down to 5.1% and 3.9%, respectively.
- Tight money hasn’t affected consumer spending as Retail Sales grew at 0.3% in May after an even stronger 0.4% gain in April.
- You might think higher rate forecasts would weaken stocks, but the S&P 500 index gained for the fifth consecutive month as it closed the week higher by 2.6% with the Nasdaq better by 3.2%.
- The average thirty-year mortgage rate is 6.71% as Existing Home Sales are down 23% y/y.
Balance
The Fed’s dilemma is fear that their rapid rate increases over the last sixteen-months, combined with recent banking strains could stifle economic growth and the labor market more than they expect while they realize inflation has not cooled as fast as it would like. Pausing this month slows their pace as the next increase would raise rates to a twenty-two year high.
The Week Ahead
Fed speak resumes, a light week for reports and Treasury issuance.
Tuesday – Treasury sells $123 billion 13 & 26-week Bills.
Wednesday – Treasury to sell 17-week Bills.
Thursday – Treasury to sell 4 & 8-week Bills, Existing Home Sales forecast at 4.2M.
Friday – PMI Composite Flash expected to be flat, Leading Indicators expected to show a 14th straight decline.
June 12, 2023
Current Debenture Pricing
The June 504 debenture sale was announced two days after President Biden signed the debt ceiling bill, which removed a major source of uncertainty in the market. The June 504 debenture offerings were smaller than recent offerings, with both the 20-year ($28.602 million) and 25-year ($333.572 million) issues being the smallest since October 2020. Initial price talk for the issues was 10-year Treasury +118 for the 20-year debenture and 10-year Treasury +120 for the 25-year debenture. These levels were 5 bps tighter than the levels for the May offering. After the announcement the sales gained momentum, and the underwriters were able to price the issues 2 bps tighter, +116 for the 20-year and +118 for the 25-year. The small size of the 20-year did not seem to impact investor demand. However, there is concern that continued small size for the 20-year could limit participation by some larger investors.
Market conditions for the sale were favorable. Market activity in the week leading up to the sale was quiet, both due to the Memorial Day holiday and investors waiting to see the resolution of the debt ceiling negotiations. The 10-year Treasury note was trading at 3.745% at the time of pricing, 38 bps higher than at pricing for the May debenture sale. Futures are now forecasting a 70% probability of the Fed holding rates at the 5%-5.25% target level at the June meeting. For the July meeting, futures are projecting a 30% probability of a 25 bps rate cut and a 15% probability of a 25 bps rate hike. Employment remains strong, with the May jobs report showing unemployment holding at 3.6% and a better-than-expected increase of 390,000 jobs. The employment situation, coupled with stubborn inflation numbers, suggests that further rate hikes may not be off the table.
Investor Distribution
2023-20F
| Money Managers | 28% |
| Banks | 21% |
| Insurance Companies | 51% |
Participation in the 20-year debenture sale involved 6 accounts with 3 accounts in common.
2023-25F
| Money Managers | 44% |
| Banks | 7% |
| Insurance Companies | 46% |
| Pension Funds | 2% |
| Hedge Funds | 1% |
Participation in the 25-year debenture sale involved 18 accounts with 11 accounts in common.
The Week Ahead
FOMC meets this week, announcing their monetary policy decision on Wednesday. The European Central Bank will announce their monetary policy decision on Thursday.
Tuesday – Core CPI forecast is for -.3% month over month, +5.2% annualized
Wednesday – Core PPI forecast to rise 2.9% year-over-year, .3% less than in April
Friday – University of Michigan consumer sentiment index for June released
June 5, 2023
Debt Ceiling Relief & Resilient Jobs Market
It was a good week for equities and bonds though the latter gave ground on Friday after a stronger than expected jobs report showing employment increased by 339,000. Before that the bi-partisan agreement to extend the debt ceiling by two years relieved the tension of a possible default, helping to calm the markets as the DJIA gained 700 points and the tech heavy Nasdaq registered its sixth consecutive weekly gain.
Revisions to previous jobs reports added almost 100,000 jobs, bringing the ytd total to 1.3 million as the Unemployment rate increased to 3.7%. Perhaps that rise will encourage the Fed to pause a rate increase on June 14 as expressed by its 75% probability in the futures market. Additional projections do show a rate hike in July and cuts in the fourth quarter.
Perversely, one positive aspect of the jobs report for the Fed was a slight decrease in wages to 0.3% and 4.3% from the year earlier as that category has a direct impact on inflation. Though higher than the desired 3.5% annual rate that would equate to a 2% inflation target, any decrease is supportive of this Quantitative Tightening policy.
As seen below monthly increases dating back to January 2021 have consistently outpaced pre-pandemic levels.
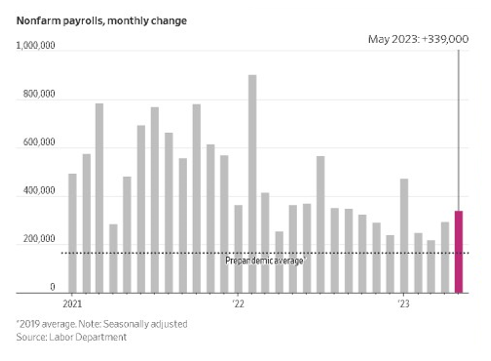
Rates
This WSJ chart of the ten-year Treasury captures the one-month change in rate from when the 504 program benefitted from a dip to 3.37% to price its May debentures. Stronger economic and inflation reports have pushed rates up as the benchmark closed Friday higher by 33 bps since May 11 and the 2/10 Treasury curve inverted to -80 bps, its sharpest level in two-months as the market prepares for another rate increase this summer.
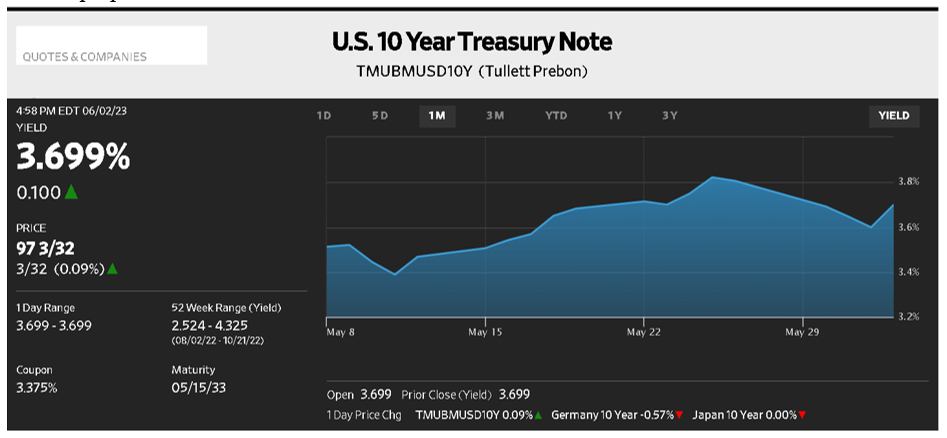
Market conditions have quieted with the debt ceiling resolution and the FDIC sale of securities has been orderly, but the market does expect to see higher rates and investors are cautious.
As mentioned last week, Treasury will need to increase the sales of T-Bills, like adding a one-day Bill last week and a forty-four day Bill this week.
Reports
Other than Non-Farm Payroll, last week’s reports were minor, showing Consumer Confidence stronger than expected and the Case-Schiller Home Price Index gaining 0.5% vs. a -0.1% forecast.
Banks, even the national ones, continue to see deposit withdrawals as they can’t compete with corporate accounts offering higher rates and short-term Treasury Bills yielding 5.35%.
The Week Ahead
The SBA 504 program sells its June debentures, a light week for Treasury, reports, and Fed speak.
Monday – Treasury sells $123 billion 13 & 26-week Bills and $50 billion of a 44-day Bill, plus three smaller, short-term Bills
Tuesday – SBA 504 program announces its June debenture sale
Wednesday – US Trade in International Goods & Services
Thursday – SBA 504 program prices its June debentures
May 30, 2023
Agreement
President Biden and House Speaker McCarthy announced an agreement in principle to extend the debt ceiling for two-years. The market hopes a bill will be signed later this week as the X-Date has been extended to June 5. A House vote is expected Wednesday as both party leaders attempt to convince dissidents of the agreements’ merits as there seems to be little consensus that either party is pleased with the settlement.
Stocks Recover, Bonds Slip
Friday’s economic reports and growing optimism on a debt ceiling resolution helped stocks recover from what had been a lackluster week and sent Treasury yields higher.
Closing the week at 3.806% the benchmark ten-year Note is 43 bps higher than when the 504 priced its May debentures.
Higher Ceiling, More Debt
Market disorder provides trade opportunities and as evidenced by a 21-week T Bill being auctioned at 6.21% last week the market was concerned about a possible default. But why should short-term rates decline when after resolving the debt ceiling issue Treasury will be faced with the need to raise $1.25 trillion of fresh issuance in Bills over the next seven months. That supply can be met by demand from the very popular Money Market Funds that already own a record $5.84 trillion in deposits, though probably at higher rates and at what risk to the Fed’s Quantitative Tightening program? It has been speculated that tighter credit standards resulting from recent bank failures could do that job for the Fed, now Treasury could be adding to the effort.
As of May 24, the Treasury General Account that pays Social Security, military salaries and interest expense sat at $37 billion, down from $700 billion at the end of 2022.
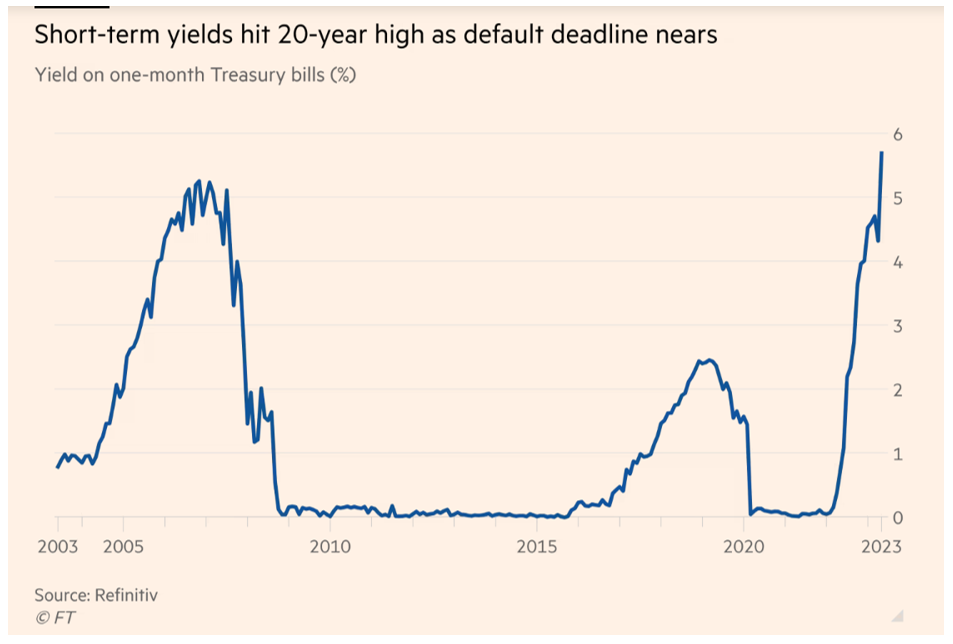
The recent change in sentiment is borne out by the futures market pricing in a 56% chance of a rate hike in June as consumer spending jumped and inflation remained stubbornly high.
- Personal Income was as expected, at 0.4%.
- Personal Consumption Expenditures (consumer spending) was 0.8%, double the forecast.
- PCE price indexes were 4.4% and 4.7% ex food & energy, both above forecast.
- 1QGDP at 1.3% was slightly above forecast.
- Durable Goods orders were 1.1% vs. a -1.1% forecast, following a 3.2% gain in March.
Whether the Fed raises rates an eleventh time in June or July may depend on how Congress resolves the debt ceiling question, but more Committee members continue to express their concern that more work is needed.
Regarding inflation, this WSJ chart shows the oppressive cost of housing as it far exceeds the declining core cost of goods and services.
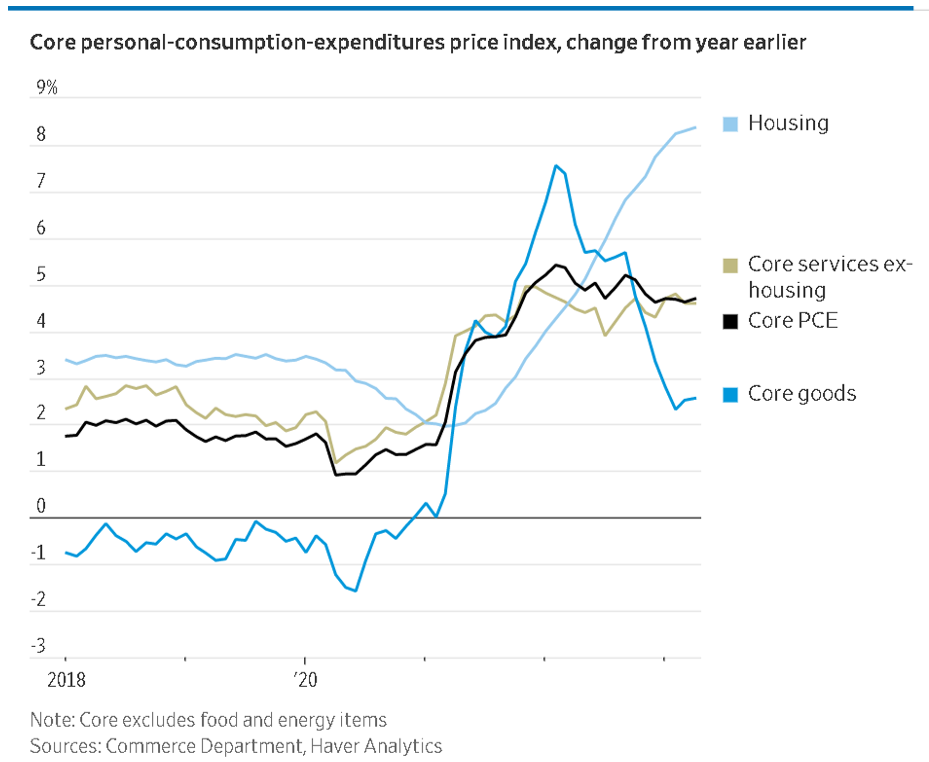
While the US deals with debt ceiling and supply issues European stocks sold off sharply last Wednesday when UK inflation showed a smaller drop than expected at 8.7%. Analysts expect a BoE rate hike next month with their rates peaking at 5.3% by the end of the year. Sound familiar?
The Week Ahead
Fed speak starts to taper off ahead of the June FOMC meeting, light Treasury issuance and reports.
Tuesday – Treasury sells $119 billion 13 & 26-week Bills, Case Shiller Home Index
Wednesday – Treasury sells approximately $42 billion 17-week T-Bills
Thursday – Jobless Claims, Treasury sells about $70 billion 4- & 8-week Bills, ISM Manufacturing Index expected to be flat (has been in decline the last 6-months)
Friday – Non-Farm Payroll forecast at 180,000 with the Unemployment Rate rising to 3.5%
May 22, 2023
A Closer Call and Countdown to June 1
This ten-year Note chart shows its volatility from pre Silicon Valley Bank failure of 4.07% to its risk-off sentiment of 3.30%, as other regional banks suffered deposit withdrawals to its Friday close at 3.70%. The market seems less certain that the Fed will pause its QT at its June 14 meeting. At 3.70% the benchmark Note is 33 bps higher than when the 504 program priced its May debentures just eleven days ago.
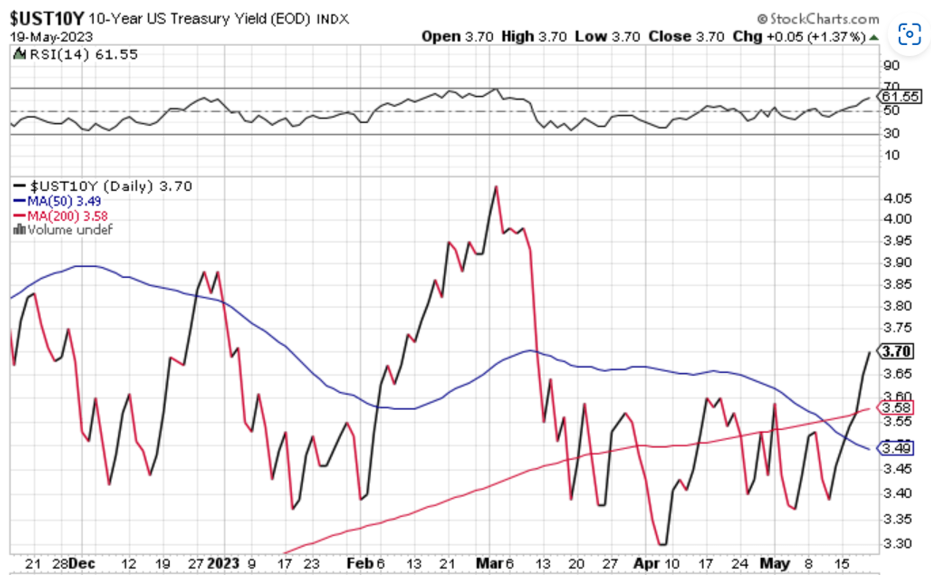
While several FOMC members have indicated they are uncertain that inflation and economic activity have slowed enough to leave rates at their current cap of 5.25% Chairman Powell has been outspoken about how tight credit may limit further tightening as rates may be “sufficiently restrictive.”
Topics of Interest
Adding to the debate of yes or no on another rate hike are:
- Debt ceiling relief. As of Saturday, negotiators lack consensus as Treasury Secretary Yellen holds firm with a June 1 deadline for a possible default if a compromise is not reached.
- Low Unemployment. At 3.4% the unemployment rate is below its level from before the Fed raised rates by 500 bps.
- Solid consumer spending. Reversing two months of declines, shoppers boosted retail sales in April by 0.4% and are 1.6% higher than a year earlier.
- Sticky inflation. The April reading for CPI was 4.9% with the indexes for shelter and energy the biggest contributors. While the Fed’s preferred inflation gauge, PCE is lower at 4.2%, it too has not declined as much as desired with its April reading to be released on Friday and predicted to rise to 4.3%. That report may be a significant factor in the June decision as it could tip the balance between the possible pause that Chairman Powell indicated after the last meeting and the desire to not halt tightening prematurely. Stopping and starting its QT policy is what the Committee wants to avoid.
Other Reports
- Industrial Production came in above forecast at 0.5% after moving sideways in the previous two months. Capacity Utilization was 79.7%, equal to its long run average.
- Existing home sales declined as prices dropped the most in eleven years. The median home price is $388,800, down 6% from a year earlier as the average 30-year mortgage rate is 6.35%.
- Germany’s Dax stock index is at a record high, up 17.2% this year vs. a 10% gain for the S&P 500 which is driven by just a handful of technology stocks.
The Week Ahead
More Fed speak, FOMC minutes, GDP, and the Fed’s preferred inflation gauge, with active Treasury issuance.
Monday – Treasury sells $111 billion 13 & 26-week Bills.
Tuesday – Treasury sells $42 billion two-year Notes, New residential home sales, PMI for Services expected to decline after a sharp rise in April.
Wednesday – Treasury sells $43 billion five-year Notes, Minutes of the May 3 FOMC meeting are released.
Thursday – 2Q GDP forecast at 1.1%, Treasury sells $35 billion seven-year Notes, Jobless claims.
Friday – Personal Income forecast at 0.4%, PCE expected to increase to 4.3% with the core reading holding at 4.6%, Durable Goods forecast at -1.1% after rising 3.2% in March.
May 15, 2023
Current Debenture Pricing
The May 504 debenture offerings were well received by investors despite a somewhat weak market environment. Initial price talk for both issues was 10-year Treasury +125 bps. The 20-year had the stronger order book, and the underwriters were able to tighten the spread to +123, while the 25-year remained unchanged. The small 10-year issue was priced at 5-year Treasury +90 bps, 15 bps behind the initial price talk of +75 bps. While the spread was wider than the initial talk, the deal was priced versus a 5-year Treasury note that was 95 bps lower than the last issue in March. Distribution of the debentures was well balanced, with money managers, insurance companies and pension funds participating. Several banks also participated, which is encouraging.
Market conditions for the sale were favorable. Both inflation releases (CPI and PPI) during the week were benign to slightly positive, with the numbers showing a slight improvement in inflation. The solvency of regional banks, particularly PacWest Bank, remained a concern for investors and may be contributing to wider credit spreads. The market continues to price in 50-75 bps of Fed easing, by year end despite Fed Chairman Powell’s comments indicating the Fed is on hold and any further Fed moves will be data driven. It should be noted that the Fed rarely cuts rates when unemployment is below 4% -- it is currently 3.4%. The 10-year Treasury note was trading at 3.37% at the time of pricing, 9 bps higher than at pricing for the April debenture sale. Spreads for the 20- and 25-year debentures were 3-5 bps wider than for the April sale.
Investor Distribution
2023-10C
| Money Managers | 93% |
| Banks | 7% |
| Insurance Companies | 0% |
| Pension Funds | 0% |
Participation in the 10-year debenture sale involved 3 accounts with 1 account in common.
2023-20E
| Money Managers | 29% |
| Banks | 27% |
| Insurance Companies | 40% |
| Pension Funds | 4% |
Participation in the 20-year debenture sale involved 10 accounts with 5 accounts in common.
2023-25E
| Money Managers | 36% |
| Banks | 13% |
| Insurance Companies | 49% |
| Pension Funds | 2% |
Participation in the 25-year debenture sale involved 16 accounts with 12 accounts in common
The Week Ahead
Fed Chairman Powell will be speaking at a conference with Ben Bernanke on Friday.
Tuesday – Retail Sales, Industrial Production
Wednesday – Housing Starts
Thursday – Philadelphia Fed manufacturing survey
May 8, 2023
Hiring Remains Robust
Stocks recovered on Friday as Non-Farm Payrolls came in above forecast, even with a downward revision to the April report as this WSJ chart shows how a 500 bps increase in the cost of money is not slowing down job gains as the unemployment rate is actually lower at 3.4% than it was before the Fed began Quantitative Tightening.
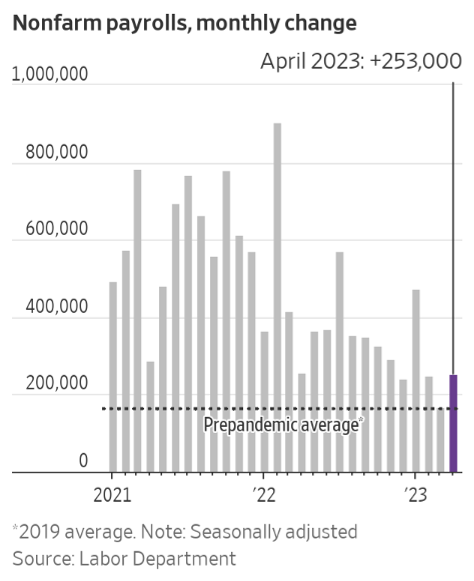
Wage gains continue at a strong pace, 4.4%, above forecast and far above the Fed’s desire for 3% which they believe will help achieve their 2% goal for inflation.
Market reaction saw stocks gain but still ended the week lower while the Treasury market saw rates decline with the Treasury curve steeping in the 5-10 year maturities. At 3.45% the benchmark ten-year Treasury is 18 bps higher than in April and credit spreads have widened slightly in a risk-off environment.
All of this is at odds with Fed policy that seeks unemployment a full point higher and with Wednesday’s rate increase indicated they might pause to allow this tightening phase time to work. Of course, that possible pause lends support to expectations for rate cuts later this year.
Expensive Refinance
As reported in the WSJ, “lenders in the U.S. commercial mortgage-backed securities (CMBS) market and banks usually require borrowers to hedge their interest-rate risk when they take out a variable-rate loan. If a landlord buys an interest-rate cap with a 3% strike rate, they receive a payment whenever benchmark rates—often the secured overnight financing rate, or SOFR—rise above that level. This reassures lenders that the borrower will be able to meet its debt payments even if interest rates rise.”
The term for these caps is usually three years meaning many loans taken out during the pandemic may have expiring caps soon. In April 2019 the cost for a three-year cap at 3% for a $100MM loan was $98,000, today that same cap costs $2.48 million. That leaves borrowers the options of injecting more equity, selling in a soft market, refinancing a fixed-rate loan with tighter credit standards, or default if the loan is already underwater. Refinancing would be helped if the futures market is correct in calculating the Fed’s target rate will hit 5.07% by July before dropping to 4.39% by the end of the year.
The Week Ahead
SBA 504 program announces and prices it May debenture sale, Fed speak resumes, more inflation data, and Treasury conducts its quarterly refunding.
Monday – Treasury sells $105 billion 3 & 26 week Bills
Tuesday – SBA 504 announces its May sale, Treasury sells $40 billion three-year Notes
Wednesday – CPI forecast at 0.4%, Treasury sells $35 billion ten-year Notes
Thursday – SBA 504 prices its debentures, PPI forecast at 0.3%, Treasury sells $21 billion thirty-year Bonds
Friday – University of Michigan releases its Consumer Survey
May 1, 2023
Fed Considers Rate Decision
With a disappointing PCE report last Friday it is likely the Fed will raise rates another 25 bps on Wednesday, making it 100 bps in increases this year. During that time, the benchmark ten-year rate has resisted a move higher, instead declining 33 bps. Fulfilling its mission to support a stable economy while controlling inflation, the bank is now faced with managing a banking crisis that is about to see a third bank seized by the FDIC.
A recent WSJ article captured the mood of investors who are hoping the Fed “hikes in May and goes away” as the 2/10 Treasury curve remains inverted at -52 bps and longer dated maturities are much below the current 5% top of the Fed Funds range.
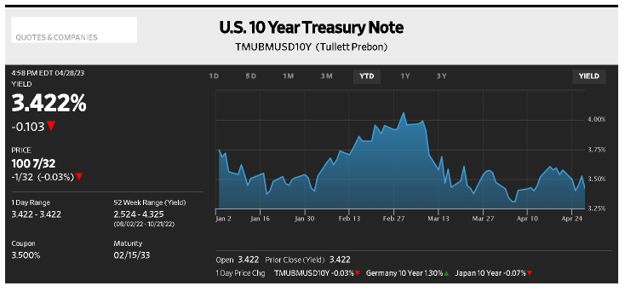
Investing in longer dated Treasuries and mortgage-backed securities contributed to the demise of Silicon Valley Bank and Signature Bank, leading to an outflow of deposits for them and similarly sized regional banks. Much of that money went to larger national banks but individuals found a better investment using Treasury Direct where government guaranteed securities can be bought electronically: https://www.treasurydirect.gov/
On this site individuals can buy a variety of securities ranging from Savings Bonds to something as short-term as three-month Treasury Bills currently yielding 5.03%. Demand for this maturity rose to $48.4 billion for the month of March, almost quadruple the amount of a year ago.
Reports
As seen in this St. Louis Fed chart the Fed’s preferred inflation gauge has declined though the Core reading for March increased slightly to 4.6%, still far above its 2% target.
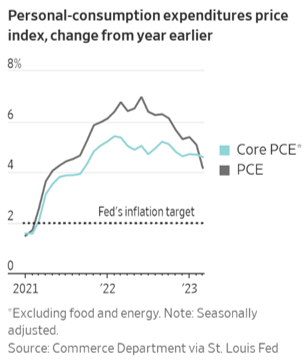
Reports last week continued their irregular pattern of slowing economic growth offset by higher labor costs and persistent inflation.
- The Employment cost Index rose 4.8% last quarter.
- Personal Income rose 0.3%, more than forecast.
- 1Q2023 GDP was 1.1%, weaker than its expected rate of 2% and shows the Fed’s efforts are yielding results in slowing the economy.
- US household spending, a major part of the economy, was flat in March.
- Europe’s commercial property market slumped to its lowest level in eleven years.
- The Federal Reserve admitted that the collapse of SVB was pretty much the result of its own “weaknesses in regulation and supervision.”
The Week Ahead
The FOMC meets Tuesday and Wednesday, as do several central banks, Treasury sells short-term Bills, and several business/trade reports including Friday’s jobs report.
Monday – Treasury sells $105 billion 13 & 26 week Bills
Tuesday – FOMC meeting opens
Wednesday – Fed decision at 2:00 with Jay Powell press conference to follow
Thursday – Jobless claims
Friday – Non-Farm Payroll expected to decline to 180,000
April 24, 2023
Flat
This WSJ chart for the 10-year Treasury shows little change for the month, except for April 6 when the 504 program priced its April debentures off a rate of 3.28%. Rates have risen with little change in the 2/10 Treasury curve and credit spreads. That date also marked an approximately one month anniversary for the Silicon Valley Bank collapse and subsequent deposit drain on banks that seems to be calming down.
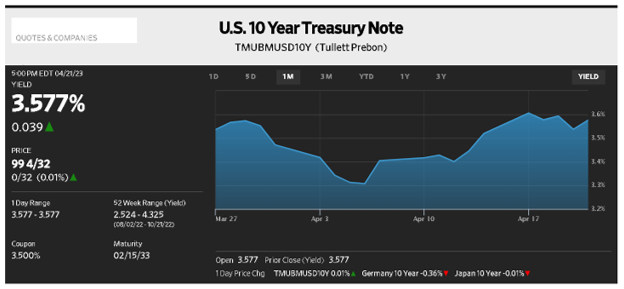
That drain has abated with the help of the Federal Home Loan Bank of Chicago that has advanced $495 billion of funds to its member banks like Charles Schwab that borrowed $46 billion in the first quarter. This chart shows how involved the bank was during the financial collapse in 2008 and though its cost of funds is much higher than what member banks pay on deposits it does provide needed capital at a manageable rate. Getting that money may be the easy part, identifying a path to profit growth may be harder amidst higher funding costs, cracks in the commercial real estate market and increased oversight
Market Activity
The question of what FDIC was going to do with $100 billion of SVB and Signature Bank holdings was answered with the first two sales of pass through and CMO debt. Weekly sales totaling $2.5 billion are expected and demand for the first sales good though bank demand is reduced and not expected to recover anytime soon.
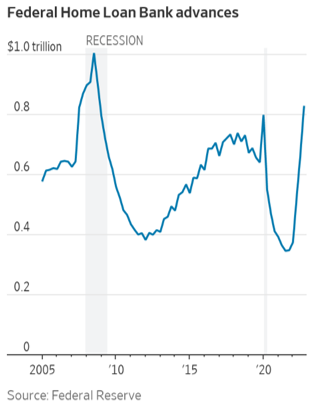
Economy
It was a light week for reports; highlights are:
- Reflecting an average 30-year mortgage rate of 6.66%, home prices posted the biggest annual drop in eleven years, down 22%. Median prices dropped 9.2% from their June 2022 peak of $413,200.
- The X date for the debt ceiling has advanced to as early as mid-June as Treasury receipts in April have been lower than expected. Demand for the shortest safe-haven assets has driven the rate on one-month Treasury Bills to 3.31% from 4.68% at the end of March. That rate is 180 bps lower than the yield on the three-month T-Bill, currently 5.11% but that maturity is longer than the expected debt ceiling deadline.
- The Fed is reviewing 2019 rules that loosened restrictions for mid-sized banks with assets in the $30-$100 billion range.
- Loan demand from the commercial real estate sector should be strong. Of the $4.4 trillion of outstanding loans $730 billion (16%) are set to mature in 2023. Rates, regulations, and credit quality will decide how readily they can be financed.
The Week Ahead
Fed speak is blacked out as we approach the Committee’s May 2-3 meeting, an active week for Treasury and Friday provides the Fed’s preferred inflation gauge.
Monday – Treasury sells $105 billion 13 & 26-week Bills
Tuesday – Treasury sells $42 billion two-year Notes, Consumer Confidence
Wednesday – Treasury sells $43 billion five-year Notes and $24 billion two-year FRN’s, Durable Goods forecast at 0.5%
Thursday – Treasury sells $35 billion seven-year Notes, 1QGDP forecast at 1.8%
Friday – Personal Income expected to drop to 0.2% m/m, with the y/y rate for core Personal Consumption Expenditures declining to 4.5%
April 17, 2023
Monetary Policy
The Federal Reserve Bank has many tools to provide liquidity to the banking system and the one most closely associated with the Treasury market is its policy to control the cost of money, with the most direct impact on short-dated maturities. This YTD chart of the two-year Treasury shows how its rate was tracking the cost of money on March 7 at 5.08% when Silicon Valley Bank made headlines. The ensuing flight to quality for investors drove this rate as low as 3.58% before closing Friday at 4.08%. At that level if institutional investors decide to buy this maturity and need to fund the purchase using Fed Funds at 4.875% (the mid-point of the current 4.75-5.0% range) their interest income is negative 79.5 bps.
With the Treasury curve inverted and most maturities yielding less than 4% it is expensive to buy and hold these securities, yet the market is willing to fade the central bank’s intent to raise rates again and keep them at that level for longer.
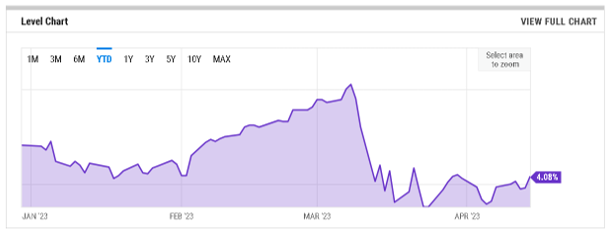
Expectations
The futures market expects rates to peak this June with a rate cut the following quarter, but a recent WSJ survey of economists is not that optimistic. The April survey shows inflation ending this year at 3.53%, up from the 3.1% estimate in January. The current 4.875% midpoint for Fed Funds is expected to rise to 5.125% by June and while that coincides with the futures market forecast fewer economists expect a rate cut by year-end. Unchanged from January is a 61% chance of a recession.
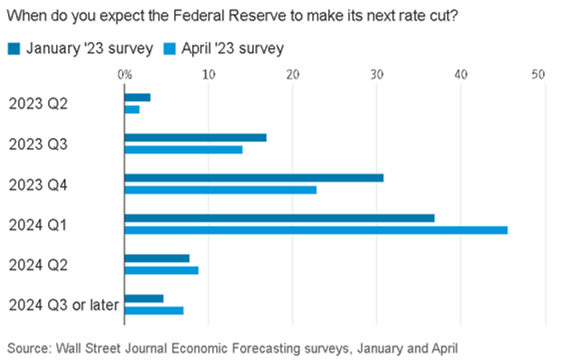
Another report last week came from the IMF and states that reduced bank lending will slow economic growth this year, increasing chances of a hard landing. Its reduced expectations of global growth at 3.1% continue a weakening trend dating back to 2008 and were refuted by Janet Yellen who said, “The outlook is reasonably bright.” Not a resounding endorsement for growth but it was similar to other finance ministers who disagree with the forecast.
Reports
Benign inflation data did little to help rates as the benchmark ten year rate increased to 3.52%, 24 bps higher than when the 504 program priced its April debentures eleven days ago.
- CPI was as expected, +0.1% and 5.0% y/y.
- PPI final demand was much weaker at -0.5% and sharply lower at 2.7% y/y. It remains to be seen if firms will lower their prices to reflect this decrease.
- Retail Sales declined 1%, the most in three years as higher interest rates reduced demand for vehicles, furniture, and appliances.
- Manufacturing Output declined 0.5% and is down from a year earlier. The Fed reports hiring has eased for two straight months and the number of job openings has declined, perhaps an indication of a cooling economy.
The Week Ahead
More Fed speak, a light week for Treasury and reports.
Monday – Treasury sells $105 billion 13 & 26-week Bills
Tuesday – Treasury sells $34 billion 52-week Bills; Housing Starts & Permits
Thursday – Existing Home Sales forecast at 4.48 million; Jobless claims
Friday – Purchasing Managers Index
April 10, 2023
The Week Ahead
FOMC minutes from March meeting to be released on Wednesday. Fed presidents Daly and Barkin to speak on Wednesday, Fed governor Waller on Friday.
Wednesday: Consumer Price Index, YoY 5.2% (consensus) versus 6% in March
Thursday: Producer Price Index, consensus unchanged MoM
Friday: Retail sales
Current Debenture Pricing
Timing is everything! Last month’s debenture priced on March 9, the day before Silicon Valley Bank (SVB) collapsed and roiled the markets. SBIC (the SBA’s Small Business Investment Company program) priced their $1.7 billion offering on March 10 at 10-year Treasury +160 compared with initial price talk of 140-150 bps. Due to financing calendar considerations, SBIC offering was locked into coming to market on that day. Market conditions for the April 504 debenture offerings had stabilized from the second week of March, although spreads were still wider than pre-SVB. Initial price talk on the 20-year and 25-year debentures was +120 bps and +130 bps, respectively, compared with +90 bps and +97 bps in March. By the time of launch on Tuesday, the 25-year debentures were announced at +125 bps, with the 20-year unchanged. Interest from money managers was strong for the 25-year debenture, and the underwriters were able to tighten the spread to +120 at pricing on Thursday. The 20-year remained at +120.
While spreads were wider than in March, the yield on the 10-year Treasury declined from 3.96% at the March pricing to 3.28% at pricing in April. The debenture rate for both issues is 4.48%, compared with 4.86% for the 20-year and 4.93% for the 25-year in March.
Market expectations for further Fed rate hikes have changed dramatically as a result of the banking crisis. In early March, the terminal Fed funds rate was about 6%. Market expectations are now for rates to peak at the May meeting at 5%, with a 50% probability of a 25 bp rate hike in May and a 50% chance of a 25 bp rate cut in July. This has resulted in a 100 bp decline in the 2-year Treasury from 5.06% to 4% since early March, and a 68 bp decline in the 10-year note to 3.28% at the debenture pricing in April.
April 3, 2023
A Very Active Month
Even with the Fed staying the course by raising rates 25 bps last month the benchmark ten-year Treasury has declined from 4% the day the Silicon Valley Bank crisis hit the market. This flight to quality has been felt mostly in shorter dated maturities as evidenced by the 2/10 Treasury curve flattening from -107 bps on March 7 to close the month at -55.8 bps. That change means the two-year Note outperformed the ten-year by 53.2 bps. This demand for government guaranteed debt is forcing credit spreads wider as trading volume in US Treasuries now exceeds $1 trillion daily.
At 3.47% the ten-year Note is lower by 49 bps since the March debenture sale.
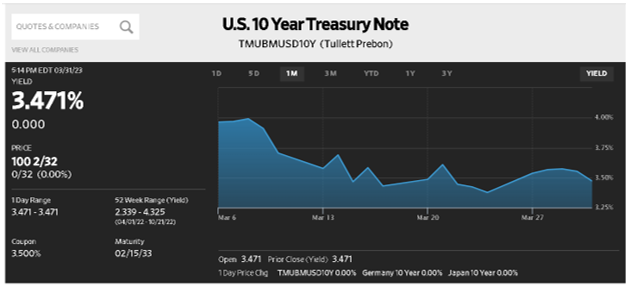
Though the Fed is now expected to stop rising rates sooner than expected they may hold at their terminal rate, now expected to be 4.92% by June, for a longer time. Being data dependent, it is expected the central bank will balance economic activity with their desire for lower inflation as they add bank stability to their watchlist. Bank shares have recovered, gaining 4.7% on the week but still down 25% in March per the KBW Bank Index.
MOVE
Bank contagion has been avoided and bond market volatility is decreasing though it remains higher on the month, as seen below.
Reports last week showed 4QGDP revised lower to 2.6%, consumer spending decline slightly and some improvement in the PCE core index at 4.6%.
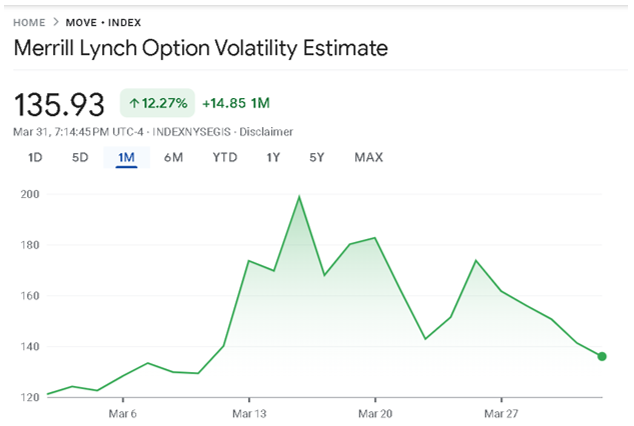
Change
The SBA 504 loan program will price its April debentures this week in an improving yet cautious environment and as mentioned three weeks ago Ken Barnes will be responsible for the pricing, replacing Steve Van Order who has been invaluable to the SBA 504 program and even more so to Eagle Compliance LLC. Steve has been involved with the program since 2001, is responsible for many enhancements in addition to flawless performance in adverse markets like 9/11, the great financial collapse and the Covid pandemic. Fortunately, he will remain with Eagle as both a Board member and consultant to the program.
The Week Ahead
Fed speak is active and Treasury is not.
Monday – Treasury sells $105B 13 & 26-week Bills, ISM report on manufacturing PMI
Tuesday – The 504 program announces the sale of its April debentures
Wednesday – ISM report on business services PMI
Thursday – The 504 program prices its April debentures
Friday – Non Farm Payroll forecast at 235,000
March 27, 2023
Calmer, But Still Cautious
In a week that confirmed expectations of a 25 bps rate hike the Fed held true to its mission to curb inflation with the rates market little changed but with expectations of continued volatility. After reaching as high as 200 after two bank collapses drove a safe haven trade into Treasuries the MOVE index has declined but remains elevated.
At 3.38% the benchmark ten-year Note is 58 bps lower than when the 504 program priced its March debentures with credit spreads wider as the Fed walks a tightrope between inflation and bank turmoil. The bank is raising rates to slow the economy yet has been forced to supply liquidity to member banks to halt further pressure on the system.
What changed the most is the 2/10 curve steepening by 12 bps due to demand for short-term maturities and expectations that rate increases are near an end.
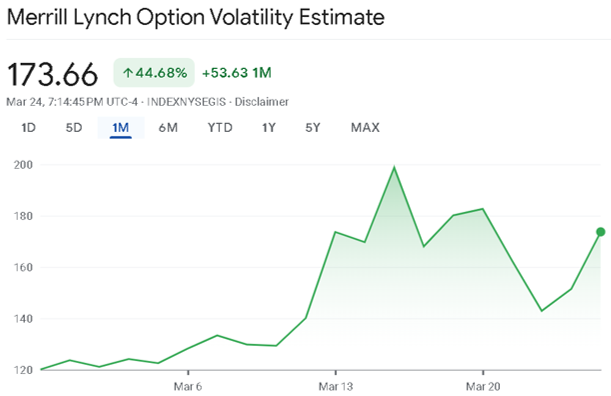
After stating earlier this month that rates could go much higher than 5.25%, Mr. Powell on Wednesday identified just one more increase to that level before the Fed halts to assess market impact. In acknowledgement of how recent events are affecting banking, analysts expect more scrutiny of banks to result in tighter lending standards and Mr. Powell recognized that when he said “We’re looking at what’s happening among the banks and asking, is there going to be some tightening in credit conditions, in a way, that substitutes for rate hikes.” As such, the Committee seems willing to let the market do its job of slowing the economy and reducing inflation.
Other Markets
Equities eked out a small weekly gain as they seem to be marking time with year-to-date gains confined to January as buyers also focus on safe-haven sectors like utilities, health care and consumer staples. Bank shares weakened after Treasury Secretary Yellen told a congressional committee that she “had not considered or discussed anything to do with blanket insurance or guarantees (of deposits).”
This Federal Reserve Bank St. Louis chart shows the recent widening of Aaa Corporate bond yields to the ten-year Treasury as credit spreads have widened in response to the safe-haven trade. The current spread of +105 bps is wider by 33 bps since March 6 after improving slightly on Friday.
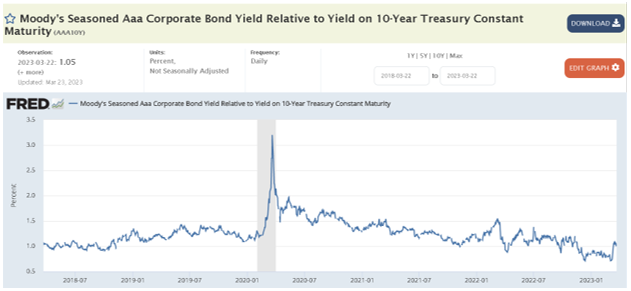
Other assets in demand were the dollar, oil, and gold with futures trading above $2,000 a troy ounce for the first time since March 2022 when the Fed began raising rates. Economic reports showed a 1% decline in Durable Goods orders while existing and new home sales showed growth for the first time in twelve months with 30-year mortgage rates at 6.38%.
The Week Ahead
Fed speak, a fairly active Treasury calendar, 4Q GDP and the Fed’s preferred inflation gauge.
Monday – Treasury sells $105 billion 13 & 26-week Bills, and $42 billion two-year Notes.
Tuesday – Consumer Confidence expected to rise after two months of unexpected declines, Treasury sells $43 billion five-year Notes.
Wednesday – Treasury sells $35 billion seven-year Notes.
Thursday – 4Q2022 GDP forecast to be unchanged at 2.7%.
Friday – Personal Income & Outlays with PI forecast to decline to 0.3% and the PCE price index also dropping to 5.1% with the core index flat at 4.7%.
March 20, 2023
Fed Policy Rejected
It was just two-weeks ago that the market was projecting a terminal Fed Funds rate close to 6%, but that view has been reversed even with the prospect of a 25 bps hike this Wednesday. March 16 marked the one-year anniversary of the Fed’s move to higher rates that have totaled 450 bps to date and that tighter policy had the most impact on short-term securities. The two-year Treasury Note traded as high as 5.03% on March 8 and when news of Silicon Valley Bank’s collapse hit the market it was the front-end of the Treasury curve that outperformed, reducing the 2/10 curve’s inversion from -103 bps to -42 bps, leaving the two-year Note yielding 3.83%.
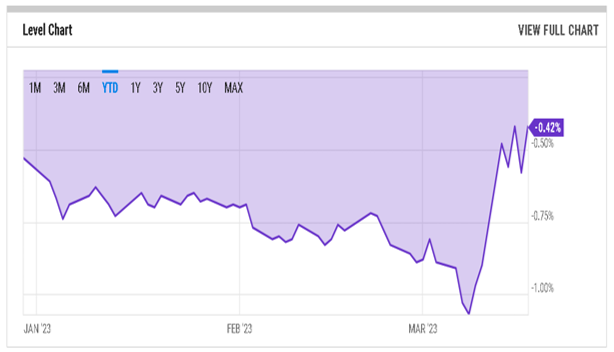
It was this distinction in maturity that caused problems for SVB’s asset/liability match as instead of investing in shorter dated Treasuries that tracked rates and yields higher as the Fed tightened, they selected longer dated Treasuries and Mortgage Backed securities that depreciated more in value, resulting in a $1.8 billion loss when the bank was forced to sell $21 billion of its holdings. The unraveling began in late February when Moody’s notified the bank of a possible downgrade, leading SVB to plan a share sale to raise money. That sale didn’t materialize and led to the sale of fixed-rate securities from the bank’s “hold to maturity” account that did not require them to be marked to market. Because of that those assets were valued far higher than where they were sold. From there, other banks were impacted and the flight to a safe-haven trade in short-dated Treasuries began with global bank shares losing $459 billion in value as $120 billion poured into money market funds.
Volatile
This Merrill Option Volatility Estimate (MOVE) is an indication of bond market sentiment that was gradually increasing in February until it accelerated on March 10, roiling the rates market as investors rushed to money market funds.
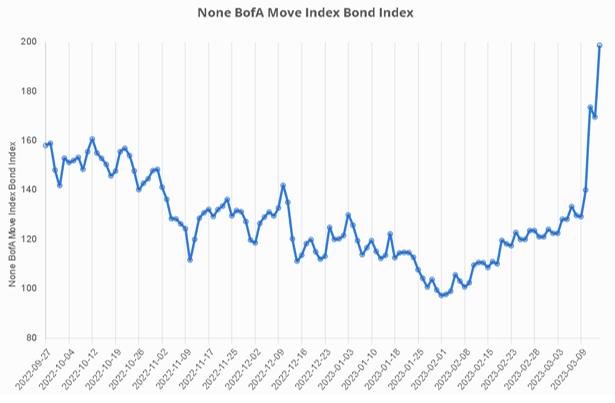
Impact
- Through Wednesday banks had already borrowed $303 billion from the Federal Reserve Bank, probably in response to the Bank Term Funding Program that allows banks to use as collateral assets valued at par, rather than their current market value.
- At 3.42% the ten-year benchmark is 54 bps lower than when the 504 program priced its March debentures eleven days ago and the futures market now forecasts a terminal Fed Funds rate of 4.81% by May 2023 with rate cuts expected by year-end. That estimate has resulted in wider credit spreads in a curve steepening, risk-off environment.
- Attention now turns to the FOMC announcement and Jay Powell press conference Wednesday afternoon. The Committee is faced with a decision to continue its rate increases, pause them in response to a weakened financial market, or cut rates. Of the three, a 25 bps rate increase is most likely as it maintains their consistent approach to control inflation while letting other initiatives lend support to the market.
The Week Ahead
No planned Fed speak until Wednesday’s announcement, a light Treasury calendar and few economic reports.
Monday – Treasury sells $105 billion 13 & 26-week Bills, Existing Home Sales
Tuesday – FOMC meeting convenes; Treasury sells $34 billion 52-week Bills
Wednesday – FOMC policy announcement at 2:00 followed by Chairman Powell’s press conference
Thursday – New Home Sales
Friday – Durable Goods expected to be +0.7%, PMI Composite Flash
March 13, 2023
There are two important changes we report this week to the industry.
After 190 debenture sales from 2001-12 and then 2018-23 I am retiring. It has been my pleasure to serve as Fiscal/Selling agent for the SBA 504 Program. Ken Barnes will take over starting in the April sale cycle. I worked with Ken at Fannie Mae for many years, we even commuted together, and he is eminently qualified to run the monthly offerings. The Eagle team led by Frank Keane otherwise remains fully intact. Frank, of course, has very successfully run the Fiscal/Selling agent business for SBA and the CDCs for over a decade.
In addition, Stifel Nicolaus made its debut as underwriter and replaced Credit Suisse. There is fresh energy yet continuity in this choice as Karen Cady and her colleagues at CS moved to Stifel to continue their fine work in the ACMBS market. Stifel has long-supported all of SBA’s top programs, including trading SBA 504 debenture pools, in the secondary market. Together with our long-serving team at BofA, the underwriters delivered a strong sale of debenture pools in a very tough market this month. Please click here to see debenture sale results:
Current Debenture Pricing
Since the last debenture offering in February, the market priced in significantly more Fed rate hikes. The table below shows you recent quotes for Fed funds futures that shows market expectation of future Fed fund rates. “Higher for longer” is now baked into pricing.
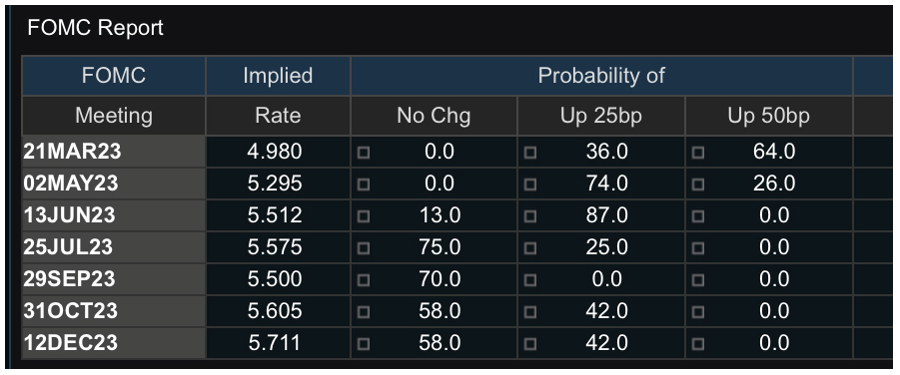
As a result, the Treasury yield curve further inverted and now has a rather extreme profile. One practical impact of this was a rare matching of the 10-year debenture rate at 4.93% with the 25-year debenture rate for the March sale. The table below shows a recent snapshot of the very unusual yield curve profile in the market now.
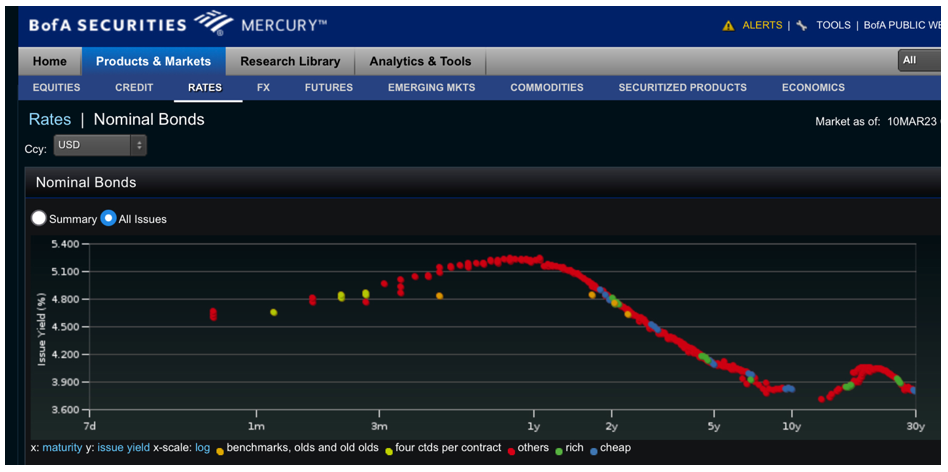
As the market priced in a higher for longer Fed funds rate over the last month, not only did the yield curve invert much more, but expectation built for higher future Treasury yield volatility. We can see that in the chart below. The MOVE index is the rough equivalent in the bond market of the VIX index in the stock market. It increased about 29% versus the February sale.
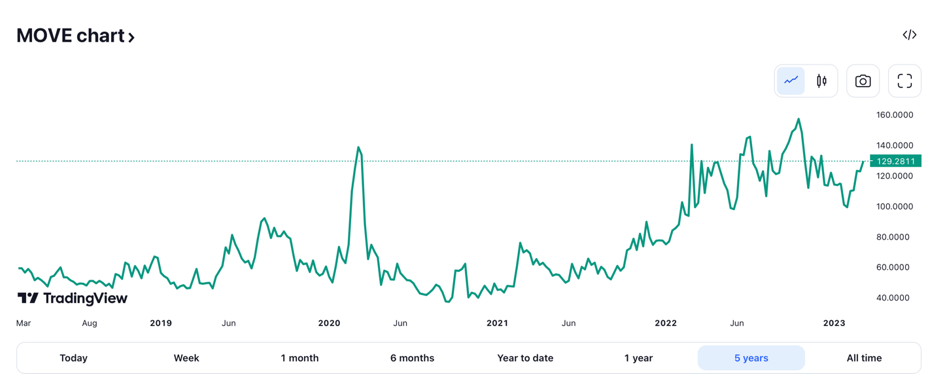
The good news in the debenture sale results this month was additional new buyers brought in by both underwriters and continued strong demand from earlier in the year that flowed over. We were able to keep spreads to Treasury unchanged to even a little tighter. Competing products such as mortgage securities saw spreads widen out quite a bit. At one point, the Bankrate national average 30-year mortgage rate was up near 0.7 point on the month compared to 1/3-point rise for the 25-year debenture rate.
Looking ahead, unless conditions settle down a bit, it will probably be more challenging in the next month or two but we are well positioned to continue to provide smooth and efficient access to competitive debenture pricing for development companies.
March 6, 2023
Higher and Flatter
Stocks ended a three-week losing steak as the Treasury market continued to weaken after breaching 4% earlier in the week. A slight improvement on Friday still leaves the benchmark ten-year note 35 bps higher than when the 504 program last priced its debentures as the market now understands the Fed’s commitment to “higher for longer.”
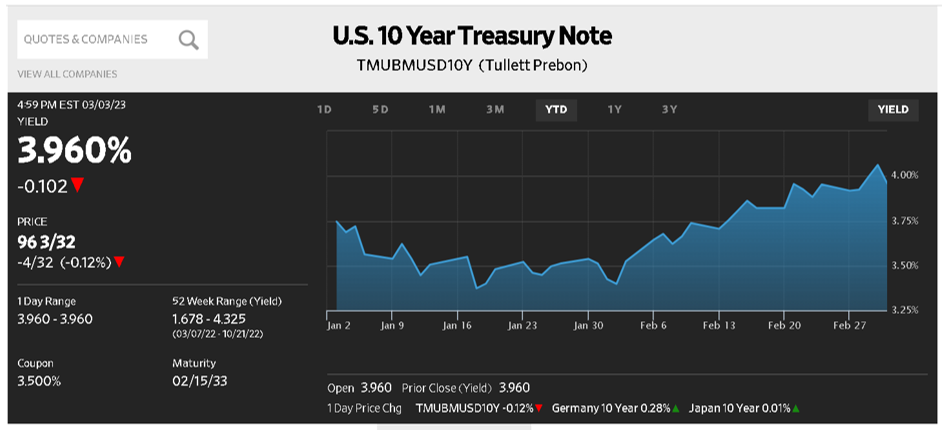
The slope of the 2/10 Treasury curve stands at -89.7 bps as the market now forecasts a terminal rate for Fed Funds of 5.52% in September 2023, 77 bps above the current level with a 25 bps increase expected on March 21.
This hawkish fiscal policy is aimed at slowing wage growth, job growth and the economy yet the February jobs report was far above expectations and this chart shows resilient global manufacturing this year. China’s surge can be partially attributed to its reversal of a strict Covid policy while the more modest US gain was helped by the last jobs report that strongly exceeded expectations plus continued increases in income and spending.
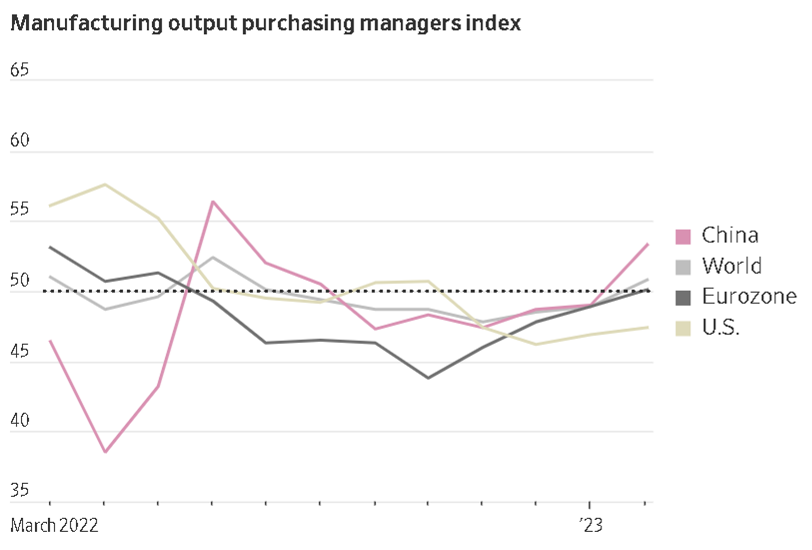
Combined, these developments support what Chairman Powell has steadily advocated, a data dependent policy that is committed to lowering inflation and was reinforced on Saturday by San Francisco Fed President Mary Daly who said: “Restoring price stability is our mandate and it is what the American people expect. So, the FOMC remains resolute in achieving this goal.”
There were no individually significant reports last week but, in the aggregate, they support steady production except for housing where prices showed the first year over year decline since 2012, directly affected by 30-year mortgage rates close to 7%.
The Week Ahead
The Fed’s blackout period ahead of its March 20-21 meeting begins, though Chairman Powell provides Congressional updates Tuesday and Wednesday; the SBA 504 program prices its March debentures, Treasury conducts its quarterly refunding, and we get the February jobs report.
Monday – Treasury sells $105B 13 & 26-week Bills
Tuesday – 504 program announces its March debenture sale; Treasury sells $40B three-year Notes
Wednesday – Treasury sells $32B ten-year Notes
Thursday – 504 program prices its March debentures; Treasury sells $18B thirty-year Bonds
Friday – Non-Farm Payroll report forecast at 225,000
February 27, 2023
Yields Up, Stocks Down
Market erosion early in the week was solidified by Friday’s Personal Consumption Expenditures report, sending the two-year Note to its highest level since 2007 and solidifying the 2/10 Treasury curve at -80.2 bps. This chart shows how the benchmark ten-year Note has risen 32 bps since the February debenture sale in response to higher than expected inflation.
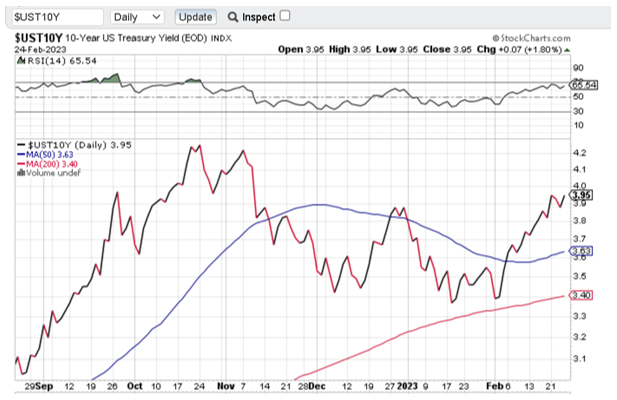
The most recent confirmation of higher costs was Friday’s Personal Consumption Expenditures report that came in above consensus with spending measured at 1.8% monthly vs. a 1.2% consensus and 5.4% y/y vs. an expected rate of 4.9%. The report left stocks down 3% on the week and the rates market expecting the Fed to possibly increase the size of its increase when their next meeting concludes March 21.
After eight rate increases have brought the Fed Funds rate to an upper band of 4.75% the options market expects it to reach 5.41% by this July and gives a 50 bps hike in March a chance of one in three. As always, the question of how long rates remain that high will be dependent on data to convince the central bank its goal of 2% has been or is close to being reached. With additional tightening the market is assuming a risk-off mentality as it awaits higher rates and wider spreads.
This MOVE index, originally from Merrill Lynch, reflects the volatility in US interest rates as it continues to trend higher. The reduced volatility into early February represents the market’s shattered hope of disinflation that is no longer present.
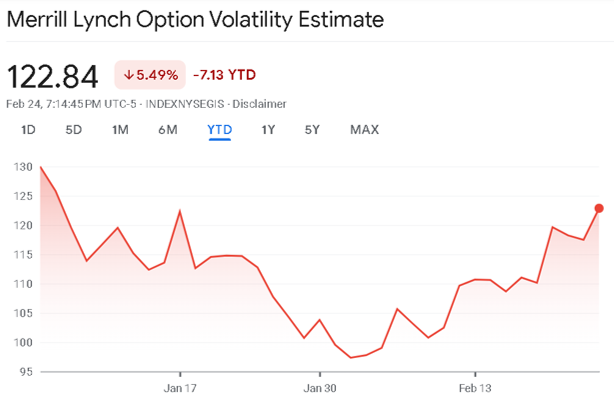
Other Reports
- Minutes of the FOMC meeting earlier this month showed that members favored smaller increases but that was before the last three inflation reports were available.
- New Home sales increased to 617,000 annualized even as 30-year fixed rate mortgage rates hit 6.88%. Existing home sales were flat.
- The second estimate of 4Q2022 GDP declined slightly to 2.7%.
The Week Ahead
More Fed speak, a light Treasury calendar and few reports.
Monday – Treasury sells $108 billion 13 & 26- week Bills
Tuesday – Consumer Confidence forecast at 108.5
Wednesday – Institute of Supply Management reports its PMI expected to be 47.6
Thursday – Treasury announced details for next week’s quarterly refunding
February 21, 2023
Disinflation Deflates
Strong economic reports, especially on inflation, caused the rates market to reverse course and close Friday 13 bps above its intra-week low and 21 bps higher than when the 504 program priced its February debentures. The curve continues to invert in anticipation of another rate hike in March and the options market now prices in a high for Fed Funds of 5.24% (currently 4.75%) by July of this year. That forecast is quite more pessimistic than just two weeks ago when the lower benchmark rate contributed to the February debentures being priced 30 bps tighter on spread than in November. Higher rates and increased volatility will pressure credit spreads as investors reassess the Fed’s commitment to raise rates as high as necessary and keep them there until they are satisfied it is at, or close enough to, their 2% target.
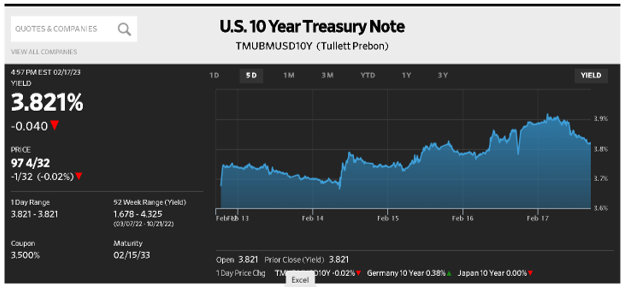
Hat Trick
It was three reports last week that identified more economic strength than expected. Starting with CPI and ending with PPI both inflation reports showed declines from December but not as much as expected. Bracketed by them, Retail Sales was +3%, also stronger than expected and the largest increase in nearly two-years. Vehicles, food, clothing and dining out were the most active categories.
More inflation data is coming this week with the Fed’s preferred measurement on Friday and while the y/y numbers are expected to decline the consensus is for stronger numbers than in December.
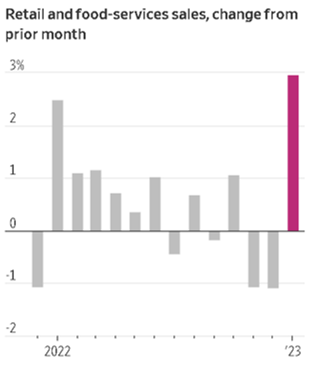
Strength like this follows the very strong January jobs report of +517,000 that accompanied a 3.4% unemployment rate, the lowest in fifty-three years. This is counter to the Fed’s objective, even as the tech industry and finance continue to shed jobs, hiring is strong as is consumer appending.
Both stocks and bonds weakened but their selloffs were modest with the S&P 500 index down just 0.3% on the week and the benchmark ten-year Note higher by 7 bps.
The Week Ahead
More Fed speak, a heavy Treasury calendar ($262 billion) with market focus on the Minutes of the Fed’s February 1 meeting and Friday’s PCE report.
Tuesday – Treasury sells, 13, 26, and 52-week Bills plus two-year Notes
Wednesday – Treasury sells five-year Notes; release of the FOMC February 1 meeting minutes
Thursday – Treasury sells seven-year Notes; 4Q2022 GDP expected to be unchanged at 2.9%
Friday – Personal Income (1%) and Personal Consumption Expenditures 1.2% and 4.9% y/y
February 13, 2023
One year ago the market was only a month away from starting the worst bond bear markets in modern interest rate history. Government and investment-grade bond returns were in the area of negative 15% or more, certainly the worst in a century and probably the worst by since at least the US Civil War.
What a difference a year makes. This month 504 debenture rates fell 30 basis points compared to the prior month from a 15 basis point drop in the 10-year Treasury yield and a 15 basis point tightening of the spread required over the Treasury. Investors started 2023 with cash to spend, a very undervalued bond market, and belief that the Fed was only a few quarter-point hikes away from completing the cycle. In addition, disinflation seems to be in place. Demand for bonds is very strong in early 2023.
As a result we are at the point in the interest rate cycle where long interest rates mainly stopped rising while short interest rates, particularly Fed funds and related rates like the Prime Rate, continued to rise. The chart below identifies the decoupling between the Prime Rate and effective rates for 504 debentures. We've circled the relationships in green. The last time there was a decoupling of this magnitude was back in 2005-06.
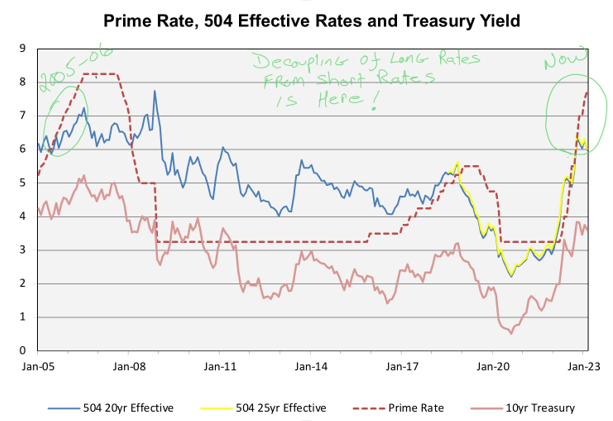
This week inflation data will be front and center. The US economic calendar for important releases is below.
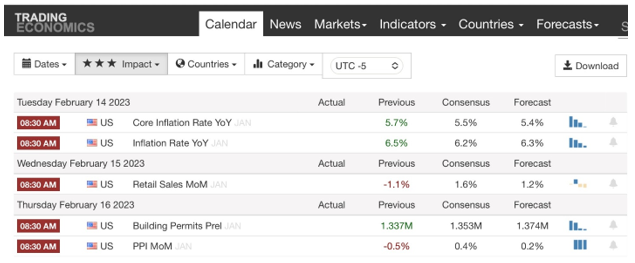
February 6, 2023
Fed vs. the Market
As much as the Fed stays on course to raise rates, even with some recent dovish comments, stocks and bonds find themselves much improved year-to-date. As the 504 program approaches its monthly debenture sale the benchmark Treasury is 24 bps lower than at the January sale with the 2/10 curve slightly more inverted at -76.5 bps. That inversion identifies the pressure on short-term rates that can be expected to continue as another 25 bps rate increase is expected in March.

That action is affirmed by the options market pricing in a peak of 5.01% by June of this year, just 26 bps above the current Fed Funds rate of 4.75%.
Reduced Rate Increase vs. Strong Jobs Report
Continuing the Fed’s dilemma of reducing inflation by raising rates with the expectation it should increase unemployment; Friday’s jobs report may cause the Fed to extend its campaign. 517,000 new jobs resulted in the lowest unemployment rate in 53-years (3.4%) and reversed five-months of slowing job growth.
One positive aspect of Friday’s report was slowing average wage growth of 4.4% in January, down from a revised 4.8% in December.
The Week Ahead
Fed speak has resumed, a light week for economic reports and heavy Treasury issuance from their quarterly refunding.
Monday – Treasury sells $108B 13 & 26-week Bills.
Tuesday – 504 program announces its February sale; Treasury sells three-year Note, Consumer Credit for December expected to be $25 billion.
Wednesday – Treasury sells ten-year Note.
Thursday – 504 program prices its debentures; Treasury sells thirty-year Bond.
January 30, 2023
Small Business Complicates Fed’s Effort to Cool the Economy
That was a headline in the WSJ identifying not just a hiring surge but as this chart points out, the number of job opportunities.
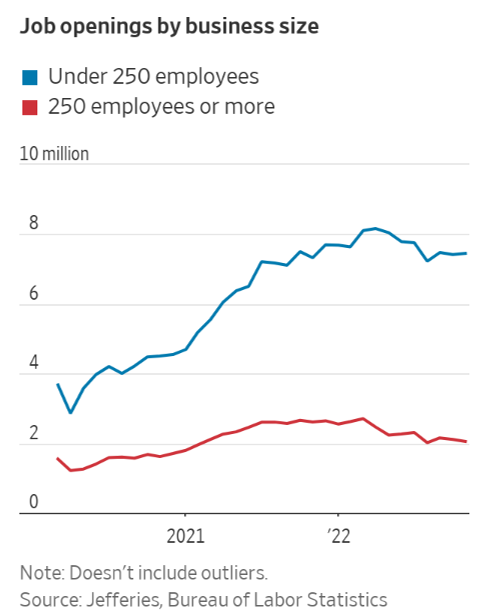
Since February 2020, a period that included a surge in hiring by large tech companies, small businesses, those with 250 employees or less, have added 3.37 million more workers than those who have quit or been laid off while companies with 250 or more employees have seen a net cut of 800,000 workers.
According to a report from Jefferies & Co. small businesses have accounted for 78% of job openings in November and 91% of all openings post pandemic. This type of strength is at odds with the Fed’s tightening policy aimed at slowing inflation and job growth. Yes, that does seem counter-intuitive but higher unemployment results from slower economic growth and demand. “Economic dislocation” is how Chairman Powell describes having more than 10 million job postings with 6 million unemployed.
Debt Limit Countdown
Treasury continues to take extraordinary measures to pay the bills (essentially by not making contributions to government employee investment funds) and should be able to do so until June. Congress remains at odds over increasing the limit as the House is insisting on discretionary spending cuts that are opposed by the Senate majority.
Economy
Economic reports showed strength in the PMI Composite Flash, coming in above forecast, while Durable Goods orders were double consensus at 5.6%. 4QGDP was also above forecast at 2.9%.
Fed Policy
The future for Fed rate increases will be partially answered this Wednesday when the Committee announces its policy decision. The consensus is for an increase less than the 75 bps hikes we have seen before with the options market looking for rates to peak at 4.91% this June. With the upper end of the bad currently at 4.5% recent market performance is hinting at the end of Quantitative Tightening.
Another decision to be made is what to do with bank’s Treasury and Mortgage Backed Securities positions that are now being reduced by paydowns, not outright sales which could pressure rates.
January 23, 2023
Marking Time
Last week saw some volatility in both bonds and stocks but both classes ended the week close to unchanged. For bonds, this WSJ chart shows how the ten-year benchmark traded as low as 3.33% before closing Friday just 3 bps lower on the week and 28 bps lower than when the 504 program priced its January debentures eighteen days ago.
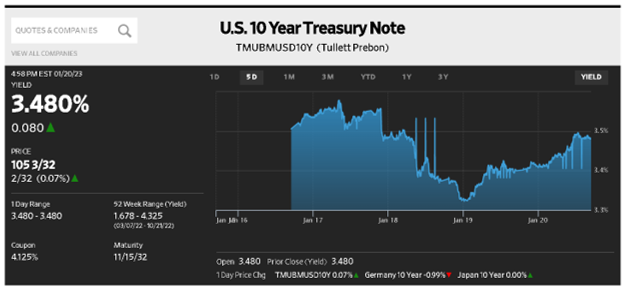
The 2/10 Treasury curve shifted to a slightly less inverted level at -68 bps as we await the next rate increase on February 1. This closing level for the ten-year Note identifies the disconnect between market expectations and Fed policy as caution not to expect a quick reversal of Fed policy was issued by Fed Vice-Chair Lael Brainard who said rates will need to be “restrictive for some time” to ensure inflation can come down. Adding “I just don’t see how the Fed can start cutting rates as soon as it stops hiking.” Yet, cutting rates seems to be what the market is hoping for as the options market prices in a peak for Federal Funds at 4.91% in June 2023. With the upper end of the band now at 4.50% a 50 bps increase next month would reach that level and begin the countdown for how long it remains there.
Jobs
Two of the three equity indexes closed lower on the week as corporate earnings disappointed while the Nasdaq enjoyed a third week of gains. Google joined Microsoft, Salesforce and Amazon in announcing 12,000 job cuts. These measures reflect the rapid expansion for the technology sector during the pandemic as life moved online. Companies are now more focused on belt tightening and more disciplined spending.
Debt Limit and Reports
Treasury Secretary Janet Yellen has cautioned that the government has reached its $31.4 trillion debt limit and has initiated extraordinary measures to make its payments. Increasing the limit is necessary to avoid default but Congress seems far apart as House conservatives seek discretionary spending cuts to approve a debt limit increase.
An expected drop in PPI of -0.5% declining to 6.2% y/y could not offset Industrial Production coming in much weaker than forecast at -0.7% and Existing Home Sales declining 34% in December with its y/y decline of 17.8% its biggest drop since 2014.
The Week Ahead
A heavy Treasury calendar with Fed speak on pause ahead of the January FOMC meeting, and the Fed’s preferred inflation gauge on Friday.
Monday – Treasury sells $108B 12 & 26-week Bills
Tuesday – Treasury sells $34B 52-week Bills
Wednesday – Treasury sells $42B 2-year Floating Rate Notes, $43B 5-year Notes, and $35B 7-year Notes
Thursday – Durable Goods expected to reverse last month’s negative report at +2.7%; 4QGDP forecast at 2.7%
Friday – Personal Income at 0.2%, PCE should decline to -0.1% and 5% y/y; U. of Michigan Consumer Confidence
January 17, 2023
Trust the Markets, Or the Fed?
The Federal Reserve Bank’s Open Market Committee, and its Chairman Jay Powell, have consistently reported they will depend on data to determine how high they raise rates and how long they keep them there. Both approaches are restrictive to economic growth, yet the market performance and growing sentiment indicate more confidence than expected. Since peaking at 4.25% three months ago the benchmark ten-year now trades at 3.51%, much higher than the 1.74% in January 2022 before Quantitative Tightening began.
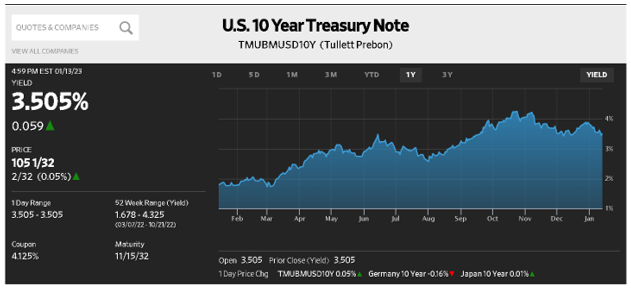
The yield curve’s inversion can be expected to continue as it is expected the Fed will stay on course with another increase at the conclusion of its February 1 meeting. To show the change in the curve over the last year this table identifies the impact on short-term rates in particular.
| Date | Two-Year Note | Ten-Year Note | 2/10 Curve |
|---|---|---|---|
| 1/13/2023 | 4.24% | 3.51% | -73 bps |
| 1/13/2022 | 0.91% | 1.74% | +83 bps |
| Change | +333 bps | +177 bps | -156 bps |
The Committee was slow to recognize how fast inflation rose and is now committed to controlling it and not prematurely reverse course. Yet, the only part of the bond market that is in step with rate increases is the front-end which is most responsive to Fed policy.
Listening to the Market
This Financial Times chart shows performance of the Bloomberg Global Aggregate Index through last Friday, its best performance since 2008. While two weeks is a small sample size it does show the resilience of longer-term rates as the benchmark ten-year Note is down 32 bps since year-end. With fear of a recession still present that event would negatively impact stocks more so than bonds which could be a safe-haven alternative. The YTD gain of 4.5% in the S&P is probably less sustainable than the 3.1% gain in the bond index; but what if inflation is more under control than the annualized reading of 6.5%?
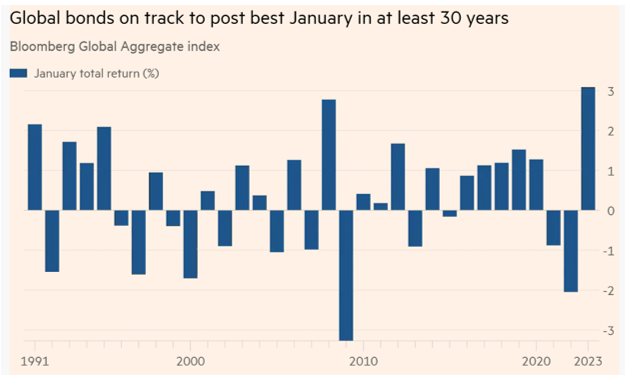
Alan Blinder, a former Vice- Chairman of the Federal Reserve recently wrote of the improved performance for inflation over the June-December 2022 period that if annualized would be around 2.5%, close to the bank’s target. There are reservations about this analysis and reduced energy prices are the cause, down 11% in this five-month period vs. a gain of 27% over the previous seven-months. With the war in Ukraine continuing there is no guarantee that gas will remain near its current levels and that again explains why a twelve-month look back is needed to eliminate seasonal factors.
So, we have the Fed looking to do whatever it takes to curb inflation while some Committee members and analysts advocate for smaller, and possibly fewer increases with part of the answer to be provided one week before the next 504 debenture sale.
The Week Ahead
A light week for Treasury, the last week for Fed ahead of the next meeting, and we get PPI on Tuesday.
Tuesday – Treasury sells 13 & 26-week Bills, PPI expected to be -0.1%, and decline to 6.8% y/y; Industrial Production also forecast at -0.1%
Friday – Existing Home Sales expected at 3.9M annually, down 35% y/y
January 9, 2023
The January 2023 debenture offering came to market immediately after the holidays and investors were in their seats. Underwriting started marketing the week before and we were set to go. The response was quick and solid allowing us to further tighten 504 debenture spreads to Treasury from initial price guidance (that was tighter m/m as well). While SBA was the only agency issuer to tap the CMBS market last week, we had plenty of company from a slew of corporate issuers that also met a warm reception.
The chart below shows (in blue) the 10-year T-note yield at pricing for the past four offerings, three of which were quite close to each other. CDCs received much more stable debenture rates in recent months. But note that the range of the 10-year T-note was almost 100 bps wide (high and low yields are noted in red). Actual and expected yield volatility may have declined in the bond market but remains at an elevated level.
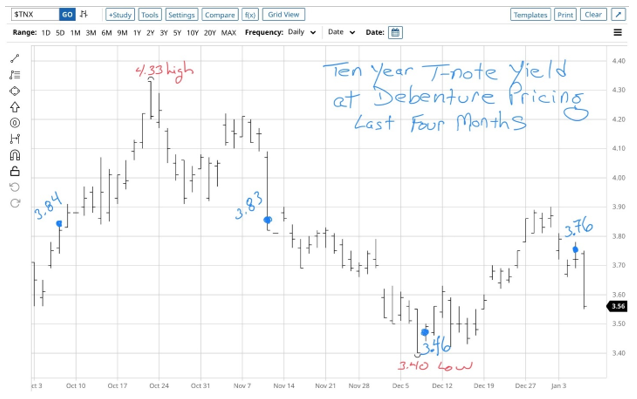
Inflation rate data and expectations and Fed signaling remain the most important influences behind yield movement in the market. The market has settled around expectation for a cycle high Fed funds target rate of about 5% in May or June. That’s 5/8 point above the middle of the current target range. Markets desperately hope that the rate hikes, therefore pain, are almost out of the way with a pause coming for the summer. The Fed has pushed back against these hopes in public comments and in the FOMC minutes. It seems a cheap price for extra hawkish credibility as yields have been much less volatile in the wake of this signaling.
This week we will get CPI inflation data so this “market expectations vs Fed signaling” act may get a test. Notice the consensus (shown below) is for a pretty good decline from last month’s release.
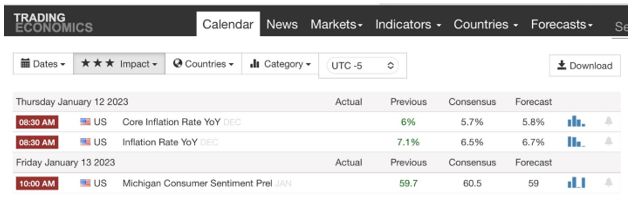
In recent months we seem to have entered that part of the interest rate cycle when the Prime rate continues to move up on Fed hikes but the 10-year T-note yield, therefore 504 debenture rates, settles down (circled in green). SBA 504 20- and 25-year borrower effective rates, calculated from CDC debenture rates and ongoing fees, are nearly 125 bps below Prime for January. You can see earlier phases like this on the chart.
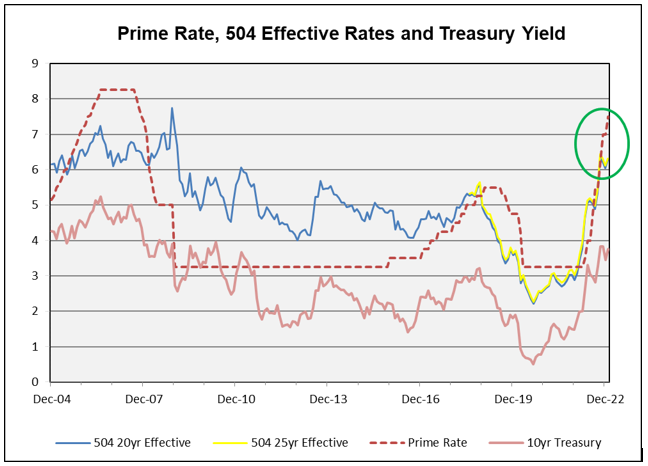
January 3, 2023
Goodbye 2022!
A year that absorbed $30 Trillion in stock and bond market losses from coordinated central bank tightening still has room to run, especially because of China’s reversal of its Zero Covid policy which can open the country to increased infections for a population with a low vaccination rate. This Financial Times chart shows the dire performance for stocks and bonds while commodities outperformed due to supply chain disruptions that were exacerbated by Russia’s invasion of Ukraine.
Stock and bond performance is measured in total returns for global markets while commodities are spot prices.
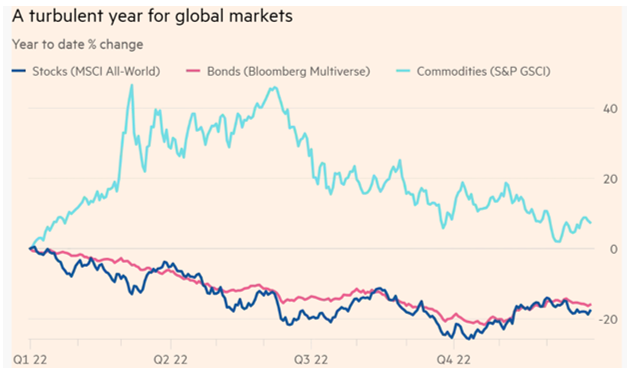
According to a recent report from the International Monetary Fund one third of the global economy is projected to be in recession in 2023 and it is hoped that any drop off in the US will be shallow.
Of most importance to the SBA 504 program is how the benchmark ten-year Treasury responded to 425 bps of rate hikes with another 50 bps expected this quarter. Once the Fed does reach that terminal rate attention will focus on how long it keeps it there.
Last week the benchmark’s closing rate was 3.88%, higher by 240 bps ytd, and 42 bps above where the 504 program priced its December debentures.
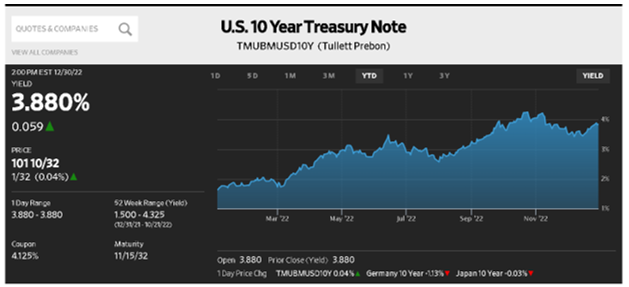
This is a fast turnaround for the program’s monthly schedule and will make the January debentures one of the first sales efforts of the new year.
The Week Ahead
Treasury sells just short-term Bills, a light CMBS calendar, the 504 program prices its three January debentures and we get the jobs report on Friday.
Tuesday – 504 program announces its debenture sale; Treasury sells $95B 13 & 26-week Bills
Wednesday – Minutes of the December 14 FOMC meeting are released; ISN Manufacturing index expected to decline
Thursday – 504 program prices its January debentures; International Trade in Goods & Services expected to decline
Friday – Non-Farm Payroll forecast at 200,000 with the Unemployment Rate holding at 3.7%
December 19, 2022
Lat week’s commentary serves as both a December sale update and a recap of the SBA 504 loan program’s accomplishments and will serve as this year’s final in depth comment.
Briefly, last week saw coordinated central bank tightening with the Fed raising rates 50 bps with little impact on the rates market but equities continuing to lose ground as the likelihood of a recession becomes more apparent.
Of significance this week is Friday’s Personal Income & Outlays Report that includes the Fed’s preferred inflation gauge. It will be interesting to see if a continued decline in PCE can outweigh concerns about the economy’s health.
Everyone at Eagle Compliance LLC thanks you for your support and wishes you a Merry Christmas and a Happy Holiday Season!

December 12, 2022
$100 Billion Issued and a Nice Break. We all know 2022 has been an historically bad year in the bond market. Everyone, including the Fed, missed just how rapidly and how far the Fed would raise rates this year as inflation remained well above most all forecasts. Losses to bond investors this year will be among the worst on record for any year. The fast acceleration upward of Treasury yields and SBA debenture spreads to Treasury was nearly unparalleled in the long history of the 504 program.
So, it was nice to see some recovery in Treasury yields and spreads for the December sale with 504 debenture rates lower by 42 bps m/m. The 10-year Treasury yield declined 39 bps m/m. We were able to tighten the spread to Treasury for both the 20- and 25-year pools by 5 bps m/m. December was the only month in 2022 in which we were able to tighten in the spread to Treasury m/m for the 25-year pool. Below are a few charts to highlight the sale.
The red line in the chart below shows December’s m/m decline within the uptrend for the 25-year debenture rate. The blue line shows the monthly total debenture offering amount. December’s offering size was relatively small by recent standard at $484 MM, but that still was a pretty large deal by the longer-run standard. Issuance of $7.8 B for calendar year 2022 smashed the record of $5.8 B from 2021 and the prior record of $5.1 B in 2020. Pre-pandemic, 2019 issuance was $4 B, and we thought that was a big year. The program has been on a sustained issuance roll these past three years.
Program total issuance has surpassed $100 B. Congratulations to all!
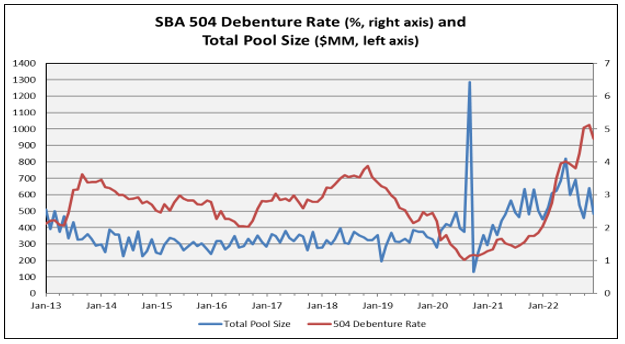
The next chart shows the o/h/l/c for the 10-year T-note the past three months with highlighted levels on debenture pricing days. I’ve annotated this and the following charts to provide some color.

This next chart shows the decline in expected Treasury yield volatility over the past month or so and this helped agency MBS spreads tighten quite a bit, thus offered us the change to tighten the debenture spreads in December.
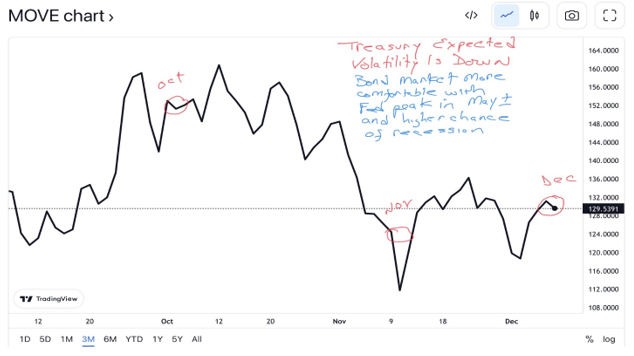
This last chart shows that the Treasury yield curve, as measured from the two-year to 10-year points, is the most inverted since 1981. As we discussed at the annual meeting general session, inverted yield curves put a lot of spread widening pressure on prepayment sensitive securities like SBA debenture pools. That is a reason why we tightened the spreads just a bit in December. The 2-to-10 spread inverted a huge 47 bps m/m as the disinflation/recession trade took hold in the bond market.
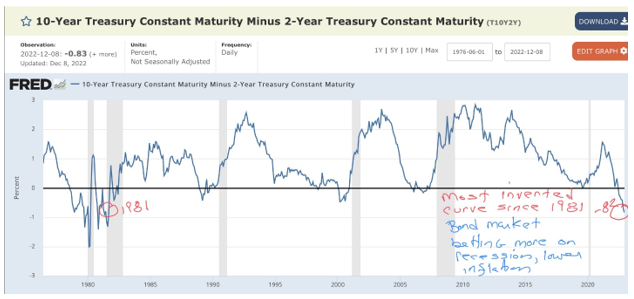
Fed on Tap. This week the main event on the calendar is the Fed’s policy announcement on Wednesday. The market consensus is solidly for a half-point increase to 4.5% (top of range) with some guidance that out-sized hikes are finished. The FOMC projections for the Fed funds rate will be of interest too, to see if they start to align more with the market expectation.
h1>December 5, 2022
Three Questions, at Least
In a market that has seen great volatility during the Fed’s QT phase there are at least three questions that overhang the market:
- How many more rate increases to expect? Part of the answer should be supplied with a 50 bps increase at the end of the FOMC meeting on December 14. After six rate hikes this year, with the last four being for 75 bps each Chairman Powell has indicated the Fed is likely to reduce future increases but may take rates higher than expected.
- How high will the Fed raise rates? Apparently not as high as the market expected jut a few weeks ago as the futures market is pricing in a peak of 4.93% for May 2023.
- How long with the Fed stay at that rate? Estimates vary as the Fed has said policy is data driven, but unless the Committee believes high rates are stifling the economy, we can expect no easing in 2023.
Not as Expected
In a week that saw the benchmark ten-year Note rise as high as 3.79% in advance of the Fed’s preferred inflation gauge and the employment report, it defied expectations and rallied to close at 3.49%, down 20 bps on the week and 34 bps lower than when the 504 program priced its November debentures. Not even Friday’s stronger than expected jobs gain could sustain an initial move higher.
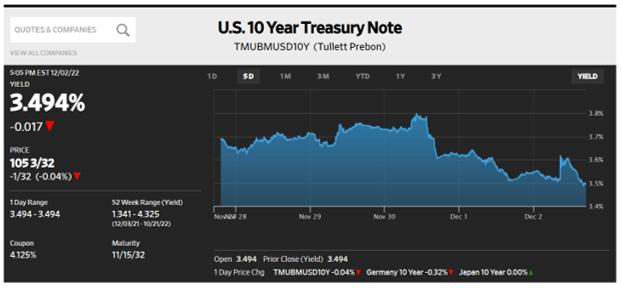
Reports
- Starting with Personal Consumption Expenditures the monthly rate was flat at 0.3% and the y/y rate of 6.0% showed a decline from 6.3%. It was the Personal Income gain of 0.7% and 5.1% y/y that was stronger than expected and is counter to the Fed’s goal to reduce inflation. Labor costs have been identified as a key to controlling inflation and a job market that is alternatively described as tight but with a jobs gain of 263,000 on Friday it can be increasingly difficult to evaluate the jobs market.
- At 3.7% the unemployment rate remains historically low and while it seems counter intuitive for the Fed to want more people out of work the high cost of money can curtail businesses’ growth which can reduce hiring.
- The second estimate of third quarter GDP came in above consensus at 2.9%.
- Consumer confidence declined as consumer spending increased 0.8% in October.
- US personal savings rate continues to decline to 2.3% in October, down from 3.2% three months before.
The economy presents the contradiction of increasing layoffs competing with strong monthly job gains while Black Friday and Cyber Monday sales set records as people deplete their savings as those who are employed enjoy increased wages. That is the dilemma the Fed is faced with reducing the size of rate increases while doubling down on lowering inflation.
The Week Ahead
The SBA 504 program prices its December debentures, no Fed speak ahead of the FOMC meeting on December 13-14, a light week for overall issuance.
Monday – Treasury sells $95B 13 & 26 week Bills
Tuesday – 504 program announces its 20 & 25 year debenture sale
Thursday – 504 program prices the debentures
Friday – PPI forecast at 0.2%
November 28, 2022
Slower, But Continuing
Wednesday’s release of the minutes from the FOMC’s November 1-2 meting confirmed speculation the bank would dial back the pace of rate increases while cautioning rates could rise to somewhat higher than expected levels next year. The impact showed a continuation of lower long-term rates and an increased flattening of the yield curve.
The ten-year benchmark closed lower by 13 bps (3.69%) on the week while the 2/10 Treasury curve closed at -74 bps, its most inverted weekly close during this QT period. This continued inversion acknowledges the market expects additional rate increases but is accepting of lower long-term levels that are pressuring credit spreads to widen. Another indication of that flattening move is the 30-year mortgage rate is now 6.64% after parking at 7.37% in mid-October.
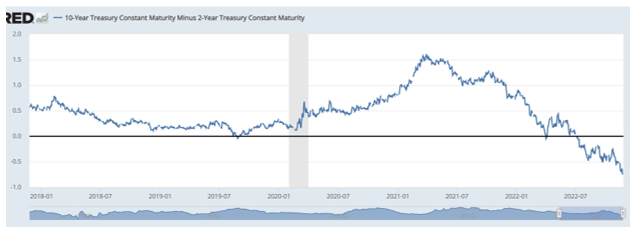
Symmetry
Regarding the trend of higher rates and wider credit spreads it is interesting to note how they relate to pricing the 504 program’s 25-year debentures by tracking the last four-months’ change in rates.
| 10-year % | Credit Spread to 10-year | 25-year DCPC % | |
|---|---|---|---|
| November | 3.83% | +130 bps | 5.13% |
| October | 3.84% | +120 bps | 5.04% |
| September | 3.22% | +100 bps | 4.26% |
| August | 2.82% | +98 bps | 3.80% |
| Change | +101 bps | +32 bps | +133 bps |
With a majority of Committee members endorsing smaller but additional rate hikes the futures market’s expectation of a peak rate of 5.04% in June 2023 confirms more increases from the current upper band of 4% with more curve inversion and wider credit spreads.
Updates
- With inflation data easing somewhat US corporate bond funds saw a $16 billion inflow, the largest gain in two years and while the Bloomberg US Aggregate Index shows a 13% decline in value ytd perhaps this is a sign bonds are attracting more interest.
- Equities eked out a 1% weekly gain as tighter central bank policy has become more defined.
- China’s Zero Covid policy has resulted in more shutdowns as infections continue to rise, amid a surprising number of demonstrations protesting the restrictive Covid policy which is weakening the economy. In the hope of increasing bank lending the Central Bank eased bank’s reserve requirements.
The Week Ahead
A light Treasury calendar, Fed speak starts winding down ahead of the next meeting on December 13-14, and we get the Fed’s favorite inflation gauge Thursday.
Monday – Treasury sells $99B 13 & 26-week Bills
Tuesday – Treasury sells $34B 52-week Bills, Consumer Confidence, and the Case Shiller Home Price Index
Wednesday – 2nd estimate of 3Q GDP forecast at +2.7%
Thursday – Personal Income expected to be 0.4%, and PCE 0.3% monthly and 6% y/y (5% ex food & energy)
Friday – Non Farm Payroll expected to be 200,000, down from 261,000 the previous month
November 21, 2022
A Quiet Week
Rates and stocks marked time as the market prepares for the next FOMC meeting on December 13-14 which is expected to result in another rate hike of at least 50 bps. Of interest is how this ten-year Treasury chart shows how the benchmark note is trading 44 bps lower than its October high even as the Fed has raised the upper end of its funds range to 4%.
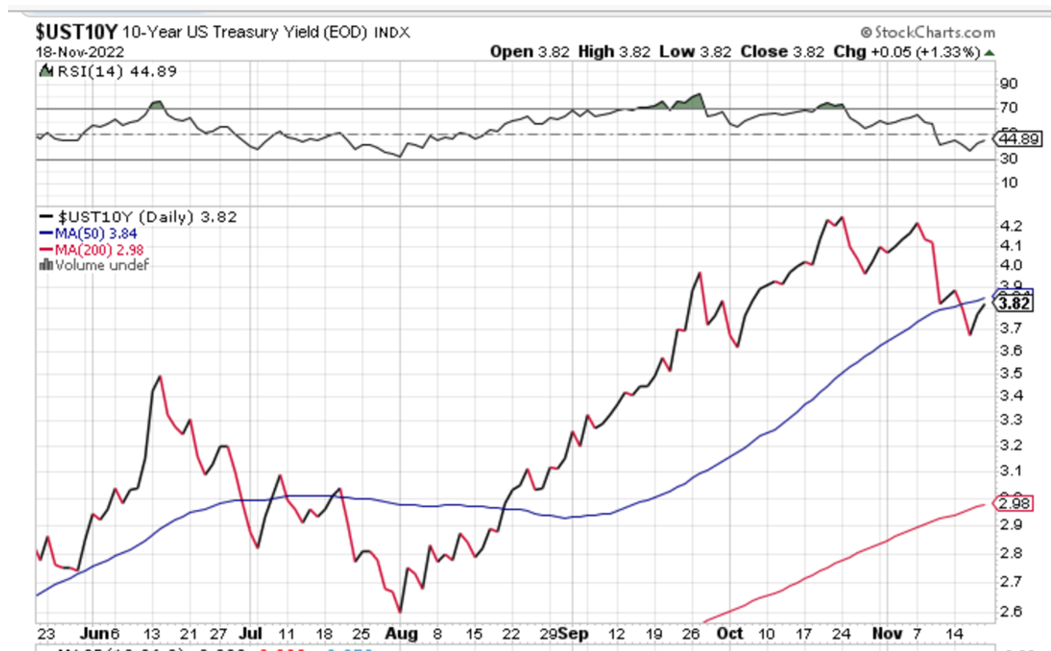
A mid-week rally in rates was halted when James Ballard, President of the St. Louis Fed commented that recent rate increases “have had only a limited effect on observed inflation” and that rates may need to exceed 5% to be effective, something the futures market agrees with as it expects rates to peak at 5.06% by June 2023.
Small Gains
PPI, like CPI the week before, showed some improvement with a gain of just 0.2% and 8% y/y. Other reports were mixed:
- Retail Sales were +1.3%
- Industrial Production declined 0.1%
- Housing stats weakened due the higher mortgage rates with housing starts & permits lower and Existing Home Sales declining for the ninth consecutive month, down 5.9% in October and 28.4% y/y
Liquidity
With the Fed no longer providing QE to the Treasury and Mortgage-backed securities markets attention has turned to the resilience of financial markets, especially the $24T US Treasury market. While it is impressive that long-term rates have defied the rate increases more concern is being expressed over is preparedness to manage market stresses as it serves as the benchmark for most products. With Fed policy dependent on stable markets regulators are seeking measures that will provide a consistently stable market environment with more disclosure.
The Week Ahead
A true holiday for us to be thankful for…

November 14, 2022
Thank You BLS! CDCs were facing an approximately 40 bps rise in 20- and 25-year debenture rates m/m until the Bureau of Labor Statistics (BLS) released better than expected CPI data Thursday morning. Treasury yields fell about 33 bps right away. As a result, the 20- and 25-year debenture rates only increased 9 bps m/m. You know it’s been a tough year in markets when a 7.7% y/y gain in the CPI ignites a huge rally (a lot of short covering maybe?) in bonds and stocks (S&P up 5% on the day).
As we announced and marketed the deal, but prior to the CPI release, Treasury yields were about 1/3-point higher m/m. Other measures, however, were a touch improved versus October. Actual and expected volatility eased and the yield curve in our part of the woods was a bit less inverted. That said, other issuers in our space continued to labor to place their issues, widening spreads to Treasury from initial pricing talk (ipt). Our entire ACMBS sector widened to Treasury over the month. Bank investors continued to face an unfriendly yield curve shape and money managers faced net outflows all year long.
Knowing we would bring the fifth-largest deal on record to market, in advance of announcement the underwriters hustled to make the case for the new SBA deal. They placed long-term historical charts and other analyses in front of investors and recruited those who’d been long sidelined. The deal received solid investor participation with somewhat more demand than available supply. The SBA program shined in a tough market. And then we got very lucky with that friendly CPI print on the morning of pricing as seen in the chart below.
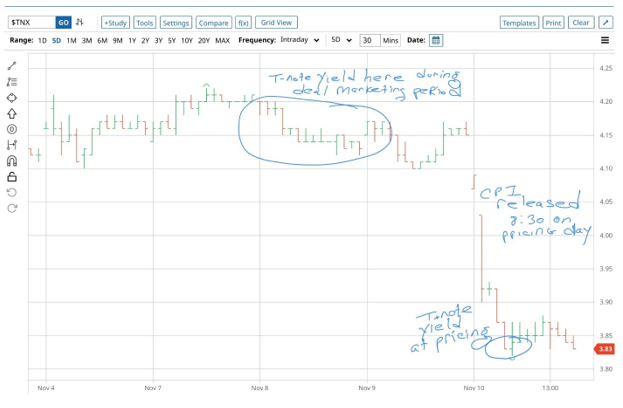
Thank you BLS!
November 7, 2022
Smaller increases, but Higher rates
Anyone thinking the Fed, and its chairman in particular, might soften the commitment to raise rates and keep them high was disappointed in Wednesday’s announcement. The central bank’s fourth consecutive 75 bps increase brought its funds target to a range of 3.75-4.0% and while it was indicated the December hike might be reduced 2023 increases might be extended.
What is most compelling about Chairman Powel’s statements was “the question of when to moderate the pace of increases is now much less important than the question of how high to raise rates and how long to keep monetary policy restrictive.” The latter part of this quote confirms markets should not expect a quick U-turn on Fed policy once it reaches its terminal rate, now believed to hit as high as 5.10% in June 2023.
This WSJ chart shows how the benchmark ten-year Note moved higher by 16 bps on the week and sits 32 bps higher than when the 504 program priced its October debentures. The rise in rate was dominated in the front-end of the curve, meaning the 2/10 curve inverted further by 8 bps to close the week at -49.4 bps.
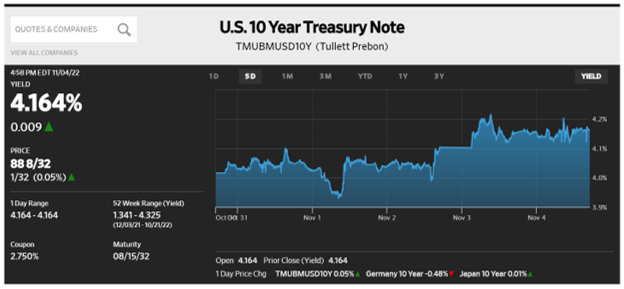
The rise in rates and the inversion of the yield curve continue to pressure credit spreads as investors demand more yield to compensate for the risk of rates moving to the upside.
Reports
Friday’s Non-Farm Payroll report was the most significant release and was above consensus at 261,000 with an upward revision of 52,000 for the September report. The unemployment rate increased to 3.7% due to a decline in the civilian participation rate. Wage gains slowed to 4.7% y/y which leaves worker’s income are below the elevated inflation rate of 8.2%. Monthly gains are lower than the year ago period but far higher than the 189,000 monthly average in pre-pandemic 2019.
Stocks reacted favorably to the report, but Friday’s performance did not prevent the major indices from ending their four week stretch of gains.
The Bank of England raised its key interest rate by 75 bps, its largest increase since 1989 to curb inflation while admitting it risks driving the economy into a prolonged recession.
The Week Ahead
SBA 504 program prices its three November debentures, Fed speak resumes, and a light economic calendar.
Monday – Treasury sells $102B 13 & 26-week Bills
Tuesday – 504 program announces its debenture sales, Treasury sells $40B 3-year Notes
Wednesday – Treasury sells $35B 10-year Notes
Thursday – 504 program prices its debentures, Treasury sells $21B 30-year Bonds, CPI forecast at 0.6% declining to 8% y/y
Friday – University of Michigan Consumer Confidence report
October 31, 2022
A Tale of Two Rates
Much has been written recently about rising rates as the Fed pursues a hawkish policy to combat inflation, yet the benchmark ten-year Treasury declined 20 bps last week while the 2/10 Treasury curve inverted by another 15 bps, meaning short-term rates (the cost of money) are tracking Fed rate hikes higher while longer dated Treasuries are not.
With an expected 75 bps rate hike this Wednesday the upper end of the Fed Funds band will increase to 4.0% with the probability of that 2/10 curve inverting further. The futures market still expects an eventual rate of 4.91% in May 2023.
As seen in this WSJ chart the benchmark Treasury traded as low as 3.91% on Thursday before easing off as equities continued an unexpected rally and concern over market illiquidity and a recession abated.
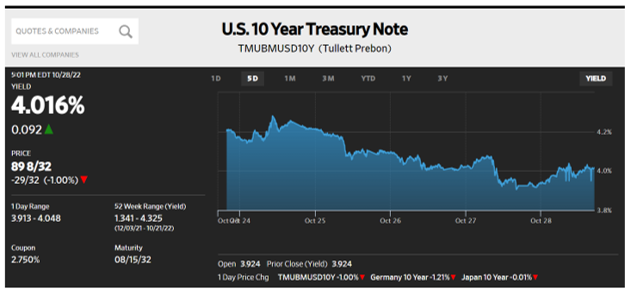
Mixed Signals
Economic reports last week continued to send mixed messages re: economic conditions. Negative, or disappointing items were:
- Purchasing Managers Index weakened
- Consumer Confidence fell more than expected
- New Home Sales declined as 30-year mortgage rates remain above 7%
Positive indicators were:
- Durable Goods orders were as forecast at 0.4% but the August number was revised higher by a like amount
- 3QGDP was stronger than consensus at 2.6%
- Household spending belied weak consumer confidence by increasing 0.6%
- Employment cost index rose 5% y/y as employers competed for workers in a tight labor market
That last item is displayed in the chart below and identifies why the Fed is raising rates as well as identifying how far below the CPI rate of 8.2% workers find their income.
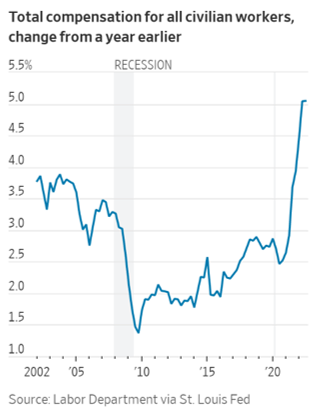
Stocks defied the traditional bearish performance for October with the DJIA on track to finish the month +14%, its best monthly performance since January 1976.
The Week Ahead
The Fed speaks on Wednesday, and a very light Treasury calendar.
Monday – Treasury sells $102B 13 & 26-week Bills
Tuesday – Treasury sells $34B 52-week Bills, FOMC meeting begins, ISM Manufacturing index expected to continue its slow growth
Wednesday – FOMC announcement at 2:00 pm followed by Chairman Powell press conference
Thursday – Preliminary productivity & costs forecast at 0.6%, Bank of England expected to raise rates by 75 bps to 3%
Friday – Non Farm Payroll consensus is 210,000, down from September with the unemployment rate possibly increasing to 3.6%
October 24, 2022
Higher
With the futures markets now projecting a peak rate of 4.89% in March 2023 it does reflect a decline from 5.02% the day before and represents the hope contained in a WSJ article that the Fed may pursue a tamer pace of rate increases after December. That said, the rates market continues to move higher as the benchmark ten-year Note closed at 4.21%, higher by 19 bps on the week, 37 bps since the October debenture pricing, and 266 bps ytd. The next meeting of the Federal Open Market Committee ends November 2 and a fourth consecutive 75 bps increase is expected as the bank looks to tame inflation. This stockcharts.com chart shows the weekly close of the benchmark Treasury going back to the Fed’s QE phase and shows how rates have accelerated since the summer. Additional increases are expected and once the Fed has reached what it believes the terminal rate to be, the question will turn to how long it holds rates there.
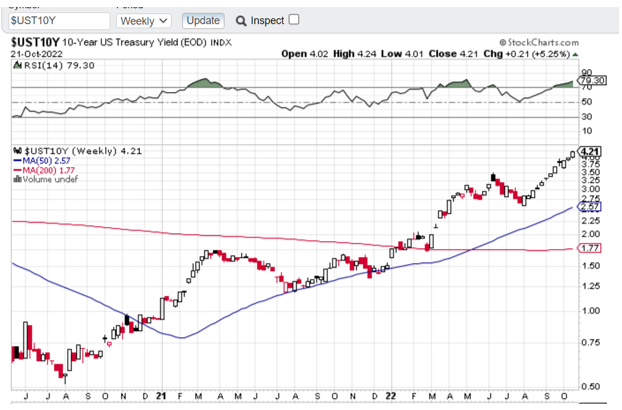
Added market pressure is coming from both the failure of Tory leadership in the UK and their divisive mini budget that roiled markets three weeks ago, and illiquidity in the increasingly volatile $23T Treasury market. Now that the Fed is no longer buying Treasury and Mortgage-backed securities its tightening money policy is proving problematic for efficient market making. Japan also is experiencing fallout from the increasing strength of the $US as the Bank of Japan needed to spend $30B last week to support the yen which had fallen to a 32-year low. As shock waves like this develop central banks will be challenged to maintain orderly markets.
What did Well?
Stocks had their best weekly gains since June as they took comfort in the hope of a slower pace of rate hikes with the S&P 500 up 4.7% in a choppy week and the Nasdaq better by 5.2%, as seen in this chart below. While there is a sense of certainty that rates will increase continued strength in equities is less sure.
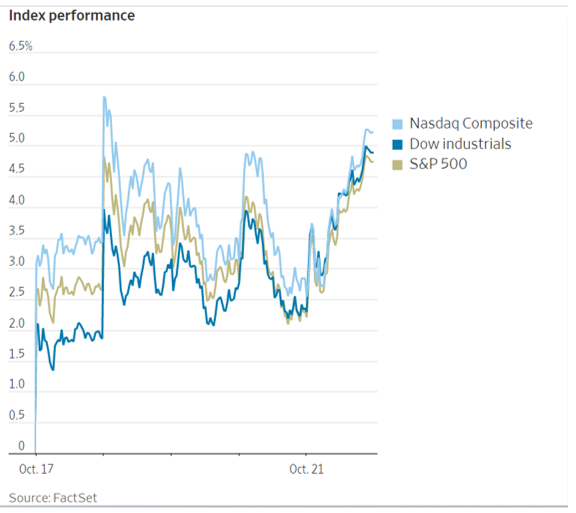
Reports
Nothing significant though housing data continues to reflect the impact of a 7.32% mortgage rate
- Leading Indicators were -0.4% though August was revised upward by 0.3%
- Housing Starts & Permits continued a downward trend
- Existing Home Sales declined in September
- Industrial Production gained 0.4% vs. a forecast of -0.1%
The Week Ahead
No Fed speak during blackout period leading up to November 1-2 FOMC meeting, an active Treasury calendar and the Fed’s preferred inflation gauge on Friday.
Monday – Treasury sells $102B 13 & 26-week Bills
Tuesday – Treasury sells $42B 2-year Notes, PMI Flash expected to be flat, Consumer Confidence in decline
Wednesday – Treasury sells $43B 5-year Notes, New Home Sales expected to decline
Thursday – Treasury sells $35B 7-year Notes, Durable Goods forecast 0.6%, 3QGDP consensus 2.3%
Friday – Personal Income expected 0.3%, PCE forecast as 0.3% and 6.3% y/y
October 17, 2022
Mixed Signals
Markets sold off again last week as inflation hasn’t declined even though Retail Sales numbers were weaker than forecast, a sign that consumer spending is being affected by the 8.2% y/y increase in inflation, a four decade high. Friday’s performance reflects the conflict of raising the cost of money with an objective to weaken the labor market and consumer spending which represents 70% of GDP. Initially, markets were positive after Friday’s Retail Sales report because isn’t weaker demand an objective of a tight money policy?
By midday both Treasuries and equities were unable to hold their gains and the benchmark ten-year rate rose 14 bps, putting it 18 bps above where the 504 program priced its October debentures nine days ago. This one-day chart from the WSJ shows how abrupt that change was a couple of hours after the report’s release as the futures market is now pricing in a peak rate of 4.963% in March 2023. Acknowledging that, the 2/10 Treasury curve inverted further to -48.1 bps as a fourth consecutive 75 bps rate increase is expected when the next FOMC meeting concludes November 2nd.
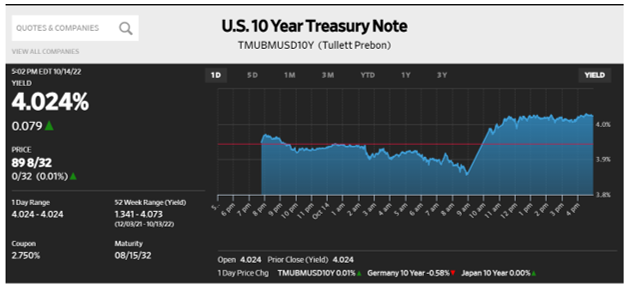
Events
It was ironic that markets shrugged off the earlier in the week inflation reports that came in above consensus as more modest increases were expected.
- PPI rose 0.4% vs. a forecast of flat, putting it at 8.5% y/y
- CPI also was 0.4% vs. a forecast of 0.2%, putting it at 8.2% y/y
- Jobless Claims were as expected at 228,000
- Consumers spent more on increasingly expensive items like food and less on items with falling prices like gasoline and furniture
- Volatility in the UK increased after the government walked back its planned tax cuts as investors are concerned about future borrowing needs and the stability of the new government
- US 30-year mortgage rates hit 7.16%, up almost 400 bps ytd
The Week Ahead
Fed speak, a light Treasury calendar and few reports.
Monday – Treasury auctions 13 & 26-week Bills
Tuesday – Industrial Production and Capacity Utilization forecast at 0.1%
Wednesday – Treasury sells 20-year Bonds
Thursday – Existing Home Sales, Treasury sells 5-year TIPS
October 10, 2022
Another sharp debenture rate rise in October. The 25-year debenture rate rose 78 bps to 5.04%. The 20-year rate at 4.89% was highest since June 2009. Full detail regarding the debenture pricing results can be found at this link:
Current Debenture Pricing (eaglecompliance504.com)
The 2022 bond market storm is very rare in severity. The 2022 bond market continues to be one of the worst in modern history, and by some measure since the Civil War, for reasons now well recognized. The last time a 20-year 504 debenture pool was set with a rate above this month’s 4.89% was in June 2009. The Treasury curve inversion in the five-to-ten year segment is back to where it was in the first half of 2000. Back then the CPI inflation rate bounced around 3%, not 8% like now. Actual and expected volatility measures remain persistently high and at levels reflecting market stress.
In the 36-year history of the 504 program the monthly 20-year debenture rate increased 70+ bps just seven times in 432 offerings, a 1.6% frequency. Two of those events (Apr and Oct) now have occurred in 2022, and in no other single prior year did that occur. The historical-based probability of this happening in any one year is extremely small. Just as one can talk about a very rare destructive flood, so we can speak in that way about the rarity of 504 experiencing two 70+ bps m/m rate increases this year.
This experience of course correlates with the Fed’s signaling steep hikes/QT followed by an extraordinary string of 75 bps rate hikes and related movement in the Treasuries. The chart below shows the extraordinary moves in the 10-year T-note rate. We look forward to our general session presentation in November to further dive into these topics.
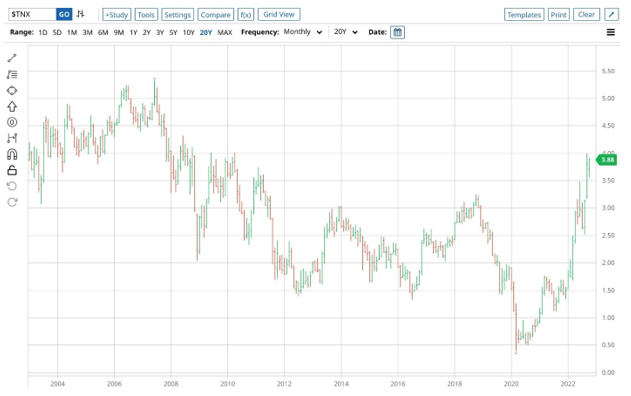
Effective rates remain near Prime but there is hope for some decoupling in 2023. 504 effective rates for October were near the 6.25% Prime Rate (see chart below). The Fed, however, may hike the target Fed funds rate another 75 bps on October 21 to 4% (we quote the top of the target range), which would result in a 7.00% Prime Rate. If indeed the market-implied forecast for the peak Fed funds target is correct at 4.5% in 2023, and the economy slows materially, the T-note yield eventually may find a home fluctuating around the 4% level.
But that would be only after the market becomes comfortable with the idea of a stable Fed funds target rate. Until then the T-note yield may well overshoot 4%, perhaps by a lot. And the market may change to a higher expected Fed funds rate that 4.5%. But coming off of a base of 0.25% the Fed funds rate probably seems to have been lifted the majority of the way, 3 points and counting.
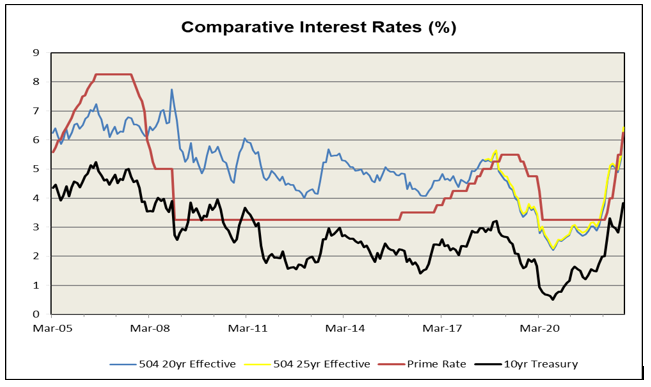
*Curve inversion cycles require more spread over Treasury to market, sell and trade prepayment sensitive mortgage-backed pools and related instruments such the 504 pools.
October 3, 2022
The Week That Was
As if dealing with the devastation wreaked by Hurricane Ian was not enough last week saw enhanced pressure on rates, stocks, and foreign exchange markets. While multiple rate increases by central banks have sent rates higher and equities lower it was the recent British fiscal statement that forced the Bank of England to announce an emergency £65 billion intervention to support its gilt market, while the pound crashed to its lowest level since 1985. This Financial Times chart shows how high its ten-rate rose on Wednesday before the intervention brought its level down by 45 bps that day, before closing the week at 4.23%. This “mini budget” statement from the new administration blew up global markets, a case of “the tail wagging the dog,” according to one analyst as S&P Global Ratings lowered its outlook on UK sovereign debt.
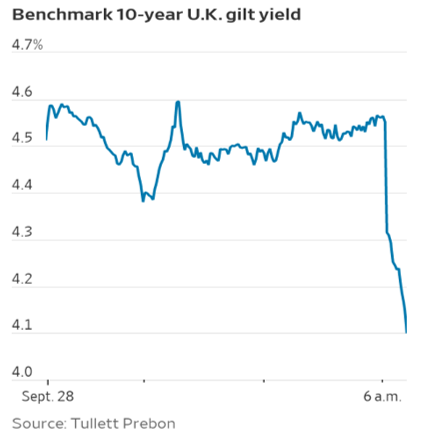
Higher and Wider
The impact was felt in the US as the ten-year benchmark traded as high as 4.0% before recovering to close on Friday at 3.81%, higher by 9 bps on the week and 55 bps higher than when the SBA 504 program priced its September debentures just 21 days ago.
This WSJ chart shows the rise in its rate ytd as the Fed has tightened monetary policy to a range of 3.25%-3.50% with another increase expected in October to further pressure credit spreads that are affected by increased volatility and illiquidity.
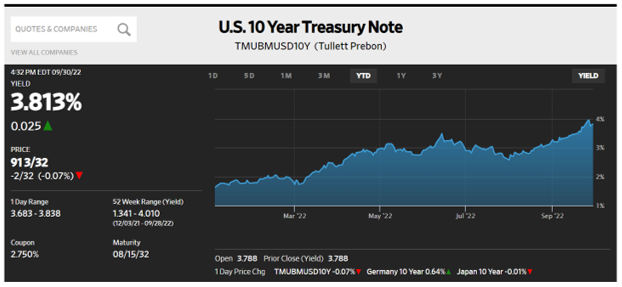
Global market conditions are uniformly unsettled as markets closed out a losing week, month, and quarter. For stocks, the major US indexes ended the first nine months of the calendar year with their worst performance since 2002 as it is belatedly recognized that the Fed’s hawkish policy is aimed not just at inflation rates and the job market but also at overvalued stocks that are firmly in bear market territory. Rallies in rates and equity markets are thin and seem to present better selling opportunities than purchases.
Economic Reports
- Friday’s release of the Fed’s preferred inflation gauge at 0.6% and 4.9% y/y was like the previous week’s CPI report in that it was above consensus but didn’t have as harsh a market impact.
- 3Q2022 GDP was -0.6% as expected
- Household spending increased in August as purchases remain strong despite entrenched inflation
- Jobless claims remain light in a strong jobs market
- Eurozone inflation reached 10%, further weakening global currencies vs. $US
The Week Ahead
SBA 504 program prices its October debentures, more Fed speak, a light Treasury and Agency CMBS market and Friday’s jobs report.
Monday – Treasury sells $105B 13 & 26-week Bills
Tuesday – SBA 504 program announces its debenture sales, Treasury sells $34B 52-week Bills
Wednesday – International Trade for Goods & Services expected to decline by $68B
Thursday – SBA 504 program’s 20 & 25-year debentures are priced
Friday – Non Farm Payroll forecast to be 275,000, Unemployment Rate to remain 3.7%
September 26, 2022
Central Banks on the Move
Wednesday’s third consecutive 75 bps rate increase by the Fed was joined by at least five other central banks though another one, Turkey, actually lowered rates to 12% in their unique attempt to combat 80% inflation. Bank of England raised rates by 50 bps to 2.25% and the Swiss Bank moved from -0.25% to +0.50%. While the Bank of Japan left its benchmark rate at -0.1% it did sell $US to support the ¥ which has devalued 20% this year.
With the Fed Funds rate now at a 3.25% base this Financial Times dot plot chart shows how Federal Open Market Committee members expect a median rate of 4.25% - 4.50% in 2022 and a final hike in 2023 before declining near 2.5% longer term. Former Treasury secretary Larry Summers believes the Fed may not raise rates high enough and for long enough to tame this demand driven inflation while some doves believe the pace of Quantitative Tightening is too aggressive for a weakening economy.
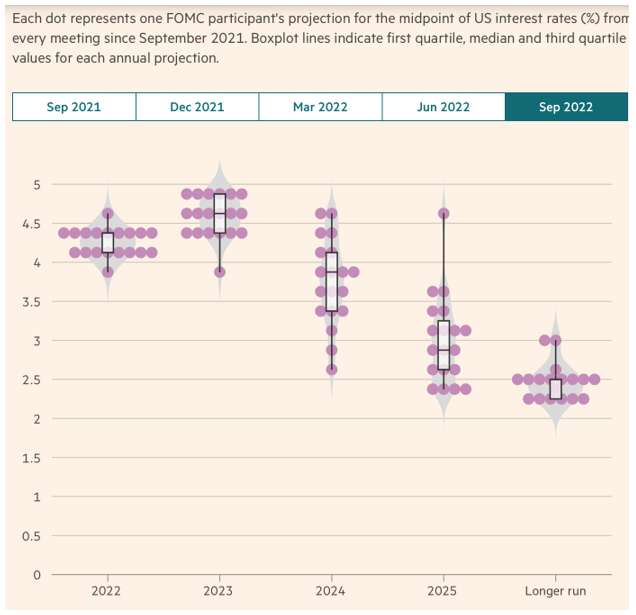
These are projections, as are estimates for how long the Fed will maintain its terminal rate as it balances its goal of price stability while maintaining economic growth.
More Pain
“We have to get inflation behind us. I wish there were a painless way to do that. There isn’t,” was Chairman Powell’s comment during his press briefing and reinforces comments made at Jackson Hole when he said, “economic growth could be restrained for some time.” One Powell comment appreciated by the market was his statement regarding the bank’s balance sheet that “mortgage backed securities sales were not something we’re considering right now and not something I expect to consider in the near term” as investor demand for product is light, supply is heavy, and liquidity is reduced.
The unanimous vote of Committee members affirms the bank’s commitment as it confronts conflicted circumstances: strong consumer spending and a robust labor market vs. historic inflation and aggressive monetary tightening. Some basic questions are:
- What is the Fed’s Terminal Rate? The futures market expects it to be about 4.70% to be reached in May 2023.
- How long will they hold it there? Probably longer than expected unless it is an overshoot, and the economic landing is harder than hoped for. GDP projections for 2022 were lowered from 1.7% to 0.2% with a 2Q2022 estimate coming this week.
- What will Unemployment Rate be? It is projected to rise to 4.4% from its current level of 3.7%. That is a significant change and its negative impact on GDP could be severe.
Rate Changes
A simple display showing how mortgage rates have tracked short-term Treasuries that are most impacted by a tight Fed policy that will continue. The number of newly listed homes has declined by 20% y/y not only because prospective buyers are less inclined to take on a mortgage at a rate that has doubled this year, but existing homeowners feel reluctant to give up what is called the “golden handcuffs” of historically low rates on their own mortgage. A low mortgage rate coupled with an average 17% gain in value y/y could limit the supply of available properties and offset the weaker demand from high rates.
| Issue | 9/23/2022 | 1/4/2022 | Change |
|---|---|---|---|
| 2-year Treasury | 4.20% | 0.78% | +342 bps |
| 10-year Treasury | 3.69% | 1.66% | +203 bps |
| 30-year Mortgage | 6.70% | 3.27% | +343 bps |
The Week Ahead
Fed speak resumes, active Treasury calendar, heavy Agency CMBS activity, the third estimate of 2Q2022 GDP and the Fed’s preferred inflation gauge.
Monday – Treasury sells $105B 13 & 26-week Bills and $43B 2-year Notes
Tuesday – Treasury sells $44B 5-year Notes, Durable Goods orders expected to decline, Consumer Confidence remains high, Case Schiller Home Price index forecast at 0.3% and 17% y/y
Wednesday – Treasury sells $22B 2-year FRN’s and $36B 7-year Notes
Thursday – Jobless Claims and 2Q2022 GDP forecast at -0.6%
Friday – Personal Income to increase 0.3% while core Personal Consumption Expenditures to increase to 0.5% and 4.8% y/y
September 19, 2022
Higher rates, more inversion, and weaker stocks
All it took was Tuesday’s disappointing CPI report showing inflation in August was 8.3% and the move was on. CT-10 ended the week 14 bps higher, the 2/10 Treasury curve inverted further to -41 bps and the S&P 500 index declined 4.8%. A measure of this report’s impact is the changed expectation for how high the central bank may raise rates. Last week Steve Van Order wrote market expectations that had been 3.50% in July had risen to 4%, and now that peak is forecast to be as high as 4.46% in March 2023, inferring a Prime Rate between 7.25- 7.5%.
This WSJ chart shows the YTD change in the ten-year Treasury rate (+182 bps) as the Fed has raised short-term rates to an average of 2.375% with another 75 bps increase expected this Wednesday.
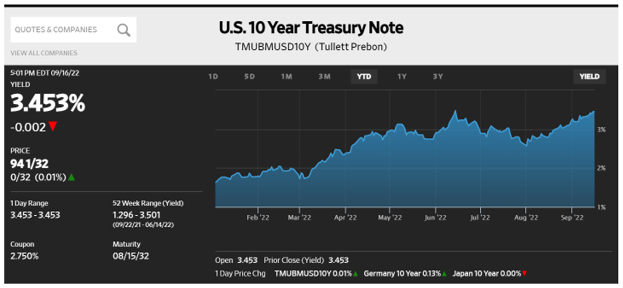
The ten-year breakeven rate, measuring the difference between the ten-year Treasury rate and ten-year TIPS is now 2.375%, something the Fed would like to see lower.
There is no turning back for the Fed as it is committed to lowering inflation and that resolve will translate into higher rates and more pain for asset classes. The delicate balance central banks must maintain is determining the terminal rate without pushing economies into recession, something that many expect in 2023.
Other developments last week were:
- FedEx’s revenue fell below expectations and warned about projected sales and the health of the US economy, leaving its share price lower by 21% on the day
- Goldman Sachs announced planned layoffs
- General Electric said supply chain problems are weighing on profits
- Jobless claims remain low, indicating a strong labor market
- A $16.5B Citrix buyout that had been planned earlier in the year to repay bank loans is now being marketed at rates near 9.5% as it attempts to find a market clearing level
- Mortgage rates topped 6% for the first time since 2008
Other Reports
- PPI declined 0.1% as expected, 8.7% y/y
- Retail Sales was above consensus at 0.3%
- Industrial Production declined 0.2%
- Consumer sentiment followed August’s strong gain, rising 1.7 points
The Week Ahead
The FOMC decision is announced Wednesday, Bank of Japan and Bank of England also have announcements, a light week for Treasury and economic reports.
Monday – Treasury sells $105B 13 & 26-week Bills
Tuesday – FOMC meeting opens, Existing Home Sales & Permits, Treasury sells $12B 20-year Bonds
Wednesday – FOMC announcement and Chairman Powell press conference
Thursday – Jobless claims, Treasury sells $15B ten-year TIPS
Friday – PMI Composite flash expected to show slight gains in services and manufacturing
September 12, 2022
The debenture rate rise resumed. After four months of steady debenture rates centered around 3.9% for the 25-year maturity, the September 2022 SBA 504 debenture offering resulted in an increase in debenture rates. For example, the 25-year debenture rate rose to 4.26%. Full detail regarding the debenture pricing results can be found at this link:
Current Debenture Pricing (eaglecompliance504.com)
The 2022 bond market storm continues. The 2022 bond market continues to be one of the worst in modern history for reasons now well recognized. The last time a 20-year pool was fixed with a rate around this month’s 4.10% was in February 2011. The Treasury yield curve has not been this inverted in the five-to-ten year segment since the first half of 2000. Back then the CPI inflation rate bounced around 3%, not 8% like now. Interest rate volatility has not been sustained at such a high level since the GFC in 2008. After losing 1.5% in 2021, the US Aggregate bond market total return index is down 11% year to date, a loss more normal in magnitude for equities. Not surprisingly, bond funds experienced huge outflows this year.
The market for 504 debenture pools (DCPCs) has been a place of relative calm amid this storm and during a record year of debenture issuance. The market for 504 debenture pools has been relatively calm during this storm. The following factors have been at play to provide stable 504 debenture market access for CDCs in a year of record debenture issuance ($7.1 billion issued in FY’22 smashed prior records):
- full faith and credit guarantee on pool payments and uncomplicated deal structure
- long, steady presence in the market, well known and on a set calendar
- wider and deeper buyer base developed by the underwriters in recent years
- front and center attention by the underwriters to effectively market the debentures
- underwriters’ readily make markets in the pools in volatile markets
- movement of debenture pool spreads to fairly wide levels over Treasuries
- timely updates to disclosure documents with no legal or regulatory surprises
All market interest rates were up over the past month as expectations increased for a higher “terminal” Fed funds rate in 2023. The primary reason for the m/m increase in September was a change in market expectations for Fed rate hikes from August. The Fed’s more hawkish tone during, and after, the annual Jackson Hole retreat in July, and decent labor market data, resulted in the market expectation for the Fed funds rate to peak in mid 2023 at almost 4%. This compares to expectations of 3% and 3.5% back in July and August, respectively. The roughly half-point m/m increase in the market’s expectation for the “terminal” Fed funds rate for the tightening cycle translated straight over to Treasury yields. The benchmark ten-year Treasury note yield increased 44 bps m/m to 3.26% that increase fed straight through to the 504 debenture rates. The shape of the very inverted yield curve, however, was similar to the one during the prior deal.
Competition from other products was pretty strong. Versus August, agency-guaranteed resi mortgage pool spreads to Treasury were a lot wider, benchmark ACMBS spreads were out about 5 bps and IG corporate spreads out yet wider. After a quiet July and August there was a crush of other supply as we marketed the 504 deal which included corporate debt offerings and Freddie and Fannie fixed rate multifamily-backed deals. A couple of investors held back to wait for the semi-annual SBIC offering later in the month. We were pleased to have maintained spreads to Treasury for the debenture pools at recent months’ levels given the competition in a more bearish market.
Effective rates were back to near Prime but may not be for long. 504 effective rates for September were back up near the 5.5% Prime Rate (see chart below). The Fed, however, is on track to hike the target Fed funds rate another 75 bps on September 21, which would result in a 6.25% Prime Rate.
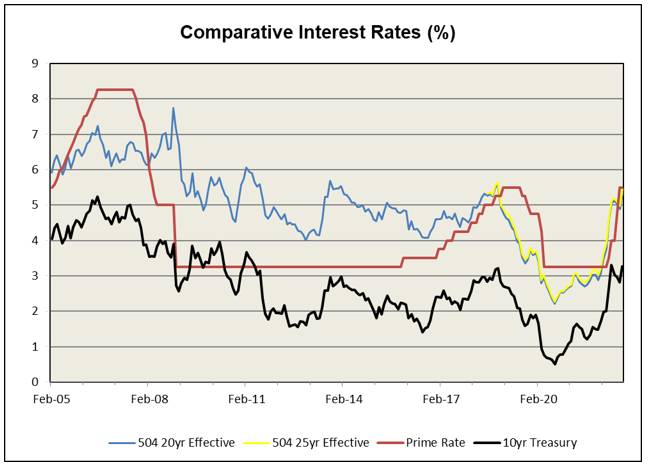
*Curve inversion cycles require more spread over Treasury to market, sell and trade prepayment sensitive mortgage-backed pools and related instruments such the 504 pools.
September 6, 2022
Trends Continue
After the release of Friday’s jobs report equities moved higher, only to reverse course later in the day and continue their downward trajectory for a third consecutive week. The number was as predicted with surprising increases to both the Unemployment rate (3.7% from 3.5%) as more workers entered the labor force, and Labor Force Participation Rate (up 0.3% to 62.4%) a possible sign employers are having an easier time finding workers. Both categories fulfill Fed objectives though using monetary policy to solve a supply side shortage is not easy.
The rates market also sold off as the ten-year benchmark rose 15 bps on the week with the 2/10 curve steepening, an observation I still find confusing in a negatively sloped curve. At 3.20% the rate is 10 bps lower than its highest point last week as the market anticipates a 75 bps rate hike from the Fed on September 21.
This stockcharts.com chart shows how the ten-year rate’s recent peak occurred after the June 15 increase and then tracked lower, even after another 75 bps increase on July 27 as the misconception that the Fed would reverse policy after its final rate increase was in vogue. Recent Fed comments have dispelled that notion as the 504 program prepares to price its August debentures.
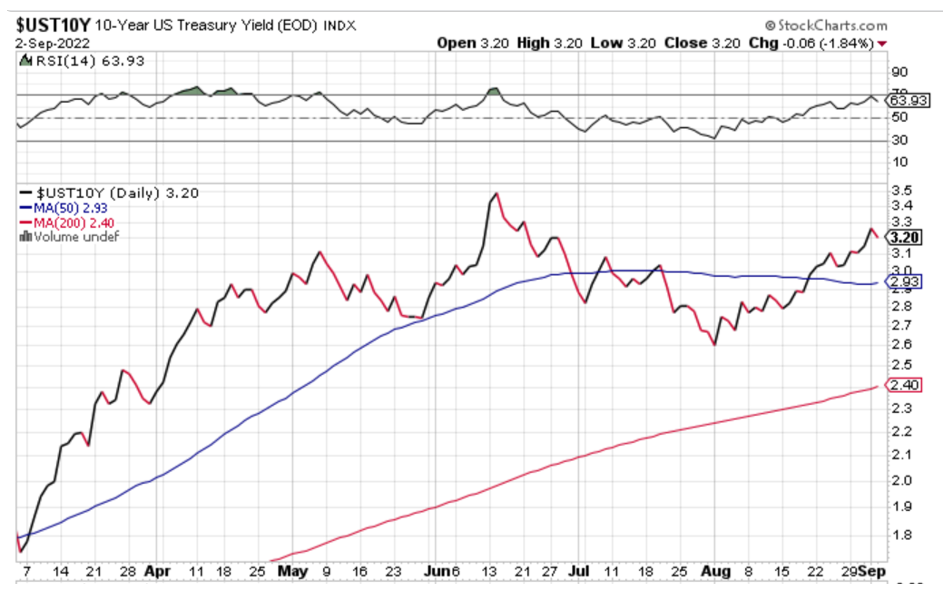
This 38 bps increase since the August sale just 25-days ago leaves the benchmark Note at a level not seen for a debenture sale since November 2018, during the last cycle of Fed tightening.
Reports
Economic reports were mostly constructive:
- Consumer Confidence increased above consensus after three consecutive declines
- ISM Manufacturing exceeded forecast at 52.8
- NFP was above forecast with average hourly earning holding at 5.2% y/y
- Factory Orders were a disappointment at -1%
The Week Ahead
The SBA 504 program prices its August debentures, a light week for Treasury and economic reports, and Chairman Powell speaks again on Thursday
Monday – Treasury sells $139B 13, 26 & 52-week Bills
Tuesday – SBA 504 program announces its debenture sale
Thursday – 504 program prices three debentures; Chairman Powell speaks at the Cato Institute on monetary policy
August 29, 2022
Price Stability
At the Jackson Hole Symposium on Friday Chairman Powell cautioned that rate hikes to calm inflation will cause hardship and the message was clearly understood by equity traders as the DJIA declined 1,000 points. This unconditional commitment to halting the highest inflation rate in decades should have a longer lasting impact than some people have hoped for, and that sentiment was clearly captured by Bob Michele of JP Morgan Chase in the Financial Times: “It could not be clearer that they are going to continue raising rates and running down the balance sheet until they get clearly on top of inflation; this fantasy that they will start cutting rates a few months after the last rate hike is nonsense.”
The sentiment that another 150 bps of rate increases could quickly bring inflation down near the Committee’s 2% target and permit rate cuts shortly thereafter disappeared after the Chairman’s comments. This WSJ chart shows how the Nasdaq was off as much as 4% from its Thursday close, seemingly a confirmation that July’s performance was just a bear market rally especially considering the Chairman’s comments about committing to fight inflation.
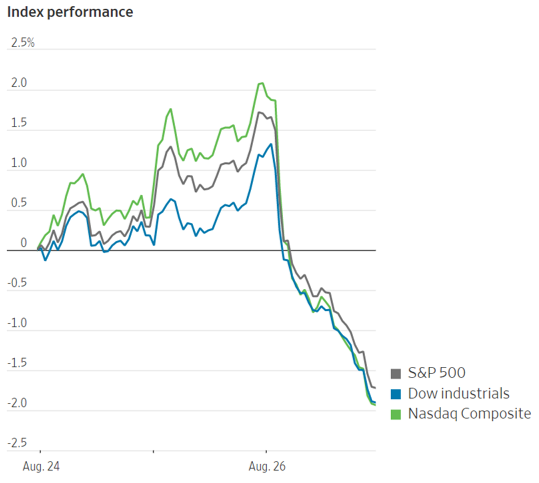
Contrast
As the Fed seeks price stability by reducing demand the Administration’s decision to cancel up to $20,000 for certain student borrowers has the potential to boost longer term inflation and increase federal budget deficits, stimulus that may require more hawkishness from the Fed. That remains to be seen, but as shown in the WSJ chart below, last week’s events had little impact on the benchmark ten-year Treasury as it closed just 5 bps higher on the week and 22 bps higher than when the 504 program priced its August debentures. At 3.04% it is at the mid-point of its two-month range of 2.60% and 3.50% while the bigger change has been the slope of the 2/10 curve that has shifted during that time from +5.5 bps to -34.5 bps with expectations for a further inversion as the Fed pursues a tighter monetary policy.
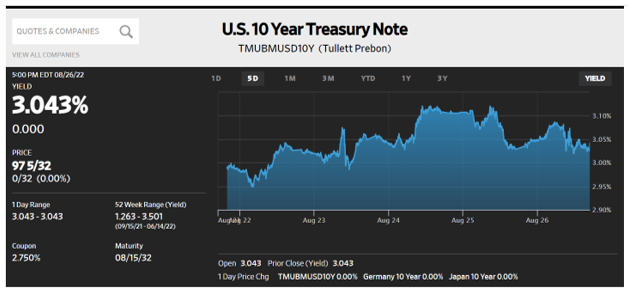
Reports
A mixed bag of economic data that showed continued weakness in housing, with slight improvement in 2Q2022 GDP and the Fed’s inflation gauge.
- New Home Sales were below consensus and Existing Sales declined 1%
- Durable Goods disappointed at 0% with a forecast of +1%
- 2Q2022 revision improved slightly to -0.6% from the earlier estimate of -0.9%
- - Real disposable income increased 0.3% and PCE declined y/y to 6.3% with core PCE declining to 4.6%
The Week Ahead
Fed speak continues, a very light week for Treasury and reports.
Monday – Treasury sells $105B 13 & 26-week Bills
Tuesday – Case Schiller Home Price Index, Consumer Confidence
Thursday – ISM Manufacturing Index expected to be flat
Friday – Non-Farm Payroll expected to be 325,000, Factory Orders forecast at 0.3%
August 22, 2022
Mixed Signals
Stocks snapped a streak of four weeks of gains which are being identified as a bear market rally from their June lows and longer term Treasury rates rose as the 2/10 curve steepened, though still at a negative spread.
Driving price action is the guess for what the Fed will do at the end of its September 20-21 meeting while it continues to analyze data, like these recent reports:
- Inflation is possibly easing, based on the last CPI report
- Weaker commodity prices
- Weak Chinese data that prompted the Peoples Bank of China to cut interest rates last week
- Industrial Production reported above consensus at 0.6% with manufacturing output at 0.7%
- Retail Sales were flat in July after the June report was revised down to 0.8% and this is the report that sent stocks lower, even with gas prices declining $1 a gallon in a month that spending at gas stations fell 1.8%
- Reflecting higher mortgage rates existing home sales fell in July, as they have every month since February
Release of the FOMC minutes from the July meeting last Wednesday point to more aggressive rate increases and seems to have been what sent the ten-year rate higher while this Friday’s release of the Fed’s preferred inflation gauge (PCE) and Person Income could support reduced inflation and steady wage gains.
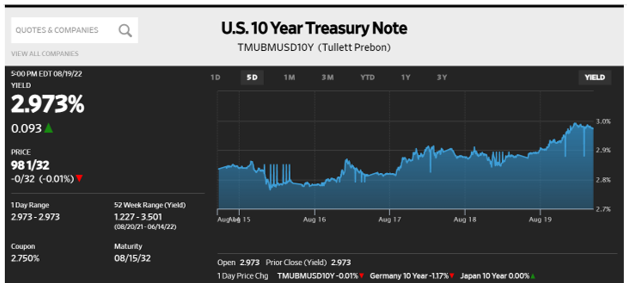
Having already raised rates by 225 bps speculation increases about another 75 bps hike while market participants look not just to further rate increases but the timing of that policy reversing course. This FRB St. Louis chart shows how that 2/10 curve has reacted to tighter Fed policy, shifting from +86 bps on 1/03/2022 to end last week at -27 bps, in from -41 bps the week before.

SBA 504 Program
As the program approaches the end of its 2022 Fiscal Year the 504 program has already reached record levels, starting with a 15% increase in approved loans that has resulted in $6.6B in funded debentures with an average 25-year rate of 2.88%, vs. an average ten-year Treasury rate of 2.25%.
The Week Ahead
More Fed speak, an active Treasury calendar, more housing data, and Friday’s Personal Consumption Expenditure report, after which there is a scheduled Fed Chair speech.
Monday – Treasury sells $105B 13 & 26-week Bills
Tuesday – Treasury sells $44B 2-year Note, PMI Composite flash expected to show a gain, New Home Sales expected to fall further
Wednesday – Durable Goods forecast is 0.6%, Treasury sells $22B 2-year FRN and $45B 5-year Notes
Thursday – 2Q GDP expected to be -0.5% and Treasury sells $37B 7-year Notes
Friday – Personal Income consensus is unchanged at 0.6%, Core PCE expected to decline to 0.3% and be lower at 4.7% y/y, Chairman Powell speaks
August 15, 2022
The August 2022 SBA 504 debenture offering was conducted during less volatile market conditions resulting in 3.65% and 3.80% debenture rates for the 20- and 25-year classes, respectively. The past several months’ offerings resulted in fairly stable debenture rates. As we wrote last month, simply referencing the little-changed 10-year Treasury yield and debenture rates the last few months, however, misses much about financial market moves during this very difficult bear cycle in interest rates.
The chart below shows the 10-year treasury yield when the debenture rates were set for the past three sales. We see a gentle decline. But look at the range of the 10-year treasury yield over that time frame – roughly 2.5% to 3.5%. Some of those sharp changes occurred during the debenture offering window, such as the move downward to 2.67% after the CPI release last Wednesday morning followed by a complete retracement-plus up to 2.90% on the next (debenture pricing) day. In another example, in June yields rose sharply, almost one-half point just days after that pricing.
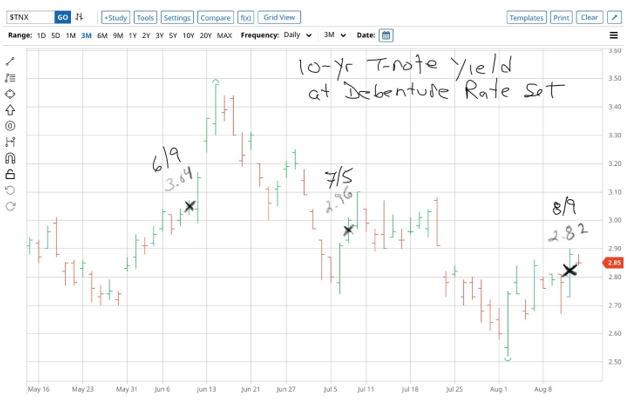
All told, we remain relieved CDCs and their borrowers experienced fairly stable interest rates and spreads over the past several months. There's really no way to reasonably guess what interest rates will be in a month except we can be confident they will probably swing a lot. Other good news this month was a return, the first time since January, to 504 loan effective rates below the Prime rate as seen in the chart below:
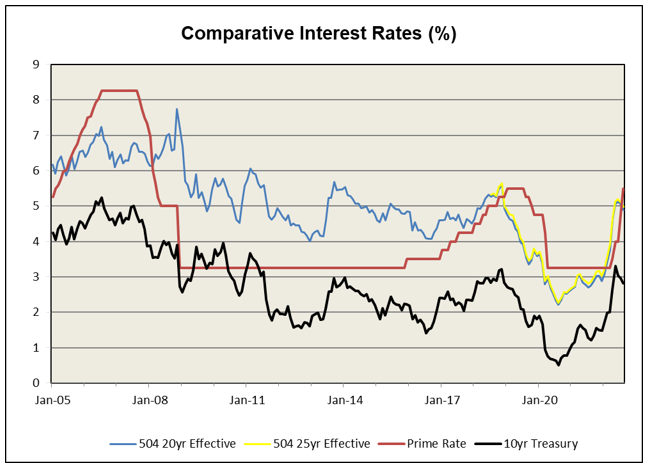
The week ahead is fairly quiet on the calendar. Below are the most important releases scheduled:
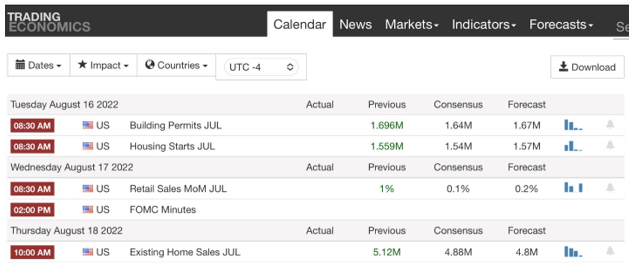
August 8, 2022
Stroger Jobs Data
The debate has been how high does the Fed raise rates vs. how quickly they reverse course depending on how strong the economy recovers while inflation trends down toward its 2% target. Friday’s jobs report of 528K was double expectations and supports the view the economy and wage growth are strong. Wage gains were also above forecast at 0.5%, raising their y/y total to 5.2%. Such gains also increase worries that inflation can remain persistent and require more forceful action from the Fed, something the rates market seems to be discounting.
After 225 bps of rate increases the market expects another 125 bps with a possible third consecutive 75 bps hike in September, something Chairman Powell said “could be appropriate” during his July press conference.
Unemployment hit a half century low of 3.5%, a rate also seen prior to the pandemic in March 2020 and far below the 5% rate that economists consider to be full employment.
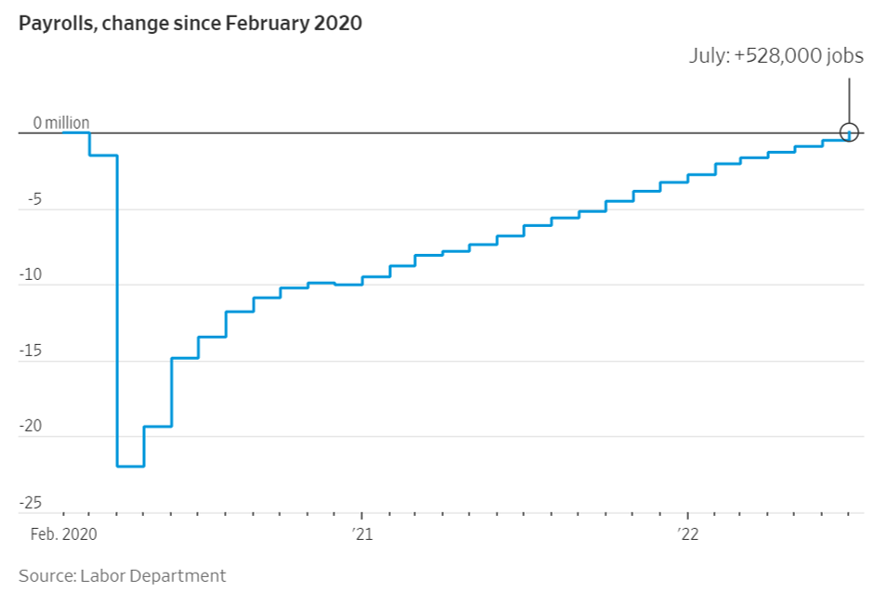
Stronger Inversion
It is no surprise that short-term rates rise faster than long-term rates with a hawkish Fed and last week’s market performance was true to form. The benchmark ten-year Note rose 16 bps to end the week at 2.83%, 13 bps lower than when the 504 program priced its July debentures. As seen in this FRB St. Louis chart the 2/10 Treasury curve inverted to -41 bps, dramatically changed from April 2021 when the Fed Funds rate was 0.125% and the spread was +153 bps. Of more importance for this week’s debenture pricing is the 7/10 Treasury curve was unchanged at -7 bps as that part of the curve has remained stable during the last two rate increases.
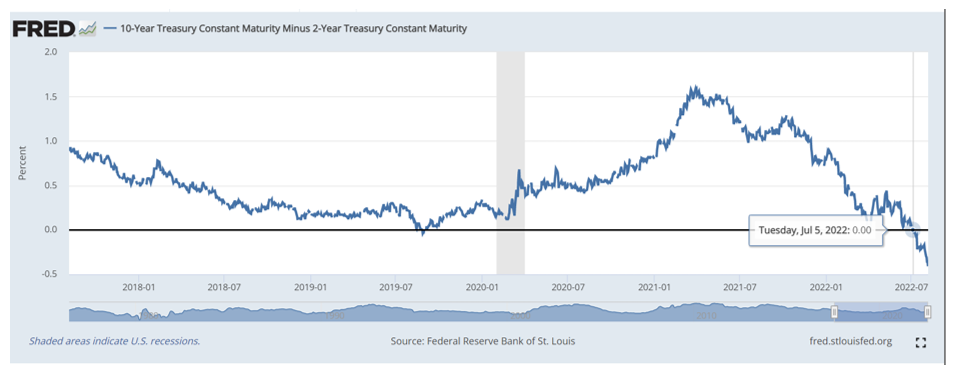
Reports
Factory Orders declined in July to its lowest reading since June 2020 while the ISM price index dropped 18.5 points, its steepest decline since June 2010 as prices of raw materials declined as supply chain disruptions are easing.
With oil trading below $100 per barrel gas prices have declined for seven consecutive months, reducing gas prices to $4 a gallon.
The Week Ahead
The SBA 504 program prices its August debentures, more Fed speak, and an active Treasury calendar.
Monday – Treasury to sell $105B 13 & 26-week Bills & $42B 26-week Bills
Tuesday – The 504 program announces its debenture sale, Treasury sells $42B 3-year Notes and $34B 52-week Bills
Wednesday – CPI expected to be 0.3%, Treasury sells $35B 10-year Notes
Thursday – The 504 program prices its 20 & 25-year debentures, PPI forecast at 0.2%, Treasury sells $21B 30-year Bonds
Friday – U. of Michigan Survey of Consumers
July 25, 2022
This week we step back a bit and provide a summary of the bigger picture and factors affecting 504 debenture rates.
Overview. In recent months yields in the bond market have gyrated sometimes wildly in reaction to very quick changes in expectations for economic growth, inflation and monetary policy. Most recently, the TIPS-based expected inflation rate came down to approximately 4.5% in a year, and 2.5% over 10 years. Leading indicators of economic growth recently pulled back, and included a broad decline in purchasing managers activity across developed economies. An increasing number of economists and investors expect a mild US recession next year.
Monetary policy. Not too long ago the market built in high expectation of a one-point increase in the Fed funds rate this week, where it had been just a ¾-point expectation. The ¾-point hike is again the odds-on bet for this week’s FOMC decision. The market currently prices a 3.5% fed funds rate at the end of this year with the FOMC commencing to cut the Fed funds rate starting around the middle of next year. Reduction of the Fed balance sheet started in June and includes selling an increasing amount of MBS, which has added pressure on spreads in mortgage related products like the debenture pools. The market expects this balance sheet reduction to end around the same time the Fed starts rate cuts in the middle of next year.
Bond market conditions. There were some mighty bond bear markets in the ‘70s and early ‘80s and it certainly looks like this bear market as is least as bad as those. Very few investors in the bond market have been through such a difficult bear market. Volatility remains high as there is great uncertainty in the outlook for the economy and monetary policy and inflation.
Orderly adjustment so far. Thus far, however, there has not been the collapse of a major leveraged player in the market, such as Long Term Capital in 1998. For such a bad bear market it has in general been orderly, but the collapse of a major player would stimulate short-term panic. There already have been massive outflows from bond funds. The Fed is steadily shrinking its balance sheet which means it is a net seller of Treasuries and MBS. Treasury market liquidity is thinner. The Fed, however, now has permanent facilities to prop up the money market in an emergency and prevent a freeze up in a crisis, as spectacularly seen in 2008, and this is supportive to fragile market psychology.
Factors Affecting 504 Debenture Rates
Level of interest rates. The 10-year T-note yield has a center of gravity of around 3%, a level that has attracted more investor interest. As the coupons increased to about 4% on the 504 debenture pools, yield buyers such as insurance companies have shown more interest.
Interest rate volatility. Actual and expected volatility are measures of uncertainty and fear and greed in the market. Interest rate volatility remains very elevated this year, reflecting great investor uncertainty and caution in the economic and monetary policy outlooks. During the July 504 debenture sale the level of expected 30-day price volatility based on Treasury options prices was in the same neighborhood as witnessed when Bear Stearns failed (March 2008), around 9/11, and when Enron collapsed (November 2001). Since the May offering the 10-year T-note yield has fluctuated, sometimes wildly, in a 2.70% to 3.50% range.
Yield curve shape. The yield curve shape matters for the relative value of the 504 debenture pools. It is mostly inverted with the two-, three-, five- and seven-year Treasury yields now above the 10-year yield. This required additional spread over 10-year Treasury pricing benchmark to sell the debenture pools. An inverted yield curve caused bank buyers to reduce their presence in the offerings. Bank buyers are typically the largest buyers in the debenture pools, and insurance companies and money managers have stepped in at higher coupons and wider spreads to replace bank demand.
Relative value. The debenture pools were priced at a rate below Treasury yield in May of 2021. The curve was extremely steep, volatility was low, and spreads were tight on competing products. The exact opposite is the case this year, and to place the pools required a widening of the spread to 10-year Treasury on the 25-year debentures from about flat to nearly a point above. This level returned the debenture pools to an attractive value, and money managers came in to replace the bank buyers that have pulled back due to the inverted curve.
Relative supply. The 504 program is on track to issue roughly $7 billion of debentures this fiscal year which is double what it used to be just a few years back. A $500 million offering used to be a record, now it's common to have $600 million and even $800 million offerings. This has required a marginal amount of extra spread offered over Treasury. The supply has been absorbed smoothly and the buyer base remains well engaged even with the pullback of bank investors. For example, in the July sale there were twenty investors in the 25-year pool.
July 18, 2022
The July 2022 SBA 504 debenture offering was conducted during more volatile market conditions. Simply referencing the little-changed 10-year Treasury yield and debenture rates the last three months misses much about financial market moves during this very difficult bear cycle in interest rates.
Development companies and small business borrowers, after the sharp rise in interest rates this year, may not feel this way but they have been relatively fortunate to have stable debenture rates the past few months given the historic nature of global interest rate volatility. Let's take a look at this in a picture.
The chart below shows the 25-year debenture rate and the 10-year treasury yield for the past three sales. We see relatively little change. But look at the range of the 10-year treasury yield over that time frame -2.7% to nearly 3.5%. And some of those sharp changes occurred right around debenture pricing. For example, as we commented in the June memo, interest rates rose sharply, almost one-half point just days after that pricing. And just this past month there was a nearly 15 bps rise in the 10-year treasury yield from pricing on July 7 to the close on the next business day. The luck conceivably could have swung the other way with materially lower debenture rates if they had been set when the 10-year treasury yield was around 2.75%.
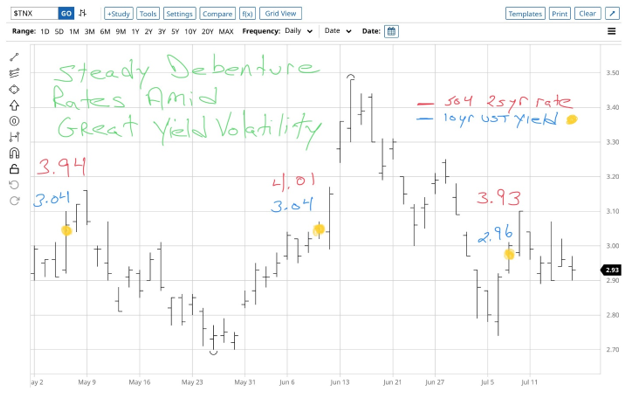
All told, we are relieved the borrower saw fairly stable interest rates over the past couple of months. There's really no way to reasonably guess what interest rates will be in a month except we can be confident they will probably swing a lot.
What is a lot? There are few ways to answer that question. One useful way is to look at market-based expectations of how much treasury yields will fluctuate per day over the next month. That measure of expected volatility can be derived from the pricing of options on treasury futures and is captured in a useful measure called the MOVE index. We can roughly approximate the yield basis-point equivalent given a MOVE index level.
During the offering this month, based on the MOVE level, investors expected treasury yields to fluctuate by roughly 10 bps per day, about two-thirds of the time, over the next month. For some historical context that's the same level of expected volatility that existed around the time Bear Stearns failed in March 2008 and the 9/11 attacks and Enron collapse in 2001. If we look back a year ago, expected daily treasury yield volatility a month ahead was four basis points, just 40% of the recent level.
Elevated volatility has been persistent for much of this year, something that with the flattening yield curve contributed to much wider spreads over treasury for SBA and other mortgage products. The MOVE is a good measure of bond market uncertainty, not just fear (similar to the VIX). Drawing investors into an offering at stable spreads over treasuries the past few months is something with which we are pleased.
We do not expect it to be less challenging anytime soon, in fact as we write this the market has built in good odds for a full point hike in the federal funds rate at the FOMC meeting in just a few days. In early June there had been stable expectation for a half-point hike in July. For further historical perspective, since the FOMC started using the federal funds rate as the primary benchmark interest rate for monetary policy, the central bank never hiked it one full point at one meeting.
July 11, 2022
First Things First
On Thursday the SBA 504 program priced what has become a normal sized debenture sale totaling $597 million which approximates the average monthly total this fiscal year. At a rate of 3.93% the 25-year issue was priced 8 bps lower than in June and represents an ongoing effective rate of 5.11% for small business borrowers. Aided by a 27% increase in approved loans y/y, with their average size approaching $1MM the program is on track to issue $7 billion debentures in FY2022, a significant jump from its previous high of $5.5B in FY2020. Part of this surge is being helped by increased activity in Debt Refinance that contributed $282.4M in the just completed quarter.
What is most impressive about this month’s sale was that both the 20 and 25-year debentures were sold at the same pricing spread to Treasuries as in June even though credit spreads had widened, and volatility remained high. The program’s Selling Agent, Steve Van Order, reported the Underwriters managed a book that contained a solid mix of investors that continue to support the program. This chart shows the sharp drop off in volume in the wake of the record September 2020 debenture sale, but also shows how this year’s record volume ($5.9B to date) has recovered as rates have risen.
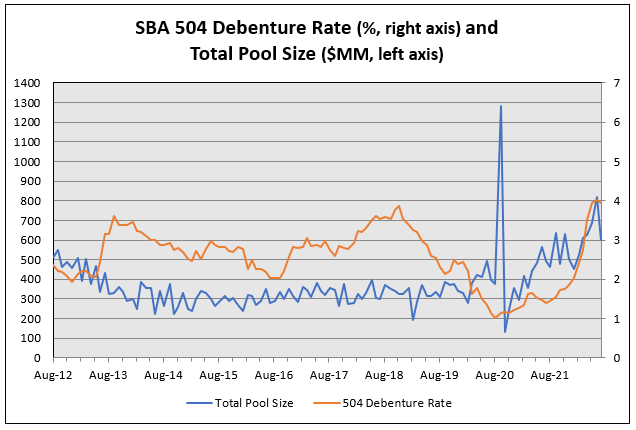
For the second consecutive month the 504 program had fortuitous timing as the rates market bounced around, though not as much as in June. Last week saw the ten-year benchmark trade as low as 2.82% when the sale was announced on Tuesday, sat at 2.98% for pricing, then moved higher to close the week at 3.08% after Friday’s jobs report.
That increase of 372,000 was above consensus, extending a streak of strong gains despite a slowing economy and possibly convincing analysts there will be a second 75 bps rate hike on July 27th.
Slippery Slope
In anticipation of this month’s continued tightening the slope of the 2/10 Treasury curve inverted on Wednesday, closing the week at -3 bps since the impact of this policy will be felt most in shorter-dated Treasuries.
As shown in this FRB St. Louis chart the changing spread is significant, changing from +151 bps on 4/9/2020 when the 504 program priced 2020 25D at 1.77% to last week when the spread was -3 bps and 2022 25G was priced at 3.98%. The change represents 150 bps of rate hikes by the Fed, with more to come.
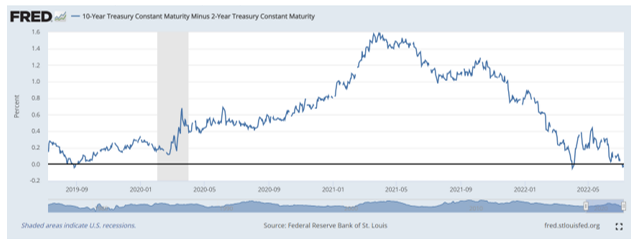
Reports
- Factory Orders were up 1.6% vs. a forecast of 0.5%
- Consumer Credit in May rose less than expected to $22.3 billion, similar to a recent decline in consumer confidence
- Wednesday’s release of the minutes from the June 15 FOMC meeting reaffirmed the Committee’s commitment to reining in inflation and a strong labor market justifies that stance, especially with high expectations for this week’s inflation reports
The Week Ahead
Fed speak, an active Treasury calendar, and the 504 program funds its July debenture sale.
Monday – Treasury sells $105B 13 & 26-week Bills and $43B three-year Notes
Tuesday – Treasury sells $34B 52-week Bills and $33B ten-year Notes
Wednesday – 504 program funds its July sale, Treasury sells $19B thirty-year Bonds, CPI forecast at 8.8%
Thursday – PPI consensus is 10.4%
Friday – Retail Sales expected at 0.9% to reverse -0.3% in May
July 5, 2022
Policy vs. Perception
This three-month chart of the benchmark ten-year Treasury Note shows how it reacted to the Fed’s 75 bps rate hike in June, with expectations of trending higher still as a similar hike is expected in July. Since touching 3.50% on June 14 the Note rate has steadily declined, ending last week at 2.89%, 15 bps below where the 504 program priced both its May and June debentures.
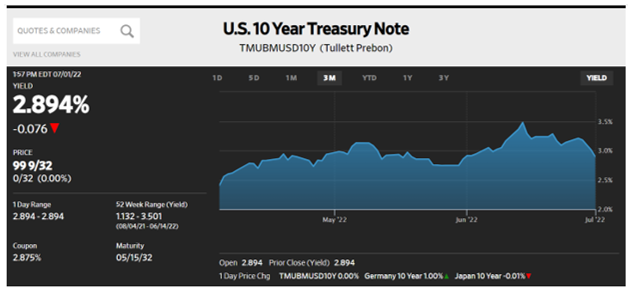
Fed policy was clearly stated by Chairman Powell on Wednesday when speaking on a panel hosted by the ECB, he restated the central bank “is very strongly committed to getting inflation down.” That is the policy portion of this week’s header, the fact that ten-year rates are lower by 20 bps since that statement and 61 bps since the Fed’s last meeting represent the perception that continued rate hikes will push the economy into recession. With the Fed Funds rate currently in a range of 1.50%-1.75% and with expectations it will increase another 150 bps by March of 2023 the market seems to be anticipating a change in policy with fewer rate increases as the bank reacts to a weaker economy and a lower inflation rate.
Obviously, there are a lot of ifs in such a scenario so a Fed policy that is data driven will determine if it stays the course or adapts to a softer stance. Prior to the post ECB panel move in rate Mr. Powell added “it is constructive when the market is doing your work for you” when they correctly interpret policymakers’ guidance. It remains to be seen if lower rates are in line with that leadership.
Reports That Mattered
- With the Fed committed to significant rate hikes the ECB proposes a modest 25 bps hike in July to combat Euro Zone inflation at 8.6%
- Consumer Confidence was sharply lower at 98.7 vs. a forecast of 101
- Orders for Durable Goods exceeded a 0.2% forecast with a 0.7% report
- Personal Income was 0.5% as expected, while PCE, the Fed’s preferred inflation gauge was slightly lower at 0.6% monthly and 6.3% y/y
- The Institute for Supply Management report on Friday helped culminate the rate rally, declining to a reading of 53 from its previous level of 56.1. This reflects the supply chain disruption that if resolved, could help central bankers if it helps cool price pressures and reduces inflation.
- The price of copper declined to $8,000 per ton for the first time in 18-months, an indication of reduced demand for a product widely considered a gauge of economic activity because of its use in so many household appliances. This decline is similar to that of other raw materials whose prices have slumped recently, giving some investors hope that efforts to slow demand, and inflation, are working.
- One place inflation is not slowing is Turkey, where it was recently reported at 78.6% y/y
The Week Ahead
SBA 504 program prices its July debentures, Fed speak, a very light Treasury calendar, and the jobs report.
Tuesday – SBA 504 program announces its July sale, Treasury sells $105B 13 & 26- week Bills, Factory Orders forecast at 0.5%
Wednesday – ISM report on PMI forecast at 54.9, Minutes of FOMC 6/15 meeting
Thursday – SBA 504 program prices its July debentures
Friday – Non-Farm Payroll estimated at 250,000
June 27, 2022
Impact of Recession Fears
Longer term Treasury rates reversed course, commodities cheapened, and stocks had their best week in a month; all very confusing. All of this is taking place with markets expecting another 125 bps of short-term rate increases by year-end, but with more expectations of job losses and a probable recession. That creates a possible scenario of the Fed easing back on further rate hikes next year to avoid a hard landing for the economy, but that is at odds with economists who believe a higher unemployment rate is needed to reduce demand that is driving the economy and inflation. This paradox of higher rates vs. a premature softening of the Fed’s hawkish policy is what creates confusion in markets that have declined sharply this year. Inversion of the 2/10 Treasury curve is a likely result, a change from its current spread of +8.4 bps that is much tighter than its spread of +86.2 bps on January 3.
Into this mix comes a statement from the Bank for International Settlements that central banks need to raise rates sharply to avoid a spiral into 1970’s like inflation, reflecting concern that inflation is not reacting to existing measures, especially in lesser developed countries.
Rates
This WSJ chart shows how the benchmark ten-year Treasury Note reversed course after trading as high as 3.50% the previous week. At 3.14% it sits just 10 bps above where the 504 program has priced its last two debenture sales, an indication of both its volatility and eventual stability.
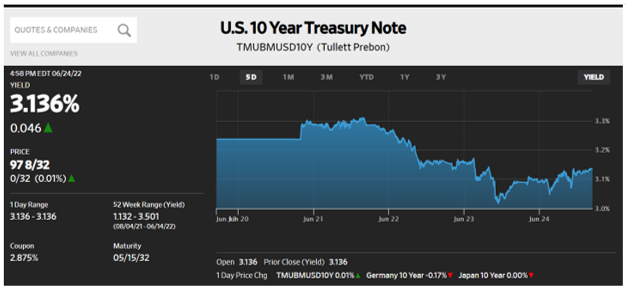
Stocks
Stock prices showed strength after Chairman Powell’s mid-week testimony identifying the improbability of a soft landing for the economy. That statement acknowledged the risk of raising rates to curb inflation without pushing the economy into recession, meaning perhaps the Fed would not raise rates as high as expected, a sentiment that is at odds with the need to reduce demand to lower inflation. For the week, the Nasdaq composite gained 7.5%, its best gain in over a month.
Impact of Higher Rates
This WSJ chart shows how 30-year mortgage rates have increased this year from 3.02% to 5.85%. Its immediate impact shows up in existing home sales declining by 3.4% monthly and 8.6% y/y. This reverses the more affordable environment for homebuyers the last two-years as rising prices in a market with light inventory were offset by historically low mortgage rates. The median existing home sale price has risen 14.8%, pushing it to $407,000, a record even when adjusting previous years for inflation.
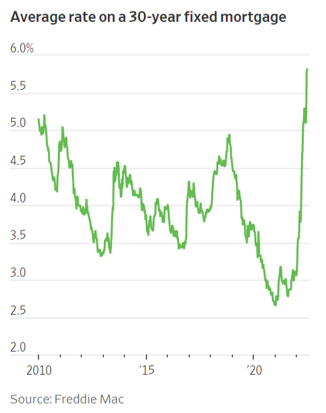
The Week Ahead
A heavy Treasury calendar early in the week, Chairman Powell speaks, and the Fed’s favorite inflation gauge.
Monday – Treasury sells $105 billion 13&26-week Bills. $46 billion 2-year Notes, and $47 billion 5-year Notes, Durable Goods expected to be +0.2%
Tuesday – Treasury sells $40 billion 7-year Notes
Wednesday – Jerome Powell speaks, 1Q2022 GDP forecast at -1.5%
Thursday – Personal Income & Expenditures with PI forecast at 0.5% and unadjusted PCE expected to be 0.7% and 6.5% y/y
Friday – Early market close
June 20, 2022
Central Bank Smorgasbord. Last week featured important actions by major central banks. The Fed lifted the target Fed funds rate by 75 bps, the extra 25 bps boost versus expectation was due to the bad CPI data released on Friday the 10th. Markets had quickly pushed Treasury yields sharply higher and the curve flatter and set the stage for the larger rate hike.
Of at least similar importance to the rate hike was the official kick off of quantitative tightening (QT). The Fed now will reduce the amount of maturing Treasuries and paid-down agency MBS it will rollover in its massive portfolio. An important reason mortgage-related spreads have widened (including for SBA debentures) is because the Fed will buy a lot less MBS going forward. The shock higher in mortgage rates, however, has finally hit new and refi mortgage production so the supply has slowed.
At the May meeting, the ECB had signaled a 25 bps rise at the next meeting, yet convened an off-calendar meeting last week to address the cracking wider of spreads in the debt of Italy and other fiscally troubled euro area members. The “anti fragmentation” tool announced is a plan for the ECB to roll over maturing euro government debt in its massive portfolio with a heavier mix of the lower-quality euro area issuers such as Italy. Clearly the ECB is still spooked by the euro crisis of a decade ago. It reminds of how quickly the Fed was to reopen crisis-era facilities such as TALF in 2020 as credit markets started to freeze over, while it cut policy rate to zero. But in this inflationary cycle, the ECB will raise the policy rate yet try to defend the spreads of weaker government debt issuers. This will be very interesting to watch.
The Bank of England made its fifth quarter-point hike in a row as it creeps rates higher. The widespread repercussions of Brexit has the UK in an additionally weakened condition versus other major economies in this inflation cycle.
The Bank of Japan is under pressure to raise the yield cap on its Japanese government bond purchases. It is the lone hold out of the major central banks in reducing monetary accommodation.
Review of June SBA 504 Debenture Offering. The June 2022 SBA 504 debenture offering was conducted during briefly less volatile market conditions. Simply referencing the m/m unchanged 10-year Treasury yield and +7 bps change in the debenture rates missed pretty much everything about financial market moves the past month during this very difficult bear cycle in interest rates.
Our annotated chart below captures this action in one picture. We note the Treasury yield and 25-year debenture rate for May and June in red and green, respectively. Look at everything surrounding those marks. After the May 5 debenture pricing, by May 25 the ten-year yield fell 34 bps to 2.70%, then it gapped upward and rose steadily, and finally exploded upward to hit 3.49% on June 14. The move from 2.70% to 3.49% occurred over just three weeks.
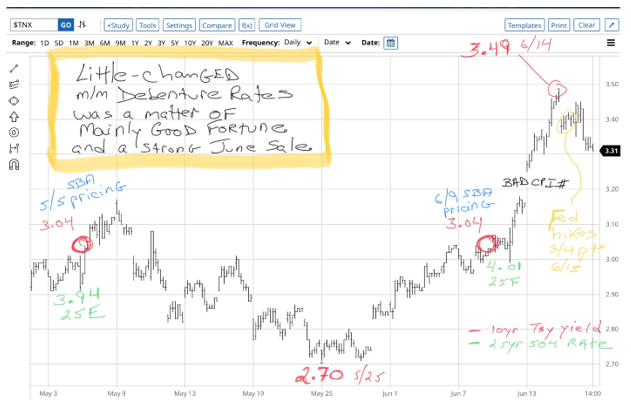
Had the deal been priced on Friday the 10th, a day after scheduled, after the bad CPI release the debenture rate would have been at least one-third percentage point higher than actual. If the deal had been priced three trading days later than scheduled, on the 14th, the debenture rate would have been over a half-point higher than actual. These persistent head-snapping yield moves are something the majority of bond market participants have never seen. By some measures, US interest rates are on track for the largest calendar year increase since 1981.
We note in the highlighted area on the chart above that we were fortunate to have had the market window we had, and a strong investor response, to result in the little-changed m/m debenture rates. The brief window of lower volatility during the June sale resulted in some of the most robust demand from investors in a year which was fortuitous as the offering was the second largest on record at $820 million.
Looking ahead that seeming brief break in rate volatility was fortunate yet very illusory. The 75 bps hike by the Fed on the 15th at least got markets used to the idea of 50-75 bp hikes in coming months. Markets will remain very challenging, with high price and yield volatility, for the foreseeable future.
The US economic calendar for this week is light with second-tier data releases.
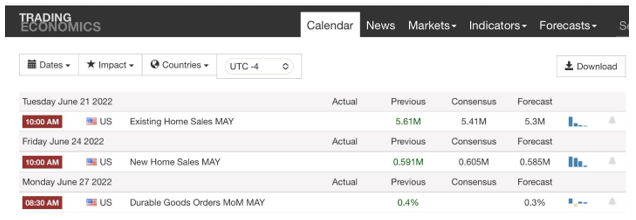
June 13, 2022
Curve Explosion
In response to Friday’s CPI report showing an annual inflation rate of 8.6% the rates market moved ahead of next week’s Fed action and closed the week higher with a sharply flatter yield curve. The benchmark ten-year Note closed at 3.16%, up 21 bps on the week and 12 bps higher than when the SBA 504 program priced its debentures on Thursday.
More dramatically, the measurement of the 2/10 curve narrowed to +9.2 bps from 28.6 bps on June 3, and from 86.2 bps on January 3. That is typical when the Fed is raising short-term rates and that is what they are expected to do Wednesday at the conclusion of the FOMC meeting. Another 50 bps increase is widely expected in July and now a third 50 bps hike is speculated for September.
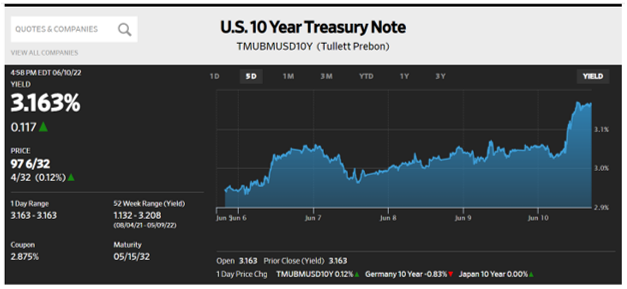
Inflation
The CPI report sent rates higher, and stocks lower, with the Nasdaq down almost 7% on the week. It is energy that is pacing the inflation surge, up 34.6% Y/Y and while sanctions on Russian oil offer a partial explanation for the spike, domestic policy focusing on green energy is a contributing factor and oil will remain expensive as long as OPEC is reluctant to increase production during Russia’s siege of Ukraine. Supply chain disruptions remain in place and surging prices complicate the Fed’s approach to inflation and job growth.
Funding
Of importance to the 504 program was Thursday’s second largest debenture sale that was well received as the program copes with a 106 bps rise in Treasury rates since its March sale and investors know that more rate increases are planned, meaning it is a challenge to market the securities each month when higher rates are expected. Steve Van Order reported this sale of $820.8M DCPC’s was very strongly marketed by the Underwriters, permitting a tighter pricing spread than initially sought. Account participation was robust and that is key for a program dealing with rising rates while on track to record $9 billion in approved loans for FY2022; meaning a record year for debenture sales which require as much investor participation as possible.
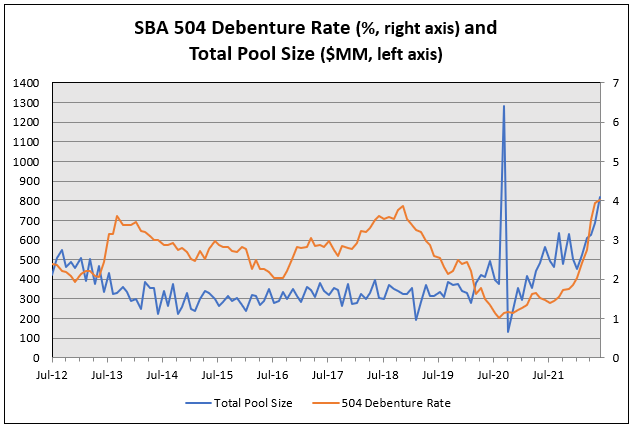
Reports
It was all CPI as it exceeded its 8.2% forecast and since energy represents a 34.6% increase Y/Y and food 11.9%, no one seems interested to hear that ex food & energy the increase is lower at 6%. Gasoline has hit $5 a gallon and shows no sign of declining. All this takes place as the Fed tries to balance raising rates to cool inflation while avoiding a recession, something that analysts believe is unavoidable.
Mortgage Applications Cool
The Mortgage Application index fell to its lowest level in twenty-two years as applications fell by 6.5%, its fourth consecutive decline. Refi and Purchase activity fell by 6% and 7% respectively as 30-year mortgage rates are 5.09% vs. 3.2% at the beginning of the year.
The Week Ahead
The FOMC meets Tuesday and Wednesday with its interest rate decision that afternoon, the 504 program funds its June sales on Wednesday, a light Treasury calendar, and PPI is released on Tuesday.
Monday – Treasury sells $105 billion 13 & 26-week Bills
Tuesday – PPI expected to be 0.8% and 11% Y/Y: FOMC meeting begins
Wednesday – 504 program funds its June sales, FOMC announces its interest rate change, Jay Powell press conference, Retail Sales forecast at 0.1%
Thursday – Jobless Claims expected to remain around 220K
Friday – Industrial Production consensus is 0.4%
June 6, 2022
Reversal
After trading as low as 2.75% to close out the previous week, the benchmark ten-year Treasury is back within 10 bps of where the 504 program priced its May debentures. This move comes as the market prepares for another 50 bps rate hike at the conclusion of the FOMC meeting on June 15 and another increase the following month.
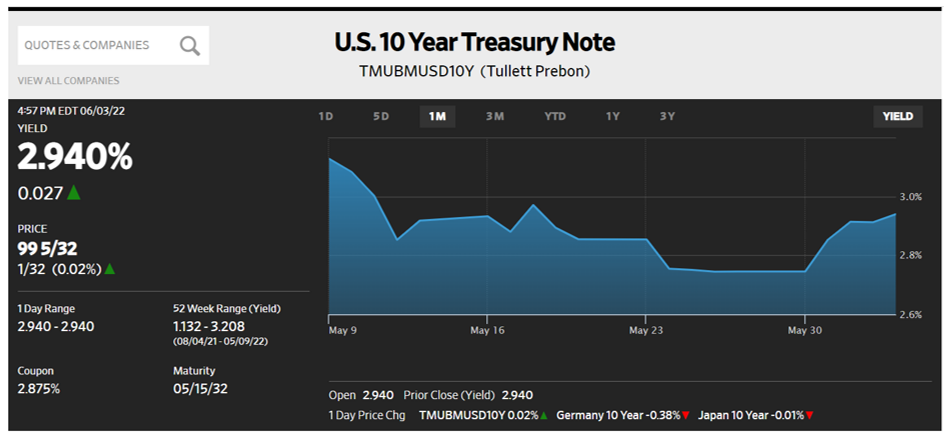
Both of those moves seem to be conceded and Friday’s slightly stronger than consensus jobs report satisfied analysts the economy is on track while allowing the Fed to focus on its battle with inflation. At 390,000 the jobs report was 65,000 above consensus while the unemployment rate was unchanged at 3.6%. Average hourly earnings were reduced at 0.3%, continuing a deceleration that leaves workers playing catch up to an elevated inflation rate.
Shortages
Supply chain disruptions persist for baby formula in the US, among other things, and grain distribution from Ukraine where its Black Sea port remains blockaded by Russia. Alternative routes will permit only a fraction of the 20 million tons of grain to be shipped, which needs to be done to create space for storing this year’s harvest.
Friday’s report led stocks to give back Thursday’s gains and left the major indices slightly lower on the week as markets deal with crude oil shortages that have seen Brent crude rise by 50% YTD, with the prospect that it will hold this price level or go higher. Much of this spike is due to sanctions on importing oil from Russia while Saudi Arabia is reluctant to increase production because they believe there are not genuine shortages, and they want to properly manage their control of emergency increases of production.
If oil is trending higher so is the average national price for gasoline which hit $4.82 a gallon last week. Paying $100+ to fill your SUV adds up fast.
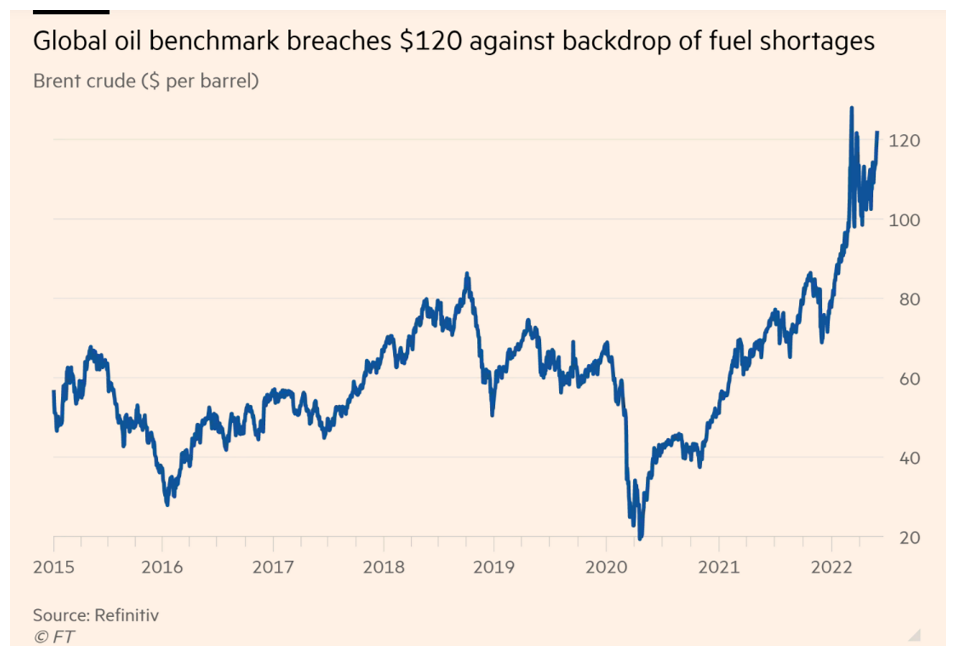
Hurricane Warning
Jamie Dimon, CEO of JP Morgan Chase stated consumers have 6 to 9 months of spending power left thanks to government stimulus, but warns inflation and shifting consumer spending patterns can slow the economy.
The Week Ahead
SBA 504 program prices its June debentures, no Fed speak during blackout period ahead of June 14-15 FOMC meeting, few reports though CPI is involved, the Treasury conducts its quarterly refunding.
Monday – Treasury sells $105B 13 & 26-week Bills
Tuesday – 504 program announces its June debenture sale; Treasury sells $44B 3-year Notes
Wednesday – Treasury sells $33B 10-year Notes
Thursday – 504 program prices its June debentures; Treasury sells $19B 30-year Bonds
Friday – CPI expected to be 0.7%
May 31, 2022
Rates and Stocks Both Rally
After trading at 3.04% when the SBA 504 loan program priced its May debentures twenty-six days ago, the Treasury market has rallied, shrugging off the recent 50 bps policy change. In the minutes released on Wednesday from the last FOMC meeting it was noted the Committee rejected a more “restrictive” policy stance as it was concerned about undermining the economic recovery and job growth.
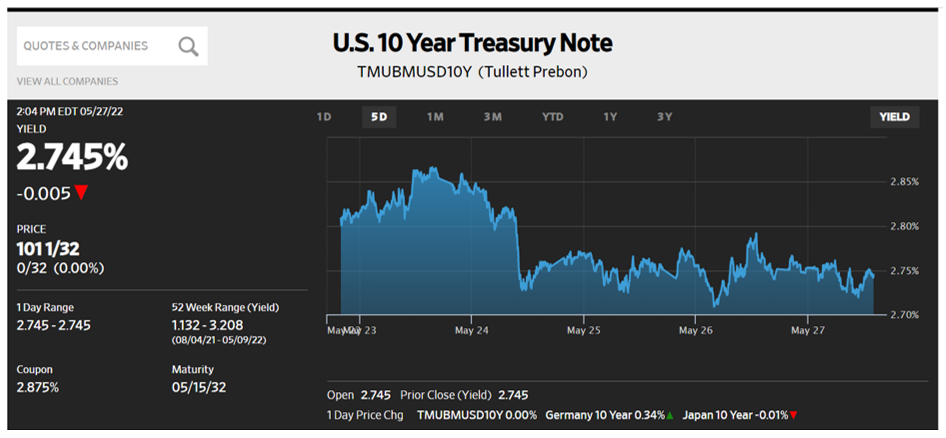
This decline in rate takes place as rate hikes by the Fed are expected at both their June and July meetings and have been matched by a widening of credit spreads as investors remain cautious about both the duration of their investments as well as credit risk.
Equities also have rallied with the S&P 500 index having its best week of the year, rescuing it from its flirtation with bear market territory. Strong earnings and economic data have provided optimism, helping to deflect the overriding concern about inflation. Helping to drive this rally was a $21 billion inflow into global equity funds last week.

Helpful Reports
Though consumers remain focused on the recent CPI reading of 8.3% in April the Fed’s preferred inflation gauge showed improvement in the core reading of Personal Consumption Expenditures, 0.3% and 4.9% Y/Y. These lower readings were supported by a CBO report projecting inflation at 4.7% in 4Q2022, dropping to 2.7% in 2023.
All of this may seem like a short-term rally in a long-term decline, but recent performances do offer some hope for the future even as the reality of increased Fed hikes, the Covid lockdown in Chins, and Russia’s invasion of Ukraine continue to snarl global economies.
Other reports last week showed Durable Goods orders declined slightly to 0.4% while the second estimate of 1QGDP was -1.5%.
The Week Ahead
A very light Treasury calendar, lots of Fed speak ahead of their June 14-15 meeting, and a key jobs report.
Tuesday – Treasury sells $105 billion 13 & 26-week Bills
Thursday – Factory Orders expected to decline slightly to 0.8%
Friday – Non-Farm Payroll forecast at 325,000, down from recent months, with the Unemployment Rate declining to 3.5% and average hourly earnings increasing to 0.4%
May 16, 2022
Swingin’ Yields Last Week. Last week longer-term Treasury yields declined in a welcome change from the fairly relentless rise this year. The move was rather large. We can see in chart one below that there was a 38-basis point swing from high to low last week. Sometimes liquidity can be ephemeral even in the Treasury market and this exaggerates yield moves. We discuss more on that towards the end of this commentary.
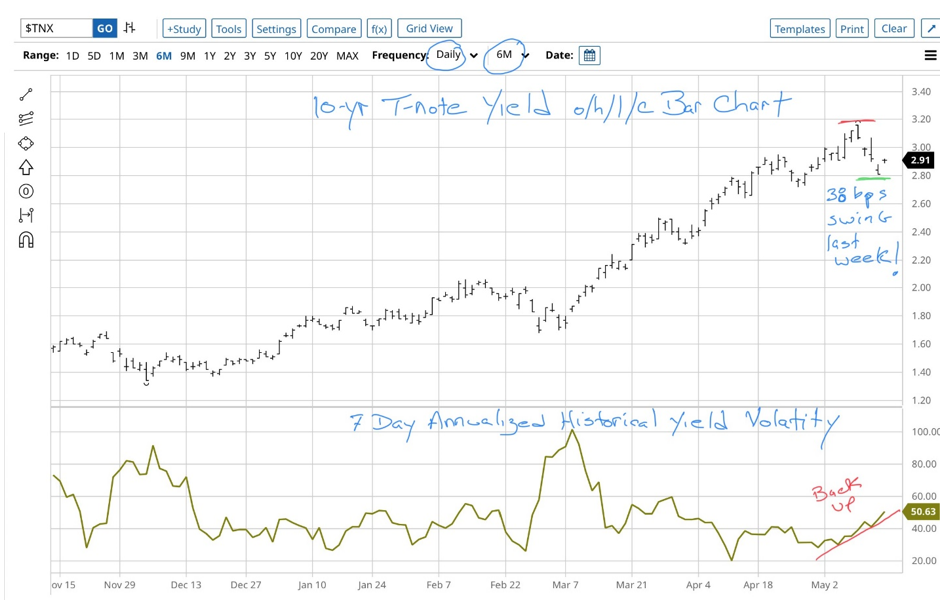
Inflation Remains High and is Getting More Sticky. The most notable piece of economic data was another month of over 8% y/y headline consumer price inflation rate. The Economist recently developed a useful index of inflation “stickiness” for a number of countries, and the Anglophone countries, US included, are showing the most increase in price inflation stickiness.
In the US case, we can look back to the Fed running a massive quantitative easing (QE) policy during repeated bouts of very large fiscal stimulus from the Trump and Biden administrations. The monetary and fiscal policymakers kept their accelerators down. Combined with pandemic-created supply chain bottlenecks that linger and linger, inflation is becoming more entrenched with various implications for consumption, supply, and political power.
It's easy to armchair quarterback after a Black Swan event like the pandemic. Ultimately, US fiscal and monetary responses from 2020 through 2021 helped the US perform better through the pandemic than most any other advanced economy. But now the piper has come to be paid via higher inflation that must be dealt with by monetary and fiscal tightening - that old “no free lunch” thing.
The Bond Bear Rules with an Iron Paw. Our commentary most often focuses on conditions in the interest rates market as related to their potential impact on SBA 504 debenture rates. An important part of our work is being aware of how bond investors are faring, as that affects net flows in the bond market. Suffice it to say, that on a year-to-date basis, bond investors have experienced some of the worst returns in many years.
In the chart below we see that, over the first five months of the year, the broad measure of the US bond market, represented here by the price of the leading Aggregate ETF, is down 11%. If you take a look at the notes on the chart you will see how this compares to the experiences in 2020 and 2008. Of interest, we can see that in the 2008 and 2020 examples, there was a blowout bottom (lowest red dash) in the Aggregate ETF price followed by a sharp upward bounce (green dots) by the end of the month in which that low share price occurred. No such pattern is present in the 2022 example.
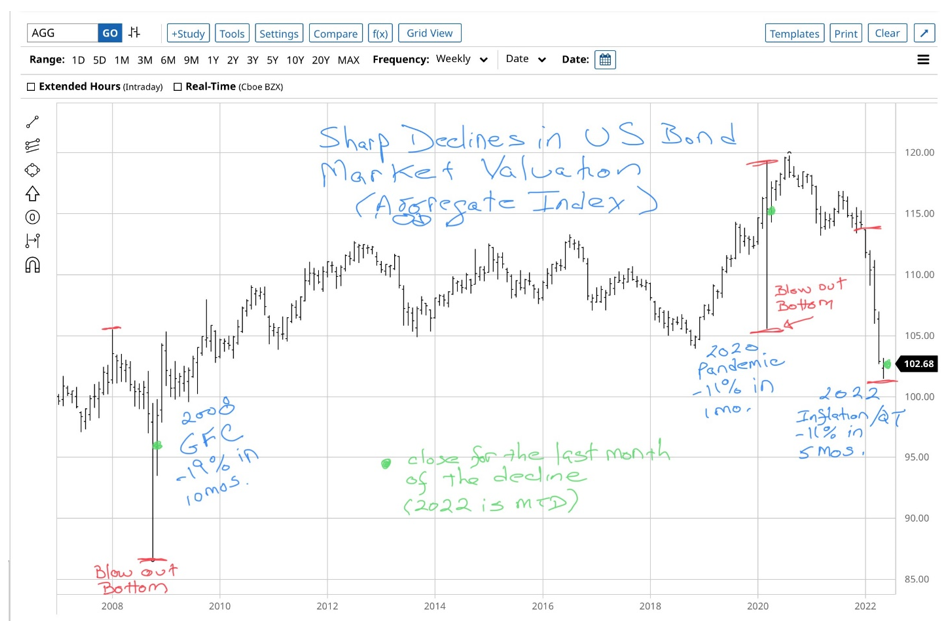
The reasonable interpretation is that in 2022 there well may be more negative total returns coming for bond market investors. The blowout bottoms in 2008 and 2020 were much or completely reversed by the Fed announcing additional (2008) or reopening (2020) market support facilities and what is now known as QE. And crucially, in October 2008, after a failed attempt, the TARP legislation passed which ended the existential threat to the US banking system.
But in 2022 the Fed is pushing rates up, not pushing them down, and is not propping up spread markets. We’re on our own folks. The development of high and sticky inflation and the Fed’s response by engaging in a tightening policy that includes rate hikes and balance sheet shrinkage (i.e., QT) is something the markets have not experienced before.
Now, bond funds are either in net redemption mode, or preparing for it, and that has an impact on supply and demand in the government, corporate, and resi and commercial mortgage securities markets. It’s one of a number of reasons the spread over Treasuries for the new SBA debenture pools has widened dramatically.
Liquidity. In 2022 the Fed is ending QE to immediately move into QT that has predictably broadly deflated financial asset prices. An area of trouble as this plays out clearly is crypto currencies, lately the stable-coin market. A cratering in that wobbly market would threaten the entire $3 trillion crypto market. How the knock-on effects in that scenario would play out is anybody’s guess but some impact(s) would be felt, potentially in far away markets. Emerging and junk bond market issuance has tightened up as returns plunged and investors retreated, a classic response to an aggressively tightening Fed.
Even the mighty Treasury market is suffering from increased bouts of illiquidity and regulators are working to expand the number of recognized market makers. The traditional Primary Dealers (now all structured as banks) have been regulated into a much smaller role than they had pre-2008. Automated trading platforms for Treasuries have not solved all issues with illiquidity. And money markets remain stressed from time to time as Treasury bill collateral, in particular, can be tight. As a result of the 2008 GFC, the Fed now is the permanent liquidity backstop for money markets.
Busy Data Calendar. We can see in the table below that this week there will be a lot of data released, but they are considered of second tier importance. Nevertheless, retail sales will be an interesting look at consumer activity, and industrial production may offer some insights on supply bottlenecks. The intersection of stubbornly high real estate prices with the sharp increase in mortgage rates is a key theme in the current cycle, so the housing data released will be of interest as well.
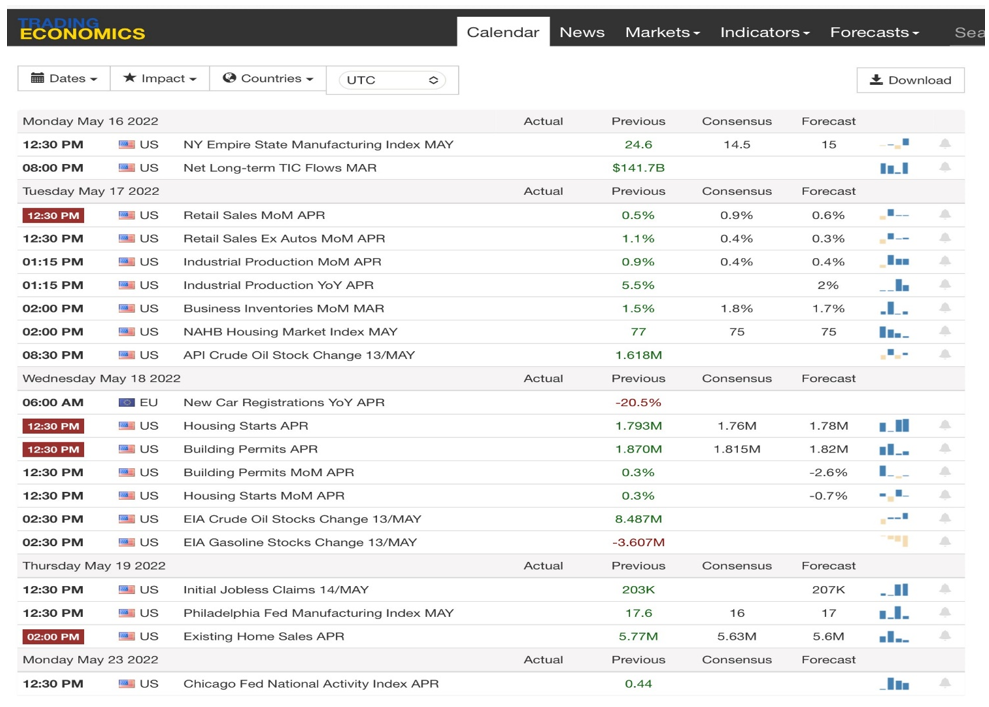
May 9, 2022
This Explains a Lot: Markets, until now, never traded during a time of high inflation with the Fed exiting quantitative easing and entering quantitative tightening
Keeping this sentence in mind will be helpful when trying to understand the extremely volatile and bearish markets that we are experiencing. At the root are monetary policy adjustments the Fed, and some other important central banks, have made – they plan to withdraw massive amounts of excess liquidity that has been sloshing around in the markets for some years now. Savers rates will increase as the Fed hikes the Fed funds rate, which may lead to continued reallocation of money away from riskier assets into safe harbors like money market funds and bank CDs.
From QE to QT. Markets are quite used to Fed rate hikes, it has always been the primary tool that the Fed used to effect monetary policy. Importantly, however, there was only one prior attempt by the FOMC to seriously shrink the balance sheet in the post-GFC (2008) era, so Fed and markets’ experience is thin. That attempt was halted by the pandemic. This new attempt will be to shrink on a larger scale and faster timeframe as the Fed faces inflation rates not seen since the 1980s. In June the Fed will start ramping up to an eventual $95 billion per month roll off of maturing treasuries and mortgage backed securities from holdings. The goal is an approximate $1 trillion reduction in balance sheet in a year. This net new supply will need be absorbed in the market, and that is one reason why there's already been a sharp increase in interest rates. This has played out especially the mortgage-backed market, which has a knock-on effect on the SBA 504 debenture pool rates (see the table below for some measurements).
By the end of the June sale, CDCs will have issued in nine months more debentures than issued in the entire 2021 fiscal year (i.e., $4.8 billion). From October through May, CDCs issued $4.5 billion of debentures, $1.8 billion more compared to the same period a year ago. The 504 debenture team marketed, placed, traded and settled that volume of debentures during one of the worst bond bear markets on record.
The sales proceeded on schedule, with no disruption and required some adjustments to the spread to treasury required to clear the heavy supply. Most of the extra spread to treasury required to place the pools, however, was required to recognize 1) DCPCs are more sensitive to prepayments now, 2) rate volatility is extremely high, 3) the yield curve is flat, 4) spreads are sharply wider on competing products like corporate bonds and MBS. We remain ready and expect challenging markets to continue for the balance of the year.
Check out the table and chart that underscore the rare markets we have experienced, and will continue to experience, this year.
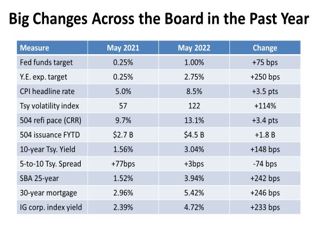
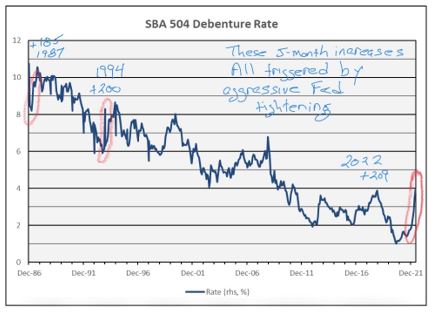
May 2, 2022
The interest rates market remains challenging to navigate heading into the May SBA 504 debenture offering this week. We start our commentary with a bar chart of the 10-year Treasury yield over the past three months. See that the yield elevator went up very quickly, a 120 bps ride in under two full months as the Fed transitioned to very hawkish policy signals. The uptrend paused over the past week or so as the market now awaits the FOMC decision on Wednesday.
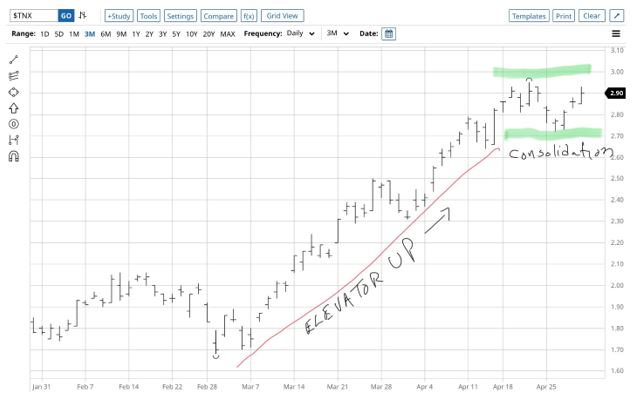
There are a number of indicators that we look at to get a feel for the market environment as we approach each sale, and then as we experience the sale. Here's a list of important indicators below, and what their changes from the April sale may imply for the May sale – bullish, bearish or mixed for the sale environment:
- Macro Backdrop: clearly bearish. 8-plus percent inflation and a quickly magnified Fed tightening bias.
- Yields and Rates: a bit bullish, the 10-year T-note yield is up roughly 25 bps since the April 7 pricing, which will help attract straight-out yield buyers into the SBA offering. But the relentless rise in yields has led to outflows from bond funds so some money managers may be using cash or proceeds from security sales to meet redemptions. The market expects a 2.75% Fed funds target at year-end, up 50 bps m/m, and 225 bps above the top of the current Fed funds target range. This implies a 5.75% Prime Rate by year end. One can hope the market has finally fully priced in Fed rate hikes.
- Yield Curve Slope: remains bearish but not quite as much. The 7-year Treasury yield most recently was 4 bps above the 10-year Treasury yield, compared to 11 bps above in April. New 20- and 25-year DCPC pools would paydown over an average of 6 to 7 years at 10% CPR, but the pools are priced off the 10-year Treasury benchmark. When the 7-year part of the yield curve is above the 10-year, extra spread must be added to competitively market the DCPC offering.
- Spreads Away: are on net bearish. Spreads over Treasuries are roughly 10-15 bps wider m/m for the main investment-grade corporate bond credit indices. Prepayment-sensitive securities such as agency residential MBS and GMNA project loans (as well as SBA DCPCs) have had a rougher go in a high volatility and inverted curve environment and those spreads are yet wider, with mortgages out 20 bps. Spreads in prepayment-protected agency CMBS, however, are stable. These sectors all provide competition for DCPCs.
- New Supply: mixed, the May 504 debenture offering will be the second largest on record, but in the ACMBS market only Freddie Mac is expected to provide competition with a $1 billion fixed rate 10-year offering. Treasury will not be in the market for coupon auctions.
- 504 Prepayments: mixed, 504 debenture pool prepays remained, thus far, puzzlingly elevated in a rising rate environment. But this gives existing DCPC investors opportunity to reinvest the paid-down pool principal received at a new higher coupon. As discussed above, however, securities with prepayment speed uncertainty like the DCPCs have a rougher go in this kind of market.
- Rate Volatility and Market Psychology: remains bearish, historical Treasury yield volatility is down, but expected volatility remains elevated. Investors may be cautious in front of the FOMC decision to be released at 2 PM on Wednesday. We are in a tough bond bear market.
Put all this together and the m/m outlook is for higher debenture rates with a somewhat wider spread over Treasury.
The most important releases on the economic calendar this week will include the ISM manufacturing and services indices on Monday and Wednesday, respectively. The ADP private payrolls data will be released on Wednesday. On Friday we get the Big Cahuna, the Employment Situation for April.
April 25, 2022
Tougher Talk
After some light Fed speak early in the week, markets on Thursday sold off hard as Chairman Powell affirmed a 50 bps rate hike is likely in May and the futures market has now priced in 50 bps hikes for at least the next three meetings. The comment that triggered market reaction was “It is appropriate in my view for us to move a little more quickly,” and that could have been in response to critics who believe the Fed has been too slow to confront 8.5% inflation, as reported in the recent CPI release.
Such aggressive moves have led analysts to predict the bank’s policy rate will be 2.75% by year-end, vs. 0.375% today.
Things to Note:
- May would be the first 50 bps rate increase since 2000
- If a second increase in June, that would be the first consecutive number of increases since 2006 and there is speculation a 75 bps increase is possible this summer
- This reality prompted a sharper increase in short-term rates, with the two-year Note rising the most, further flattening the 2/10 curve to +18 bps, flatter by 18 bps on the week and 68 bps YTD
- Where the Fed goes, other central banks follow. Four months ago, ECB President Lagarde said a rate hike in 2022 was unlikely, now governors are talking about a July increase and that is in a weak environment for its members
- The May 4 meeting is when the Fed is expected to announce plans to begin shrinking its $9 trillion portfolio, meaning not only is this previously significant buyer of debt no longer buying securities, but it is also now preparing to possibly become a seller. Letting maturing debt run off is one option, a slow one at that, but how the Fed decides to accelerate its plan will have more impact on the market, slope of the curve, and the securities market most affected by the plan, probably credit spreads.
- The war between Russia and Ukraine is not just between the largest country in the world vs. the largest country in Europe, it is a battle between two systems and its impact will continue to be felt globally. The International Monetary Fund on Tuesday reduced its forecast for global growth by a percentage point, warning the war in Ukraine was increasing the economic strains from the pandemic which seems to be developing new strains.
Ahead of the Fed
This WSJ chart shows how the market has moved in front of Fed action with the benchmark ten-year Note closing the week at 2.90%, 25 bps higher than when the 504 program priced its April debentures and 127 bps higher than on January 3 of this year.
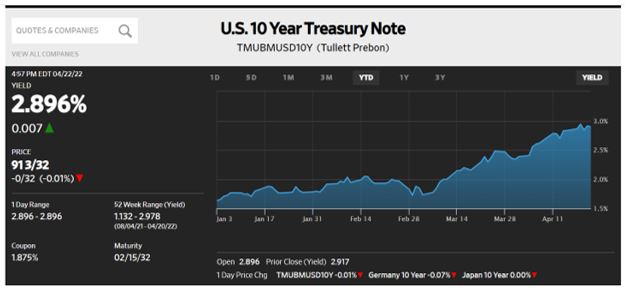
Besides that jump in rate, what is equally relevant for the program is the changed slope of the Treasury curve which has seen the 2/10 spread change from +86 bps to begin the year to close last week at +18 bps and the increased amount of prepayments that now average $276M monthly, an increase of $104M over the previous twelve-month period.
The faster speed of prepayments reduces the perceived Weighted Average Life of the debentures, meaning the securities are matched to a shorter part of the Treasury curve which has resulted in recent wider pricing spreads
Impact on Stocks
Confirmation of a more hawkish Fed policy did not sit well with stocks, off almost 3% on the week with the DJIA having its worst day since October 2020. Helping to soften the blow were reported earnings that beat forecasts by 80% of the reporting companies, confirmation of the Fed’s Beige book that shows moderate growth. This week will see how tech giants Apple, Amazon and Microsoft have performed.
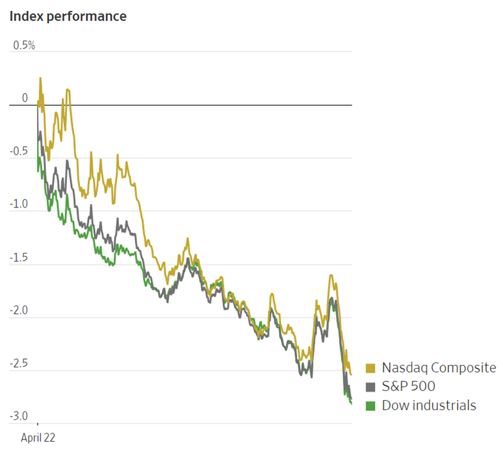
In summary, the Russia-Ukraine war will negatively impact global economies, central banks will act quickly to combat inflation, the Covid-zero policy in China is problematic with Shanghai in a months-long lockdown, and stagflation is becoming a bigger concern with the Fed possibly needing to accept a higher rate than 2%. A lot of questions with answers pending.
The Week Ahead
Fed speak ends ahead of the May 3-4 FOMC meeting, an active Treasury calendar, a look at 1Q2022 GDP, and then the Fed’s preferred inflation gauge.
Monday – Treasury sells $105B 13 & 26-week Bills
Tuesday – Treasury sells $48B two-year Notes; Durable Goods consensus is 1%
Wednesday – Treasury sells $24B two-year FRN’s and $49B five-year Notes
Thursday – Treasury sells $44B seven-year Notes; 1Q2022 GDP projected at +1.1%
Friday – P&I Outlays is forecast at +0.9% and 6.8% Y/Y
April 18, 2022
Tougher Fed Talk
It was just eleven days ago that the 504 program priced its April debentures off a benchmark rate of 2.645% but recent “Fed speak” has lent credence to more aggressive rate increases starting with the next meeting that ends on May 4th. Comments by Fed Governor Christopher Waller on Thursday, proposing a 50 bps hike at the next meeting contributed to the late week spike in rates.
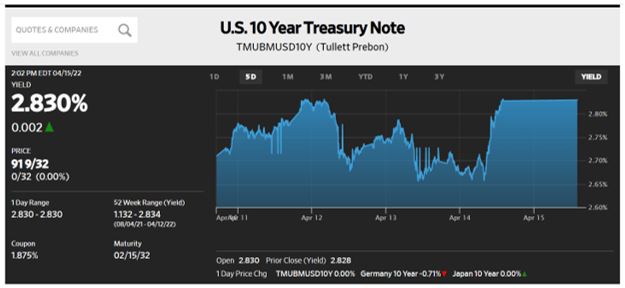
The 2.83% level was reached earlier in the week after CPI came in at 1.2% and 8.5% Y/Y, its highest reading since 1981. The market actually improved the next day when PPI was reported at even higher levels, 1.4% and 11.2% Y/Y. These readings were referenced by Governor Waller when he called for more aggressive Fed action, and the market seems to have listened.
Fed Action
As mentioned in last week’s commentary the next Fed move is expected amidst the 504 program’s May debenture sale, but rate increases alone are not what the market anticipates in determining current and futures market levels. As the bank pursues a neutral rate for funds it also is dealing with the size and composition of its $9 trillion Balance Sheet. It has announced monthly runoffs of $95 billion, composed of $60 billion Treasuries and $35 billion Mortgage-Backed Securities, but that will take a long time to reduce its size. The bank also has announced it prefers to maintain a predominantly US Treasuries portfolio so sales of some MBS can be expected and that could contribute to increasing supply in the market and negatively affecting credit spreads. Of particular interest last week, the 2/10 Treasury curve steepened, moving from +20 bps to +37.6 bps.
Expectations
Inflation has been identified as the #1 target for the Fed so if the economy does not react adversely to higher rates, it will remain so as the bank has said it expected inflation to remain elevated in the near future. In the bank’s March 2022 Survey of Consumer Expectations median forecasts reflect that:
- One year ahead median expectations increased to 6.6% from 6.0%
- Three year ahead median expectations decreased to 3.7% from 3.8%
- The median one-year change in home prices increased to 6% from 5.7%, well above the pre-pandemic rate of 3.0% in February 2020
These forecasts confirm inflation’s persistence, meaning the 2% target rate is distant and the IMF is expected to downgrade its forecast for most countries economic growth as the war in Ukraine heightens the risk of stagflation resulting from slower growth and high inflation.
Other Developments
- Retail Sales increased by 0.5%, mainly due to gas prices
- ECB leaves rates unchanged, plans for gradual tightening
- Turkey left rates unchanged with inflation at 61%
- Rates on ten-year Chinese and US Treasuries converged, reversing a decades long difference
The Week Ahead
Light Fed speak as we approach the next FOMC meeting; few economic reports; and an active Treasury calendar totaling $175 billion of Bills, Bonds and TIPS.
April 11, 2022
Higher 504 Debenture Rates: Treasury yield rise, yield curve inversion, and fast 504 prepayment speeds all played a part. The April 2022 SBA 504 debenture rates rose sharply compared to March with rates on the 2022-20D and 2022-25D classes at 3.38% and 3.50%, respectively.
We’ve written extensively this year about the “never before” credit market environment in 2022. It features the Fed moving to from QE to “quantitative tightening” (QT) at a time of a 7-plus percent US consumer inflation rate. In recent weeks Fed leadership signaled an increasingly hawkish policy outlook. The credit market reaction was turbulent but generally orderly underneath the surface. The market reaction in this “never before” environment accounts for the vast majority of the rise in 504 debenture rates. Fast 504 prepayment speeds also were a factor. This week, we visit with 504 loan prepayment speeds, which have had an impact on the spread over Treasury required to place the debenture pools with investors.
Yields Rise and the Curve Inverts. At the April 7 504 debenture pricing, the 10-year Treasury yield was 65 bps higher than at the setting of the March debenture rates. In addition, expectation for more aggressive Fed QT inverted much of the Treasury yield curve including the key 7- to 10-year (7/10) segment. The 7-year Treasury yield was 10 bps more than the 10-year Treasury. In contrast, on March 10 the 10-year yield was 3 bps above the 7-year yield.
504 Loan Prepayment Speeds Are Important. Why did the inverted 7/10 segment of the curve affect the April 504 debenture rates? The answer is rooted in the market-expected pace of 504 loan-backed debenture pool voluntary prepayments, known as “constant prepayment rates” or CPRs. Investors now expect 504 pools to prepay at about 10% CPR compared to the 5% long-term convention. This means the expected average lives of new 504 pools are in the 6- to 7-year range. Additional spread over the 10-year Treasury pricing benchmark must be offered to investors because yields in the 6- to 7-year part of the curve now are higher than the 10-year point. This additional m/m spread in April was 10 bps for the 25-year pool and 20 bps for the 20-year pool.
The chart below shows persistently elevated voluntary prepayments of 504 loans backing the CDC-issued debentures. April voluntary prepayments totaled $314 million, the third highest on record.
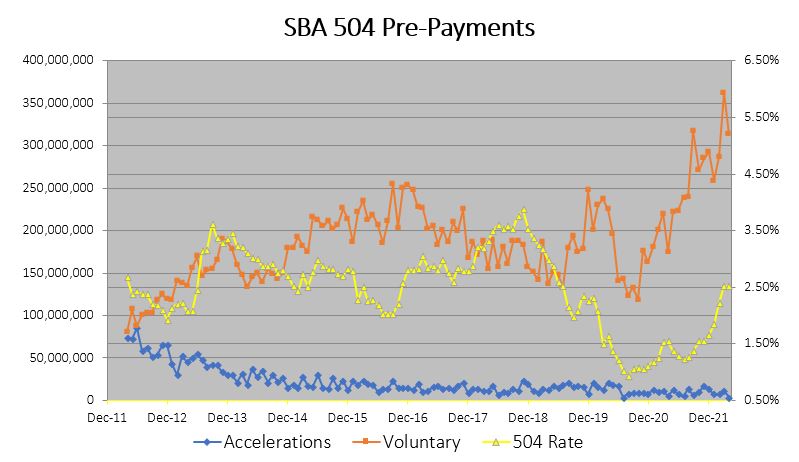
It seems unusual that 504 prepayments remained so high, recently in excess of 1% of the $28 billion outstanding portfolio balance per month, in a sharply rising rate environment. Consider that the weighted-average debenture rate on the outstanding 504 portfolio is 2.42%, about 100 bps out of the money compared to the April 504 debenture rates. The incentive to refi a 504 based simply on the replacement interest rate cannot be much in play for 504 borrowers. For example, refi of a hypothetical $1 million, 2.42% 20-year 504 loan balance with a new 3.50% 25-year loan, results in rough savings of $250 per month in P&I, which seems paltry.
If So, Then Why the High Prepayments? We’ve heard at various times that prepayments may be high due to 1) persistent rebound in prepayments suppressed by Section 1112 P&I relief, 2) generational transfer of business properties and 3) owners extracting some value from commercial properties that appreciated since the bottom after the GFC. All or some of these factors might well interact. There is no industry-wide data to test these educated guesses.
Sharply Rates Higher Everywhere. In summary, the combination of sharply higher 10-year Treasury yield and wider spread over Treasury resulted in materially higher debenture rates in April. Interest rates are sharply higher everywhere since March. For example, the US average 30-year mortgage rate and the 25-year Morgan Stanley 504 1st lien rate today would probably be above 5%. Further, the market currently projects a Prime Rate of 5.5% by year end. Next month could be interesting in the market with the FOMC policy announcement scheduled for Wednesday, May 4. Keep your seatbelts close.
April 4, 2022
Sharp Inversion
The recent rise in rates that was prompted by anticipation and then confirmation of the Fed’s rate hike on March 16 was expected, the volatility of the rate rise in short-term maturities was not expected.
This Federal Reserve Bank of St. Louis chart shows the spread between the two-year and ten-year Treasury rate (2/10 curve) that has changed in one week from +12.4 bps to -7 bps, reflecting how the market is anticipating as many as six more rate hikes by the central bank this year. This inversion puts the two-year Note at 2.46% with the benchmark ten-year Note closing the week at 2.39%, 39 bps higher than when the program priced its March debentures.
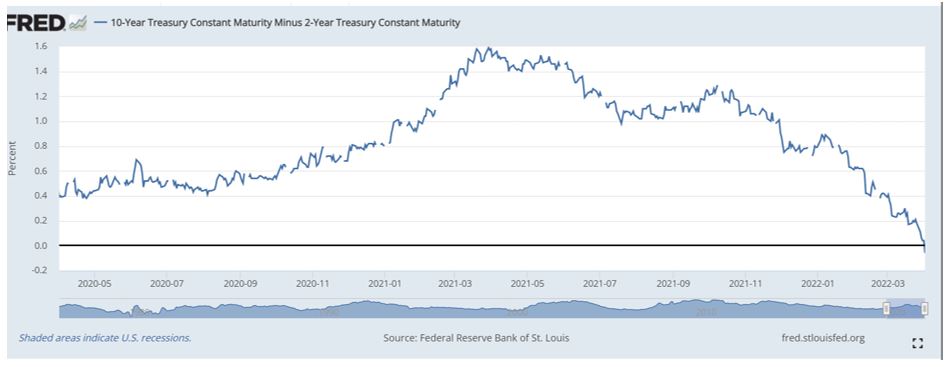
The impact of this is significant for the 504 program, especially with the elevated amount of prepayments affecting the markets interpretation of the debentures’ Weighted Average Life. Since the debentures are amortizing, faster prepayments reduce the WAL meaning debentures are priced off a shorter point of the inverted, higher yielding Treasury curve, resulting in a wider credit spread.
This chart below shows what all CDC’s experience individually each month as the program’s April prepayment total is lower than March’s record ($362.5M) but is still the third highest ever at $314MM. The yellow line for 20-year debenture rates is left unchanged from March but because of the higher Treasury rate and inverted curve both it and the 25-year rate will be much higher on Thursday.
What is confusing is how prepayments have trended higher in a rising rate environment, one in which it is assumed borrowers would be content to hold a loan with a rate like the 25-year debenture average of 2.22% dating back to the maturity’s introduction in July 2018. If you are looking for a longer time frame, the 10-year average for 20-year debentures is just 2.48%.
Accelerations continue to track at a much lower level, totaling just $3.7M in April and averaging $9MM over the last 12-months vs. prepayments averaging $276MM over that time.
Economy
For now, it appears the Fed is correct to focus on inflation as the most recent jobs report of 431,000, coupled with an upward revision of 95,000 for February, was above consensus. This is the eleventh straight month of job growth in excess of 400,000, the longest stretch of growth in records dating back to 1939. The unemployment rate declined to 3.6%, average hourly wage gains did increase by 0.4%, though that is slightly below the preceding six-months growth of 0.5% and remains well below the inflation rate. Fear that higher rates could lead to a recession, or stagflation cannot be dismissed but it is hoped improved supply chain distribution and still historically low interest rates can sustain growth. The Fed’s preferred inflation gauge came in as expected, 0.4% and 6.4% y/y.
The Week Ahead
More Fed speak, an active ACMBS market including the 504 program’s April debentures, a light week for Treasury issuance and reports.
Monday – Treasury sells $105 billion 13 & 26-week Bills; Factory Orders expected to be -0.6% after a 1.4% gain in February
Tuesday – SBA 504 program announces its April debenture sale
Wednesday – Minutes of the March FOMC meeting are released
Thursday – SBA 504 program prices its April 20 and 25-year debentures
March 28, 2022
V is for Volatility – i.e., Why SBA Debenture Rates Rose in March
Q. What happened to credit markets with the following unique combination of conditions?
- The US labor market is tight and supply chains stay stressed
- Europe experiences the first conventional war in the region since 1945 and commodities spike
- The financial system getting stressed from sanctions against Russia
- US inflation above 7% for months and inflation expectations getting unmoored
- The Fed under great pressure - Quantitative Easing will turn to Quantitative Tightening
- The Fed, therefore, cannot have the markets’ back in a crisis
A. The answer is that markets experienced “macro-induced volatility” with a flight to liquidity. This is the technical phrase for when investors and traders are highly risk-averse and therefore markets get messy and very challenging to navigate. Treasuries and Treasury-collateralized short-term loans become the preference to raise liquidity and reduce risk. Other markets may not closely track Treasury yields in such conditions, even government-guaranteed securities like SBA. It's about liquidity, not credit quality.
In the chart below you can see a picture of the resulting volatility we're referencing with this portion of the narrative. Note that the underwriting cycle for the SBA 504 pools typically starts on the Friday before pricing and ends on the Friday after when the pools are freed to trade in the secondary market.
- When Eagle started preliminary discussions with the underwriters for the March sale on the 4th, the 10-year Treasury note yield was 1.7%
- The week before the yield had dropped from over 2% to 1.7%
- Yet over just three days before our discussions, the yield flipped up from 1.7% to 1.9% and back down to 1.7%
- The yield then rose off that 1.7% base throughout the marketing period of March 8-9
- By pricing on March 10, it was 30 basis points higher, at 2.00%, versus the start of the underwriting cycle, and nearly identical to the February 8 spot of 1.99%
That was tremendous volatility for a highly liquid interest rate like the 10-year Treasury. It was this intense intraday whipsaw of volatility that drove all types of investors, not just SBA buyers, to seek liquidity as shelter.
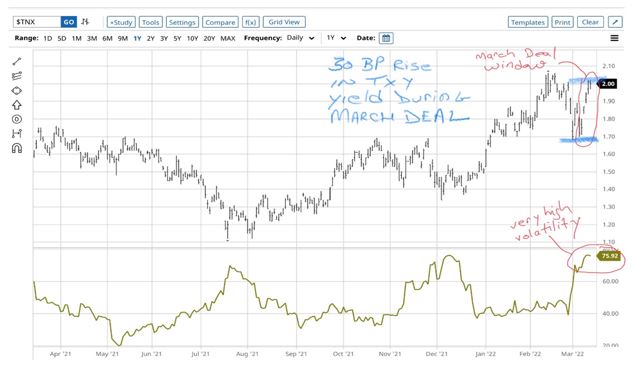
It therefore took additional “spread” to entice investors to buy into the March SBA pools. The debenture rate required to place the 25-year pool, for example, increased on a monthly basis by 33 basis points while the Treasury benchmark was almost unchanged. That is a sharp m/m increase in the “spread” looking back over the last 20 years, something experienced on a frequency of about once every two years, not unheard of, but not common. Looking at the chart below of the debenture spread versus Treasury since 1999 we've highlighted in red some periods of time where the spread moved up sharply. You can see they involved times of high stress in the markets.
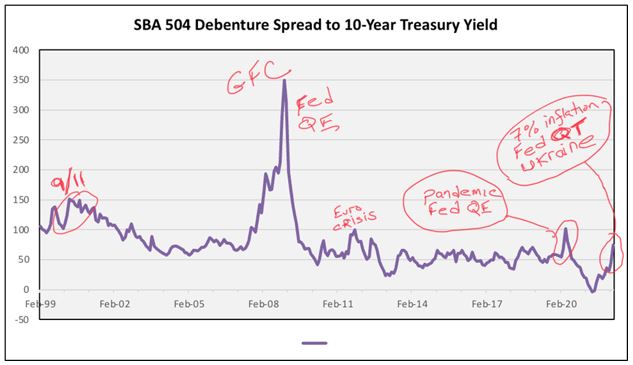
Only referencing the Treasury benchmark in estimating SBA 504 debenture rates may be misleading in the kind of markets we now have. If we look at other interest rates, including mortgage rates, we see they all had risen since February. Below is a table of interest rates and changes on a monthly and year-to-date basis.
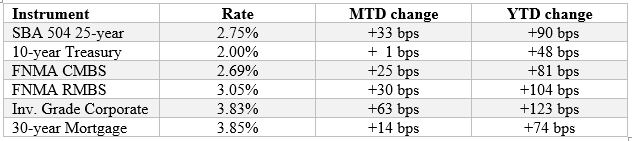
We see referenced in the table above not only Treasury, the most liquid instruments in the world, but three federal agency instruments (from SBA and FNMA). We also referenced the ICE investment grade corporate bond index for a measure of credit, and also the national average 30-year mortgage rate.
What we see in the table is that the outlier is the relatively low change in the 10-year Treasury. Every other interest rate moved up quite a bit on a year-to-date basis and, with the exception of the 30-year mortgage rate (which already moved up in advance), the other interest rates moved up a lot on a month-to-month basis. It's important to place the movement of the March vs February SBA debenture rate in this context.
In summary, SBA is government-guaranteed but, like all federal agency paper, does not benefit from a flight to liquidity in volatile markets. In such markets the SBA pool interest rate must increase, sharply at times (see esp. 2008 in the second chart), relative to Treasury to place all the debentures. SBA 504 borrowers were funded even in cataclysmic markets (again, see 2008) but one could not easily predict the interest rate it took to clear.
March 21, 2022
It’s Official
Rates rise as the Fed raises short-term rates for the first time since 2018 to a range of 0.25-0.50% with expectations of six more increases this year which analysts predict will send the benchmark ten-year Note as high 2.75% by year-end. Implications for that are a flatter yield curve and wider credit spreads, as identified by Steve Van Order in last week’s Eagle Eye report.
For the week, the benchmark Note rose 15 bps, but most importantly for the 504 program the spread between the seven-year and ten-year Treasury notes is now at negative 2 bps, a development that drives investor demand for more spread on credit products. The reason for that is because the WAL (Weighted Average Life) of 2022-25C is estimated at 9.48 years assuming a speed of 5% and with pre-payments as high as they are any assumption of faster pre-pays reduces that estimate to a shorter WAL, making the shape of a flattening, higher yielding curve a factor for investors to evaluate.
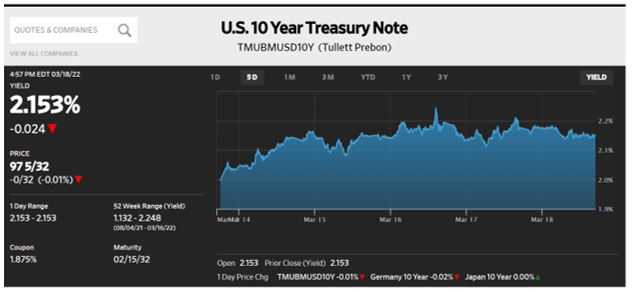
The Committee’s vote to raise rates was 8-1 with St. Louis Fed President James Bullard dissenting in favor of a 50 bps increase. The Fed plans to discuss shrinking its $9 trillion bond portfolio at its May 3-4 meeting now that it has ended its long running asset purchase program. Combined with the decision to raise rates the absence of this buyer in the market is a contributing factor to the rise in rates.
Below is a table of the central bank’s projections for the economy and it was met with criticism that the numbers don’t add up, meaning you can’t raise rates without thinking you will affect unemployment, yet the forecasted unemployment rate is static.
A tight labor market, one that Chairman Powell described as “almost being at an unhealthy level,” is acknowledged as threat to inflation.
| GDP | Unemployment | PCE | FF Rate | |
|---|---|---|---|---|
| 2022 | 2.8% | 3.5% | 4.3% | 1.9% |
| 2023 | 2.2% | 3.5% | 2.7% | 2.8% |
| 2024 | 2% | 3.6% | 2.3% | 2.8% |
Of interest is the Federal Funds projections are up sharply from the December levels where the 2024 rate as forecast as 2.1%.
Higher Rates Did Not Impact Stocks
Closing their best week since 2020 stocks rallied into and through the Fed’s announcement with the tech heavy Nasdaq better by 8.2% on the week. Analysts believe the solid fundamentals of many companies will allow them to withstand higher costs and geo-political uncertainty.
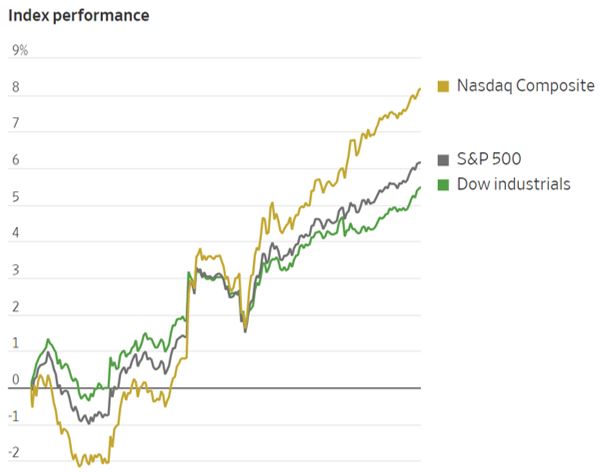
Reports
Trends continue as inflation is persistent while the economy remains on track with first-time home buyers facing tight inventory and competitive bidding in a rising rate environment.
- PPI was as expected at 0.8% and 10% y/y
- Retail Sales disappointed at 0.3%
- Industrial Production was on target at 0.5%
- Existing Home Sales declined 7.2% in February as light supply and rising rates had an impact. A thirty-year Freddie Mac mortgage is now 4.16% vs. a year ago rate of 3.09%
The Week Ahead
Fed speak resumes, an active Treasury and ACMBS calendar, and few economic reports.
Monday – Treasury sells $105 billion 13 & 26-week Bills
Tuesday – Treasury sells $34 billion 52-week Bills
Wednesday – Treasury sells $22 billion two-year FRN’s and $16 billion twenty-year Bonds
Thursday – Treasury sells $14 Billion ten-year TIPS; Durable Goods expected to drop to -0.5% after previous gains
Friday – Consumer Sentiment expected to hold steady
March 14, 2022
V is for Volatility – i.e., Why SBA Debenture Rates Rose in March
Q. What happened to credit markets with the following unique combination of conditions:
- The US labor market is tight and supply chains stay stressed
- Europe experiences the first conventional war in the region since 1945 and commodities spike
- The financial system getting stressed from sanctions against Russia
- US inflation above 7% for months and inflation expectations getting unmoored
- The Fed under great pressure - Quantitative Easing will turn to Quantitative Tightening
- The Fed, therefore, cannot have the markets’ back in a crisis
A. The answer is that markets experienced “macro-induced volatility” with a flight to liquidity.
This is the technical phrase for when investors and traders are highly risk-averse and therefore markets get messy and very challenging to navigate. Treasuries and Treasury-collateralized short-term loans become the preference to raise liquidity and reduce risk. Other markets may not closely track Treasury yields in such conditions, even government-guaranteed securities like SBA. It's about liquidity, not credit quality.
In the chart below you can see a picture of the resulting volatility we're referencing with this portion of the narrative. Note that the underwriting cycle for the SBA 504 pools typically starts on the Friday before pricing and ends on the Friday after when the pools are freed to trade in the secondary market.
- When Eagle started preliminary discussions with the underwriters for the March sale on the 4th, the 10-year Treasury note yield was 1.7%
- The week before the yield had dropped from over 2% to 1.7%
- Yet over just three days before our discussions, the yield flipped up from 1.7% to 1.9% and back down to 1.7%
- The yield then rose off that 1.7% base throughout the marketing period of March 8-9
- By pricing on March 10, it was 30 basis points higher, at 2%, versus the start of the underwriting cycle, and nearly identical to the February 8 spot of 1.99%
That was tremendous volatility for a highly liquid interest rate like the 10-year Treasury. It was this intense intraday whipsaw of volatility that drove all types of investors, not just SBA buyers, to seek liquidity as shelter.
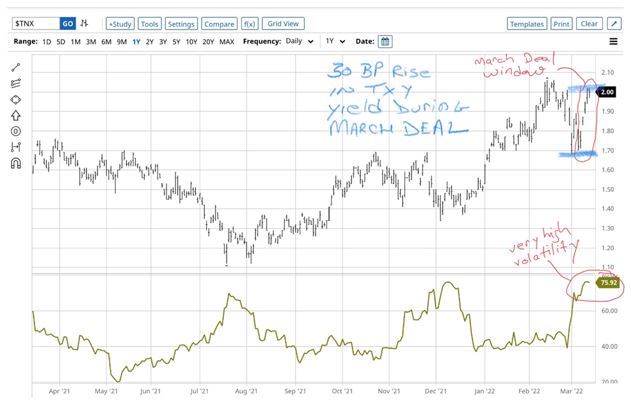
It therefore took additional “spread” to entice investors to buy into the March SBA pools. The debenture rate required to place the 25-year pool, for example, increased on a monthly basis by 33 basis points while the Treasury benchmark was almost unchanged. That is a sharp m/m increase in the “spread” looking back over the last 20 years, something experienced on a frequency of about once every two years, not unheard of, but not common. Looking at the chart below of the debenture spread versus Treasury since 1999 we've highlighted in red some periods of time where the spread moved up sharply. You can see they involved times of high stress in the markets.
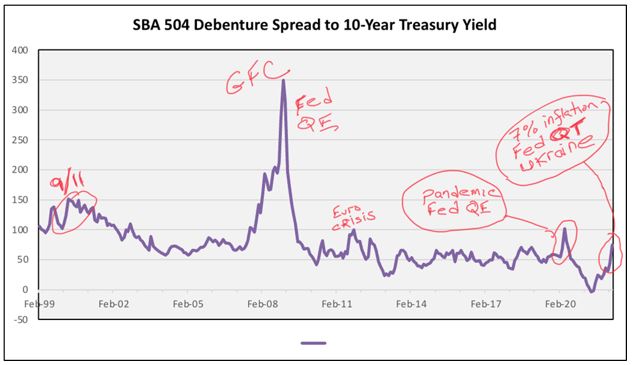
Only referencing the Treasury benchmark in estimating SBA 504 debenture rates may be misleading in the kind of markets we now have. If we look at other interest rates, including mortgage rates, we see they all had risen since February. Below is a table of interest rates and changes on a monthly and year-to-date basis.
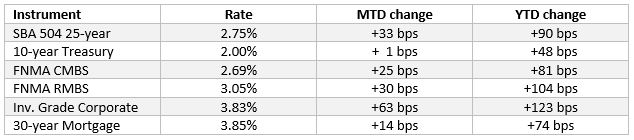
You'll see in the table referenced not only Treasury, the most liquid instrument in the world, but three federal agency instruments (from SBA and FNMA). We also referenced the ICE investment grade corporate bond index for a measure of credit, and also the national average 30-year mortgage rate.
What we see in the table is that the outlier is the relatively low change in the 10-year Treasury. Every other interest rate moved up quite a bit on a year-to-date basis and, with the exception of the 30-year mortgage rate (which already moved up in advance), the other interest rates moved up a lot on a month-to-month basis. It's important to place the movement of the March vs February SBA debenture rate in this context.
In summary, SBA is government-guaranteed but, like all federal agency paper, does not benefit from a flight to liquidity in volatile markets. In such markets the SBA pool interest rate must increase, sharply at times (see esp. 2008 in the second chart), relative to Treasury to place all the debentures. SBA 504 borrowers were funded even in cataclysmic markets (again, see 2008) but one could not easily predict the interest rate it took to clear.
March 7, 2022
Moret Turmoil Amidst Global Conflict
- Bond yields recorded their biggest one-week decline since March 2020
- DJIA ended its fourth week of losses
- Commodities continue to reflect scarcity with oil trading as high as $114 per barrel and increased talk of banning Russian oil imports
- Russia’s economy has been cut off from the rest of the world
- Seizure of Ukraine is inevitable as US and NATO are committed to not employ forces in country and Russia continues to advance
This WSJ chart shows how the benchmark ten-year Note declined 23 bps on the week with the slope of the 2/10 Treasury curve flattening by 14 bps to just +25.2 bps, meaning the two-year Note, which is most impacted by tighter Fed policy, declined less as a 25 bps rate hike is almost guaranteed for March 16. This increase was included in Chairman Jay Powell’s Congressional testimony last week and reflects a cautious approach with a “series” of as many as six increases in 2022. Such caution has been criticized by many analysts who believe the Fed is behind the curve in fighting inflation, believing it will negatively impact economic growth.
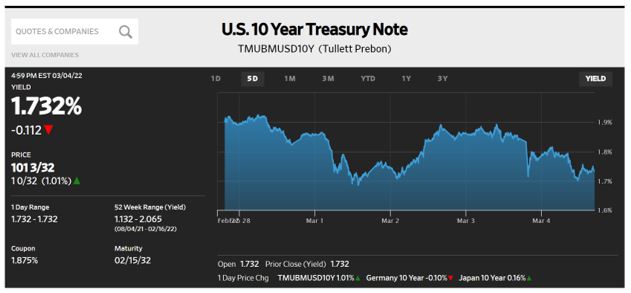
Another hindrance to economic growth is the potential negative impact of Russian sanctions affecting what is called the world’s financial plumbing. A recent Financial Times article identifies the risk of Russian banks being cut off from global transactions and the impact that can have on existing tri-party agreements with other banks. Reference was made to a Lehman Bros. type shock, but it is acknowledged there are no signs of that right now. The connection does illustrate that such isolation can be problematic as Russia’s central bank is unable to access $630 billion in foreign reserves, including dollars it would ordinarily be able to lend in funding markets.
SBA 504 Program
While the safe-haven trade in Treasuries has reduced interest rates, that and the flattening yield curve have pressured credit spreads, meaning investors are demanding wider pricing spreads to buy credit product like the 504 program’s DCPC’s. Just as the program continues to see record increases in approved loans it is on track to fund more than $6 billion dentures this fiscal year, a record. Our Selling Agent, Steve Van Order, has reported how the program’s Underwriters have maintained a sturdy base of investors to support the program with particular interest in the 25-year debenture which now represents 37% of the program’s Outstanding Principal Balance.
Reports
Not even Friday’s stronger than expected jobs report could help stocks overcome the news out of Ukraine. 678,000 new jobs far exceeded forecasts and unemployment dropped to 3.8%. Average hourly earnings showed a 5.1% increase y/y which is far below inflation of 7.5%, a reminder of why the Fed has prioritized controlling those increased costs.
Factory Orders also beat consensus at 1.4%, recovering sharply from December ‘s reading of -0.4%.
The Week Ahead
No Fed speak ahead of the March FOMC meeting, the SBA 504 program prices its March debentures, Treasury conducts its quarterly refunding and the ACMBS market expects heavy issuance for the 504 program to compete with.
Monday – Treasury sells $105 billion 13- & 26-week Bills
Tuesday – 504 program announces its March sale; Treasury sells $48 billion three-year Notes
Wednesday – Treasury sells $34 billion ten-year Notes
Thursday – 504 prices its March debentures; Treasury sells $24 billion thirty-year Bonds; CPI forecast at 0.7% and 7.9% y/y
Friday – University of Michigan Consumer Confidence report expected to continue trending lower
February 28, 2022
Russia’s Volatile Impact
The long-awaited Russian invasion of Ukraine finally took place, preceded by the less aggressive recognition of two breakaway Ukrainian states. Thursday was the culmination of this aggression, termed a “special military operation” by Vladamir Putin, initially creating a risk-off environment where stocks sold off as much as 3% and the benchmark ten-year Note declined 13 bps in a safe-haven trade. By the end of the day the ten-year Note was basically unchanged at 1.97% and the Nasdaq index was +3%. President Biden and European leaders denounced the invasion and introduced sanctions against Russian banks and advisors who are part of Putin’s inner circle.
By the close of business Friday, the benchmark Treasury was just 5 bps higher on the week and 34 bps higher ytd as seen in this WSJ chart. This closing rate is 2 bps below where the 504 program priced its February debentures three weeks ago, but credit spreads continue to widen in this inflationary, strong economic period that now is beset by a geo-political confrontation.
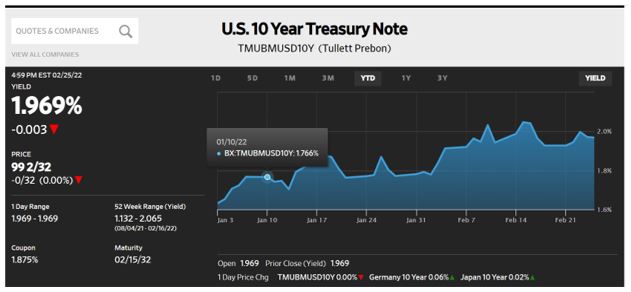
As written in last week’s commentary and included in an Eagle Eye piece, Steve Van Order identified the factors that affect DCPC pricing and this invasion of Ukraine will worsen supply chain disruptions, slow global growth, and perhaps caution the Fed about how aggressively it raises interest rates. That said, it seems clear the market will see a 25 bps increase on March 16 with more now expected throughout the year.
Another sector impacted by this assault is commodities as Russia is the second largest exporter of oil which spiked as high as $106 per barrel on Thursday, only to settle down to $92 per barrel on Friday. This prominent role in global trade identifies why sanctions so far have been limited to finance as any action to reduce Russian oil exports will not only slow global growth but send oil and gasoline prices sharply higher. Not only does that impact inflation, but also alters the administration’s clean energy initiatives that are still in development and not yet ready to be the needed alternative.
Surprisingly, stocks rallied to end the week in positive territory, partly due to Russia’s advance on Kyiv being thwarted. It seems the assault has been measured, not a full-scale invasion and unless that happens it is hoped the invasion does not escalate further even though Russia is deploying more troops and it is feared that cyber security is at risk.
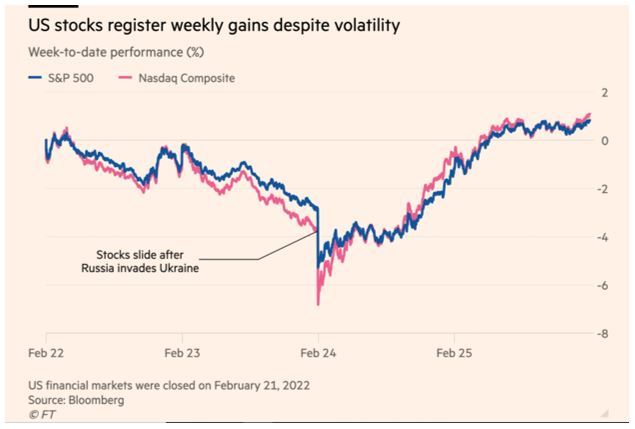
Reports
Though economic growth is being threatened all reports last week exceeded forecasts, though in the case of the Fed’s preferred inflation gauge that is not constructive.
- 4Q2 GDP’s second revision was 7.0%
- Durable Goods was 1.6% vs. a 0.5% forecast
- Consumer spending was 2.1%, recovering from December’s reading of -0.8%
- - Personal Income was flat, but PCE was 0.6% and 6.1% y/y, the highest reading since 1983
The Week Ahead
Some Fed speak as we approach the March FOMC meeting, a very light Treasury calendar, and the jobs report on Friday.
Monday – Treasury sells $105 billion 13 & 26-week Bills
Tuesday – ISM expected to remain steady at 58
Wednesday – Chairman Powell appears before Congress
Thursday – Chairman Powell appears before Congress
Friday – Non-Farm Payroll expected at 390K with unemployment at 3.9%
February 22, 2022
The February 2022 SBA 504 debenture offering was conducted during tough capital market conditions that featured a notable rise in Treasury yields. The benchmark Treasury 10-year note yield at pricing on February 10 was 1.99%, 26 bps above the level from January. In addition, heavy competing supply and notably wider spreads over Treasuries across all bond market sectors required an additional 12 bps on the two debenture rates versus January to place the debenture pools with investors.
There are a number of indicators that we look at to get a feel for the market environment as we approach each sale, and then as we experience the sale. Here's a list of the most important indicators below, and what the changes from the January sale meant for the February sale – bullish or bearish.
- Treasury Yields: Bullish, as noted above, yields were notably higher so a higher coupon resulted for investors.
- Yield Curve Slope: Bearish, sharply flatter. In fact, the 7-year Treasury yield equaled the 10-year Treasury yield. This is an esoteric but important phenomenon that applied pressure to widen spreads to Treasury for the 504 debenture pools (DCPCs). New DCPC’s expected average lives are always shorter than the Treasury pricing benchmark maturity. For example, in February the new 25-year DCPC pool was expected to paydown over an average of 8 to 9 years, but the pool was to be priced off the 10-year Treasury benchmark.
When the curve flattens, therefore, if the spread of a DCPC pool over the 10-year pricing benchmark is not widened, the resulting DCPC coupon over the shorter average life point on the Treasury yield curve will contract. So most often, when the yield curve flattens a lot, the DCPC spread to 10-year pricing benchmark must widen to compensate investors. Esoteric it may be, but we must track and measure this relationship all the time.
- Wider Spreads Away: Bearish, in addition to higher Treasury yields, spreads over Treasuries were wider m/m in government agency current coupon MBS (+30 bps), new issue agency CMBS (+12 bps) and the main investment-grade corporate bond credit index (+15 bps). These sectors provide the main competition for DCPCs. To compete, spreads to Treasuries on the DCPCs had to widen 12 bps m/m.
- Supply: Bearish, very heavy new issue in agency CMBS and private label CMBS, so there was lots of competition for investors’ eyes.
- 504 Prepayments: Bullish, 504 debenture pool prepays remained high in a rising rate environment. This gave existing DCPC investors opportunity to reinvest the paid-down cash at a higher coupon.
- Rate Volatility and Market Psychology: Bearish, investors were skittish as the Fed prepared for rate hikes and portfolio runoff. Expected 30-day volatility in Treasury yields was at the highest level since the March 2020 pandemic market shock.
- Macro Backdrop: Bearish. 7-plus percent US consumer y/y inflation rate and close to war with Russia.
The 504 Debenture Rate Change. In terms of the m/m change in the coupon for investors and, therefore, the interest rate for the borrowers, the 38 bps monthly increase was one of the largest in some time. The last time there was a larger monthly increase was June 2009 (52 bps). There were ballpark increases in March 2021 (29 bps), November 2016 (36 bps), and January 2010 (33 bps). As large as that 38 bp increase was, it was not quite one standard deviation (43 bps) of the monthly change when measured since the beginning of 1999.
Understanding the Backdrop Is Key. The Fed is preparing to exit from a couple of years of massive quantitative easing and near-zero policy rates, at a time of the highest inflation rates since the beginning of the ‘80s. We've never experienced this combination of events before in the markets.
There was a predictably strong reaction in the fixed income market, and key interest rates quickly increased. For example, the Freddie Mac 30-year mortgage rate is now near 4% (3.92% for the February 17 survey, that does not include an assumed 0.8 pt. in upfront fees). That rate is up 81 bps since the end of 2021. By comparison, the 504 25-year debenture rate increased by 57 bps since the December offering.
Thus far, however, it has been a very orderly market move there has been no experience of a destructive taper tantrum as we saw the first time the Fed tried to exit from quantitative easing on the other side of the global financial crisis.
Calendar. This week here are the major economic releases on schedule:
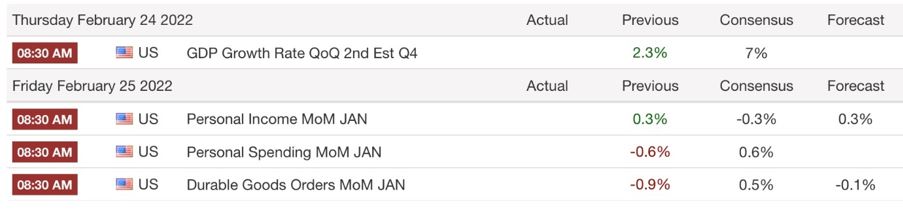
February 14, 2022
Peak Inflation?
Are we at peak inflation or is there more to come? Thursday’s 0.6% monthly gain in CPI brought the y/y total to 7.5%, its highest rate in forty years. The impact was swift – a rise in rates, a flatter yield curve, and more pressure on stocks. This gain is measured against pandemic price levels that have been greatly affected by supply chain disruptions that are expected to ease. As many as seven rate hikes from the Fed are expected to reduce inflation as low as 2% while not adversely affecting the economy, a very challenging goal.
Below is a WSJ chart of the economic sectors most affected by this CPI rise and these increases are the reason the Fed is more focused on inflation than full employment.
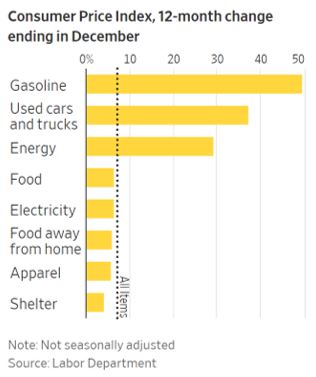
With the first measure of changed policy not expected until March 16 the market has front-run the central bank by raising the benchmark ten-year note 87 bps since February 10, 2021, when the SBA 504 program priced that year’s February debentures. Because tighter Fed policy most affects short-term rates the two-year Note has risen 139 bps during this period and is expected to outpace the longer maturity once the hikes begin.
It remains confusing that as the Fed prepares to tighten policy it continues buying assets like it will do one last time next month and then it will need to decide how to manage its portfolio as its past purchasing power will leave the market without one of its biggest buyers.
Adaptation
The market and the 504 program are adapting to a hawkish Fed and that means higher rates, flatter yield curve, and wider credit spreads. February’s sale of $523.3M DCPC’s was $37MM above the 12-month average and our Selling Agent, Steve Van Order reports the issues were priced at spreads tighter than ACMBS benchmark issues like FNMA DUS; 2 bps in the case of 2022-25B and 22 bps for 2022-20B. That performance optimizes pricing ability, solidifies the product’s status in the market and its appeal to investors.
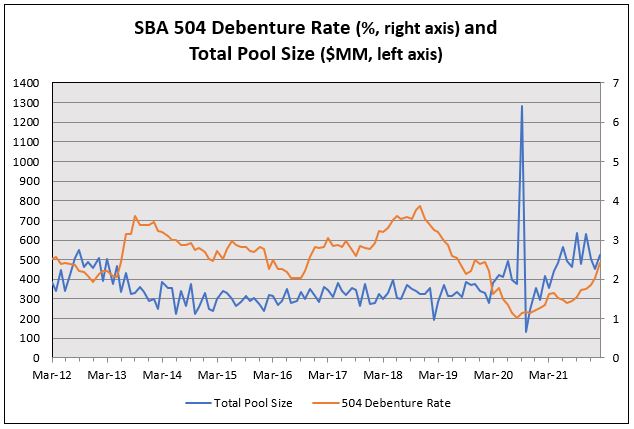
The Week in Review
By Friday, the S&P 500 index logged its fourth weekly decline over the last six weeks, down 1.8% in a volatile week. It was CPI that captured attention and we wait to see how large a rate hike occurs on March 16. Ahead of that meeting the Committee will assess the February jobs report as well as their preferred inflation gauge Personal Consumption Expenditures, on February 25. The December reading was +5.8%.
The Week Ahead
The February debenture sale closes, Fed speak, a light Treasury calendar, more inflation data on Tuesday.
Monday – Treasury sells $105 billion 13 & 26-week Bills
Tuesday – PPI expected to be +0.5%
Wednesday – SBA 504 program funds its February debenture sales; Treasury sells $19 billion twenty-year Bonds; Industrial Production forecast at 0.4%
Thursday – Treasury sells $9 billion thirty-year TIPS
Friday – Existing Home Sales
February 7, 2022
Strong economy + tighter policy = higher rates
Even though the Fed has yet to officially act, after hovering in that 1.75%-1.87% range the last few weeks Friday’s unexpectedly strong job gains pushed the ten-year benchmark through it as the Note closed 14 bps higher on the week, its highest rate since 2019.
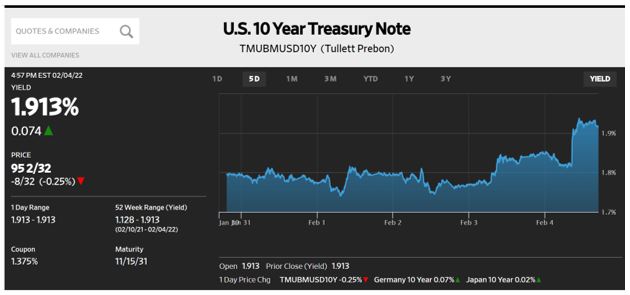
The stage had been set with the most recent FOMC announcement that consecutive 25 bps rate increases, or even a 50 bps rate increase is possible. Of interest in this weekly move is the slope of 2/10 Treasury curve is unchanged at +60.3 bps.
Half of the 14 bps spike occurred Thursday when poor earnings and low subscription levels for the firm formerly known as Facebook sent its shares down 26%, dragging most of the Nasdaq down with it. Here again, Friday’s jobs report helped much of the Nasdaq index recover, but not FB (now Meta Services). An indication of the whiplash being felt in tech stocks was Amazon’s 8% decline on Thursday followed by a 14% gain on Friday while FB was unchanged.
The 467,000 gains in Non-Farm Payroll, plus a 700,000 upward revision for the two previous periods signal strong hiring demand even with continued outbreaks of Delta and Omicron variants. Unemployment rose to 4% as more people sought work and wages gained 5.7% y/y, almost double the average of 3% pre-pandemic.
With PCE (the Fed’s preferred inflation gauge) running at 5.8% annually even that robust wage gain fails to keep pace with inflation, a reminder why the central bank has made controlling inflation a priority.
This Financial Time chart shows how equity indexes recovered on Friday after suffering double digit declines in January.
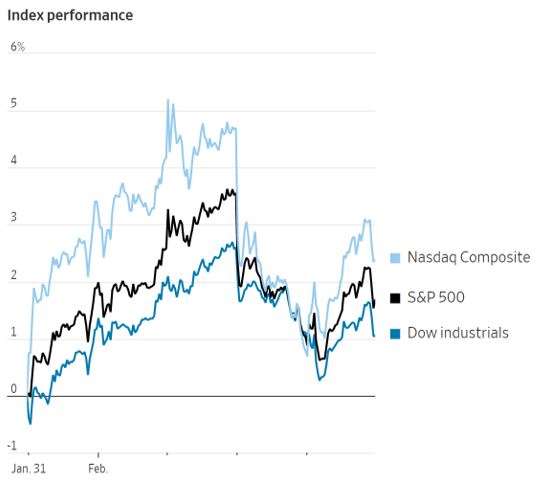
Balance
Balancing continued economic strength while reining in inflation is a challenge for the bank but one offset of multiple rate increases is the low starting point for rates, meaning it may be easier to identify the level of Treasury rates before they cause economic and financial damage.
The Week Ahead
Fed speak, active Treasury calendar, the 504 program prices its February debentures, and a light week for economic reports.
Monday – Treasury sells $105 billion 13 & 26-week Bills
Tuesday – SBA 504 program announces its February sale; Treasury sells $50 billion three-year Notes
Wednesday – Treasury sells $37 billion ten-year Notes
Thursday – SBA 504 program prices its 20 and 25-year debentures; Treasury sells $23 billion thirty-year Bonds
Friday – University of Michigan Consumer Confidence survey
January 31, 2022
Bond bears still trapped on an island
As recently reported by Steve Van Order bond bears have been disappointed by the benchmark ten-year Note’s range that recently peaked at 1.87%. Having ended the previous week at 1.78% the Note tested 1.87% again after Wednesday’s FOMC announcement, before closing on Friday at 1.77%. What did move, and sharply, was the two-year Note whose yield spiked after the FOMC announced its probable 25 bps rate hike for its March 16-17 meeting. This tightening impacts short-term rates and pushed the 2/10 curve flatter by 15 bps on the week. What also caught the market’s attention was Chairman Powell’s comment that rate hikes could occur at consecutive meetings which are held about six-weeks apart and that would be the first time for that since 2006. Another consideration is use of a 50 bps increase should the Committee believe it needs to be more aggressive fighting inflation.
The announcement and the Chairman’s press conference have identified the Committee as proceeding more vigorously where their approach now can be described as nimble rather than gradual. March will also signal the last of the bank’s asset purchases after which they will decide how to manage their $9 trillion securities portfolio
So, what changed in the rates market? Two things, the slope of the Treasury curve along with pressure on credit spreads, both of which can be expected to continue as the Fed is confident on the employment situation and focuses more on inflation. For the week CT-10 was lower by 1 bps (and just 14 bps higher ytd). Nasdaq was unchanged after some intra-day volatility on multiple days (but is down 13% ytd). 2/10 Treasury curve is +63 bps, flatter by 15 bps (and 23 bps ytd).
As seen on this Federal Reserve Bank of St. Louis chart the 2/10 curve was at its recent widest on 3/31/2021 at +158 bps when the ten-year Note traded at 1.73%. It now is 4 bps higher while the spread has shrunk to +63 bps, confirmation of how the market has been preparing for the end of the Fed’s zero interest rate policy.
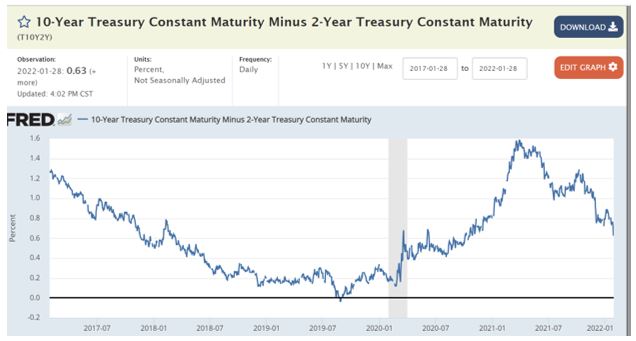
Other Events
- Russia remains poised to invade Ukraine under threat of more sanctions
- Covid-19 and its variants remain a threat as mask mandates continue to be debated
- 4Q2021 GDP came in higher than forecast at 6.9%; 3.3% y/y
- Durable Goods was reported as -0.9%, weaker than expected
- Personal Income grew at +0.4%
- Personal Consumption & Expenditures, the Fed’s preferred inflation gauge, was +5.8% y/y
- US labor costs at +4% grew at the fastest pace in two decades
The usual mix of conflicting numbers but the more aggressive Fed approach was addressed in a Bank of America research piece that states the Fed views inflation as higher and longer lasting than it had expected. BoA now expects the central bank to raise its benchmark rate to as high as 2.75%-3%, from its current range of 0%-0.25%. That projection is higher than most forecasts.
The Week Ahead
Fed speak resumes, Treasury calendar is light as are economic reports.
Monday – Treasury sells $105 billion 13 & 26-week Bills
Tuesday – ISM Manufacturing index has been trending lower, impacted by the Covid crisis
Thursday – Factory Orders expected to be flat
Friday – Non-Farm Payroll forecast at 200,000 with the unemployment rate unchanged at 3.9%
January 24, 2022
Bond Bears Get Caught on an “Island” From Falling Stocks. Through Thursday last week yields moved up, seemingly just another week in the bearish new year for interest rates. The 10-year T-note yield hit 1.87% mid-week. Friday, however, was a different day as Treasury yields staged a sharp turn south to 1.75% on Friday.
We can see on the chart below the clear breakout of the blue-lined top of the triangle formation we’ve discussed the past two weeks. There was a gap upward and a clear close above the horizontal blue line. That suggested another push higher in rates. But look at the gap down on Friday. The selloff in stocks for most of the week finally triggered some material buying in Treasuries. Featured in the red circle on the chart is a potential “island reversal” and if so is suggestive of a break in the yield uptrend, and at least some backing and filling. This may well depend on how stocks behave next week.
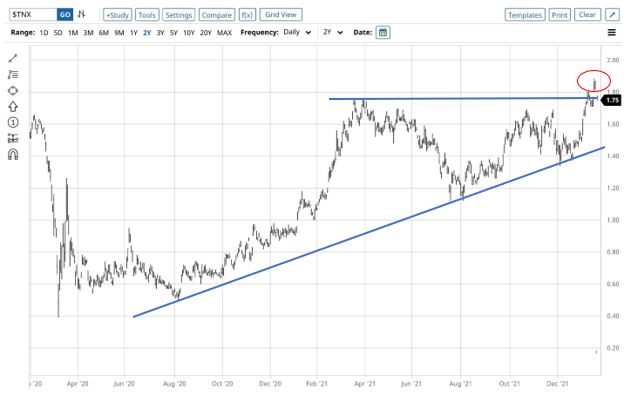
We can see below that the selloff in the S&P 500 index took out a 10-month uptrend. The damage by early Friday was over 5% w/w, and over 8% from the January 4 high. Other risk asset classes followed. The leading junk bond ETF was headed toward a drop exceeding 1% on the week.
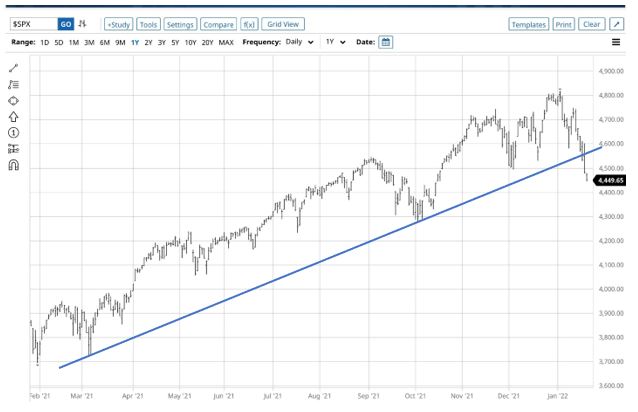
FOMC Meeting. This week the main calendar event will be Wednesday’s FOMC policy decision. Fed leadership has set the market up to expect a further shift toward tightening. Futures market pricing has strong probability of Fed policy rate increases in March, June, September, and December. The December OIS swap futures rate on Friday was 1.05% and the midpoint of a quarter-point target range upon the fourth hike would be 1.125%.
Of particular interest will be by how much the FOMC increases the weekly runoff of Treasuries and agency MBS on the balance sheet. This “quantitative tightening” requires private sector investors to step in and absorb the supply created by the Fed not rolling over the securities. Bears in the agency MBS market believe yield spreads will have to widen to Treasuries as the Fed’s MBS rundown continues. In that case, there would be a knock-on effect in the agency CMBS market, home of the SBA 504 debenture pools. Spreads would need to widen to remain competitive with MBS and keep bank portfolio investors engaged.
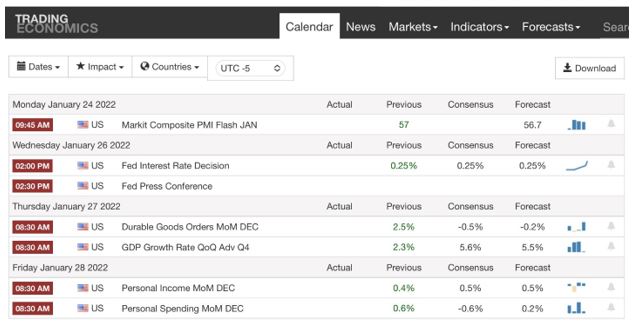
January 18, 2022
This week we feature three charts with commentary we thought would be of interest.
The Inflation Rate and Great Troubles. Let’s open with the latest consumer inflation rate. In the chart below, we show the headline CPI rate on a y/y percent change basis. At 7.1% for December, 2021, the index reached an altitude associated with notable troubles of the past. We marked in red clear proximal events for past inflation peaks above 5%.
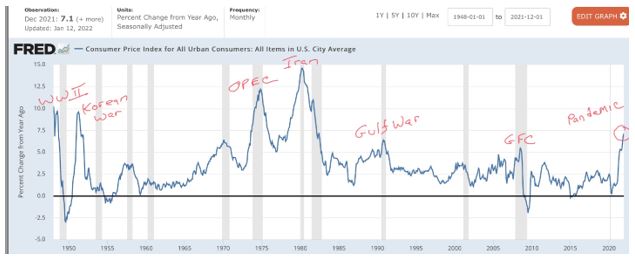
War is inflationary. Except for the wage/price peak in 1970* and the back-to-back inflation/deflation spikes during the GFC in 2008-09, prior peaks above 5% were associated with distinct military conflicts including three US wars, the Arab-Israeli War of 1973 (and resulting OPEC oil embargo) and the Iranian Revolution of 1979. All of these events contributed some degree of supply disruption at the consumer price level. The 1973 and 1979, in particular, wars contributed to temporary but material energy price shocks. Many will still remember “odd/even” gasoline rationing.
Looking even further back than shown on the chart, the 1918 flu pandemic in the US occurred as the military returned from Europe after WWI. Heading into that pandemic, inflation ran between roughly 15% to 20% from 1917 through 1919. Here, war was an important cause for high consumer inflation. Not to underestimate the challenges of today, but what a time of suffering in this country, with the loss of life from WWI and from a major pandemic, accompanied by a steady inflation rate over two times higher than today. My maternal grandmother told me vivid stories of that time.
The 7% US inflation rate of today is, unusually by eye of history, not associated with war. It is quite associated with pandemic-driven broad supply and labor market shocks (in contrast to the more focused oil-related shocks in 1973 and 1979). Protracted turmoil in the global supply chain has pushed up prices of every kind of good. Demand from an aging population that increasingly uses services, with a lower labor force participation rate, has helped pushed up wages. Worker supply has been squeezed by yet another coronavirus variant.
Of interest, incumbent parties did not fare well around these inflation peaks. For example, presidential elections of 1920, 1952, 1976,1980,1992 and 2008 featured a change in control. There were always other important, even overriding, factors such as voter fatigue with one party control, scandal, and financial crisis. But the association with political pain holds when pocketbooks hurt. With midterms up this year the inflation rate into November might be a factor. Will these wage gains be sticky? Will the supply chain stabilize this year. Big questions.
Triangle Revisit. Last week we discussed the nicely-formed Dow Theory triangle pattern on the ten-year T-note yield chart (below). We stated that a convincing break above the top line in the pattern would suggest renewed bear energy to move up toward 2%. Well, as seen in the chart below, the yield poked above the line but did not close above it – not convincing. The bond bears probably needed a rest given how busy they have been so far this year. The increasingly strident tone from the Fed gave some relief to fears of sticky inflation and bears may need a little rethink.
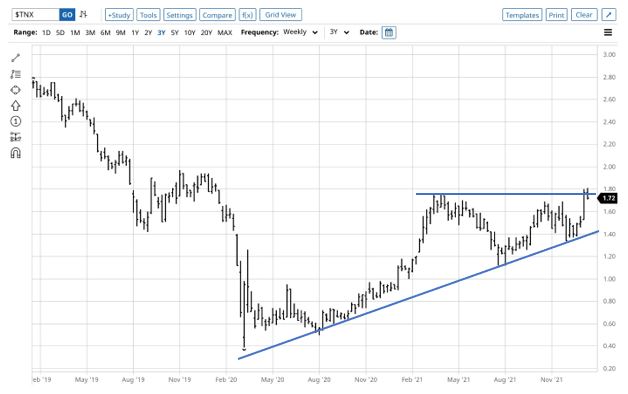
Wow, Only $10 Trillion of Negative Yielding Government Bonds. It is amazing to contemplate the still-healthy stock of negative-yielding government debt at a time of high inflation in the developed economies. The stock, however, has fallen sharply this year, from $14 trillion to $10 trillion. Yields rose as inflation increased and the Fed signaled a faster move from quantitative easing toward quantitative tightening, and more rate hikes. But, in particular, Japanese and German bond yields remain mainly below zero. Consider $10 trillion of negative yielding bonds yet a 7% US inflation rate – please dear reader, try to not let your head explode.
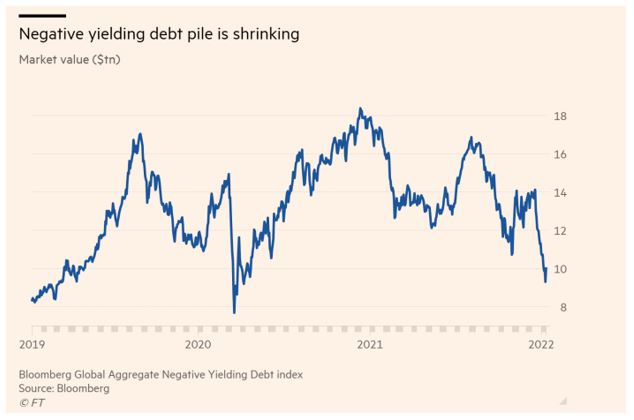
This week the economic calendar features housing market releases.
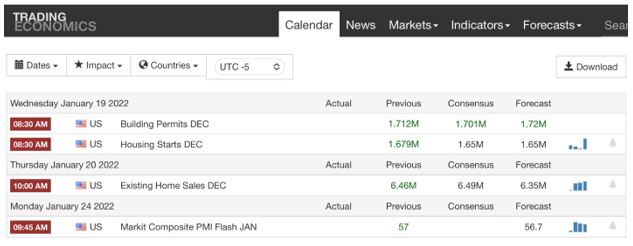
*The Vietnam War was a factor in rising prices over the decade of the ‘60s but is not associated with a clear price peak. Under Nixon wage and price controls appeared in 1971 and the US dollar was formally unpegged from the price of gold.
January 10, 2022
In 2021, government and investment-grade bonds produced the worst total returns since the 1999 bear market. Battered bond investors were greeted by the bond bear to start the new year with sharply higher Treasury yields. Last week the 10-year T-note yield tested major resistance at the 1.76% level. The chart below shows the bear market uptrend off the March 2020 pandemic low of 0.39%. The formation outlined in blue on the chart shows a classic wedge formation. A convincing breakout of the yield above the top of the wedge would suggest a move back toward the 2% area, something last seen in November 2019.
Spec accounts started the year clinging stubbornly to expectations of a bear steepener move in the yield curve, where yields rise led by longer maturity Treasuries. We can see this in data showing CME accounts very net long two-year T-note future contracts, yet mildly net long ten-year futures contracts. Indeed, the curve moved in a bear steepener way last week. But before last week, these bearish bettors had been beaten up pretty well in Q4 by curve flattening stimulated by the Fed’s more to a less accommodative stance and the appearance of the omicron coronavirus variant.
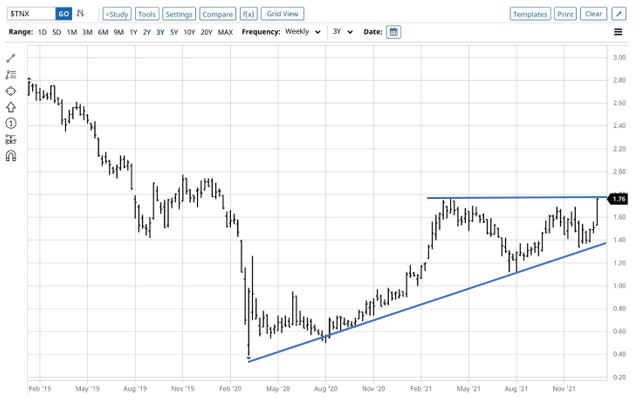
The CME futures data suggest there are material core positions betting the Fed will be too slow to prevent inflation from becoming sticky at an unacceptable level.
Along those lines, news reports of the Fed becoming more hawkish seem a bit off the mark. The Fed has become less accommodative (and increasingly so). In December the central bank “dot plot” showed a consensus FOMC forecast for the target Fed funds rate to remain sub-2% through the end of 2023. Yet plenty of market participants expect consumer inflation to stay elevated. So we have these bear steepener bets against the Fed.
That said, now 13 years later, the post-GFC economy and monetary policy have been very different than seen for much of the 20th century. These bearish bets on higher inflation and lagging Fed policy could well be (and yet again) washed away.
This week’s key economic releases are in the table below. Treasury will auction bills, 3- and 10-year notes and 30-year bonds. The January SBA 504 debenture deal will fund on Wednesday.
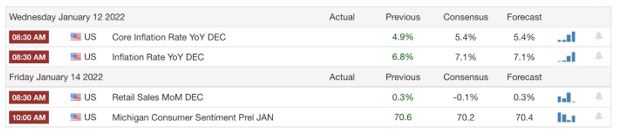
December 20, 2021

Eagle Compliance LLC wishes all of you a Merry Christmas and healthy and prosperous New Year!
Please note commentary will resume January 3, 2022.
Fear of Fed
Stock markets, especially the tech sector, got off to a jittery start ahead of the FOMC’s Wednesday announcement. Increased cases of the Omicron variant plus the ongoing supply chain disruptions were worsened Tuesday morning with a 0.8% increase in the November Producer Price Index report that translates to a 9.6% annual bump, well above consensus and Retail Sales disappointed at +0.3%.
And then…
Things changed Wednesday when he FOMC announced no change in rates but an admission by Chairman Powell that rates could be hiked as much as three times in 2022. The result was rates were unchanged, the 2/10 curve continued to flatten, and stocks rallied with the Nasdaq better by as much as 1.8%, followed later in the week by a return to fear of continued outbreaks of the Omicron variant. Renewed travel restrictions postponed or cancelled events, and concerns about the economic recovery resumed prominence.
The FOMC has two objectives, maximum employment, and price stability and with the adjusted pace of bond purchases and planned rate increases the bank is comfortable with the nations’ unemployment rate and is more focused on price increases. This doesn’t make them hawkish, just less accommodative and investors have taken note.
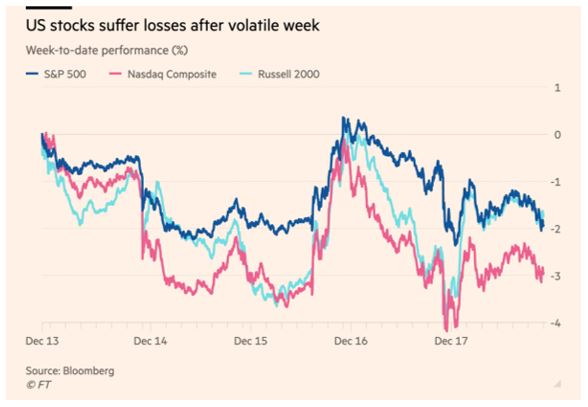
The benchmark ten-year Treasury ended the week at 1.407%, down 10 bps on the week and 49 bps higher ytd, as seen in this WSJ chart. Ironically, the 2/10 Treasury curve (+76.6 bps) is only 4 bps flatter since December 17, 2020, after widening mid-year.
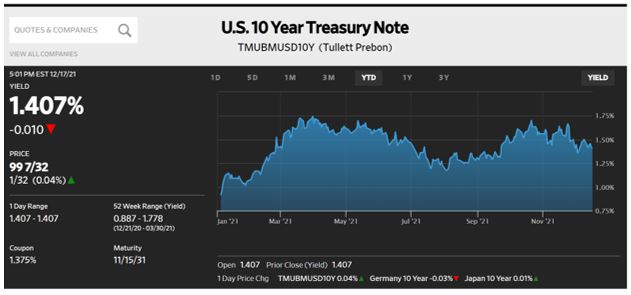
Finally
One reason the rates market did not react negatively to the changed Fed policy is because it underestimates the Fed’s projection for rate hikes. This Financial Times chart shows how rate forecasts have declined over the last month based on futures contracts for the Secured Overnight Financing Rate and Eurodollars.
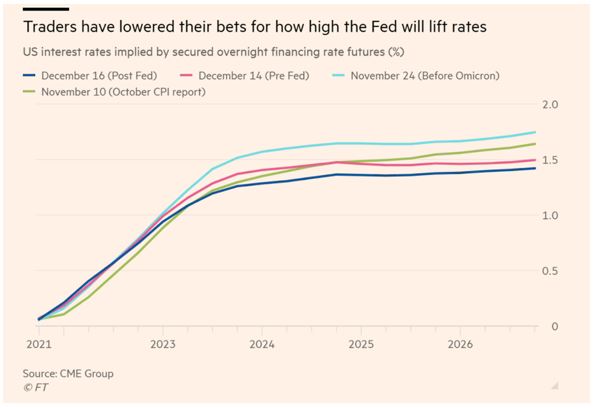
Higher rates are expected, as is a flatter curve and wider credit spreads so we will continue to track the virus that doesn’t want to end and hope the economic recovery continues as the central bank focuses on controlling inflation without incurring a recession.
The Week Ahead
Fed speak takes a holiday, a light Treasury calendar, and the Fed’s preferred inflation gauge.
Monday – Treasury sells $105 billion 13 & 26-week Bills
Wednesday – 3QGDP expected to be 2.1%
Thursday – Personal Income & Outlays (PI expected to be 0.5%; with PCE forecast at 0.6% and 5.7% y/y Durable Goods forecast as 1.6%
December 13, 2021
It’s Not Just Benchmark Rates
The SBA 504 program priced its December debentures Thursday in a market affected by the Omicron variant, inflation fears, and an expected change in Fed policy. Since the November sale the benchmark ten-year Treasury is little changed, what has changed is the slope of the 2/10 Treasury curve that is flatter by 25 bps as the market is expecting rate hikes following the Fed’s announced plan to reduce its bond buying. That change makes investors more cautious and to compensate pricing spreads in the A CMBS market have widened.
In response to an inquiry Steve Van Order, Selling Agent for the 504 program, identified the cause of this move:
- Level of T10 yield was about the same; positive
- Yield curve is trending flatter; negative
- Negative expected and actual rates volatility; negative
- Interest rate spreads wider; negative
- Heavy seasonal issuance; negative
So, the result was pricing spreads had to widen to compete with other products in the market, yet Steve added that compared to history the widening of 8 bps m/m to swaps wasn’t much. The last time the curve was this flat, in January 2020, the 25yr SBAP spread to swaps was double what it is now, and the coupon was 2.45%.
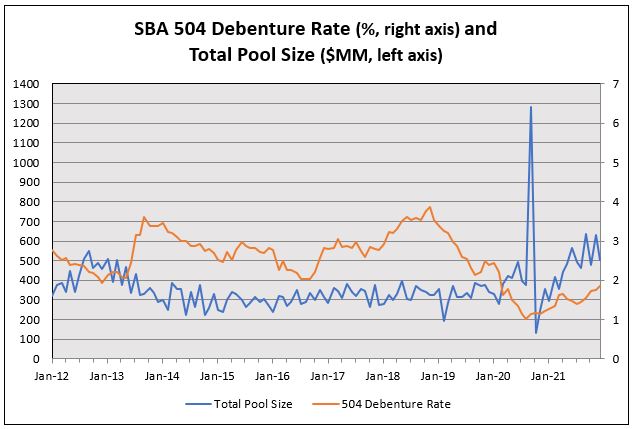
At $504,103,000 the December sale continues the program’s recovery from the drop off in October 2020 resulting from the previous month’s record sale signaling the end of P&I forgiveness from Section 1112. Recent months have seen irregular issuance amounts, but the twelve-month average is $480MM with an average 25-year debenture rate of 1.554%. Finally, with the reduced FY2022 borrower fee the 2021-25L Effective Rate for small business borrowers was 3.026%, well below prime.
Tuesday the Switch Flipped
After a modest Monday rally stock indices ended the week at or near record highs, even after Friday’s CPI report of 6.8% showed the largest y/y increase in 39-years.
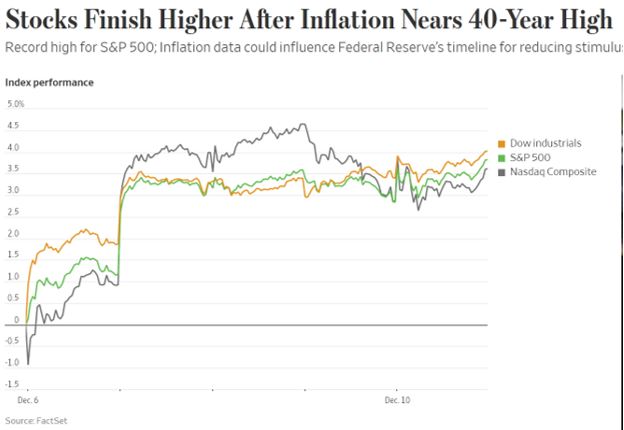
While the FOMC prepares to meet this week to formalize what is expected to be a more hawkish policy due to inflation fears, perhaps consumers are adopting the Committee’s view that inflation is transitory and will decline from these levels. Pent up demand and supply chain disruptions are identified as causes for this surge in spending as stocks and rates defy expectations.
Items of Interest
- The Atlanta Fed reports wages increased 4.3%, a strong gain but lagging inflation
- The Great Resignation continues, though the number decreased to 4.2 million workers in October from 4.4 million the previous month
- For every unemployed American there are 1.5 job openings
- Workers are bolting in record numbers, to take advantage of job openings and higher pay
The Week Ahead
FOMC meets Tuesday and Wednesday with clarity on policy expected at Wednesday’s press conference, Treasury issuance is light, A CMBS issuance remains heavy, and several consumer impacted reports.
Monday – Treasury sells $105 billion 13 & 26-week Bills
Tuesday – FOMC meeting begins, PPI final demand forecast as 0.5% and 9.2% y/y
Wednesday – SBA 504 program funds its December sale, FOMC announcement & press conference, Retail Sales consensus is 0.8%
Thursday – Industrial Production forecast at +0.6%
December 6, 2021
Loer and Flatter
As we approach the December sale date for the SBA 504 program the benchmark ten-year Treasury sits 14 bps lower than when the November debentures were priced and as Steve Van Order illustrated last week, the Treasury curve continues to flatten. The spread between the two-year and ten-year Note has flattened from +110.7 bps on November 4th to close last week at +76.2 bps, confirmation that the market expects the Fed to move on from its accommodative easy money policy and raise short-term rates while this risk-off environment creates demand for longer-dated Treasuries.
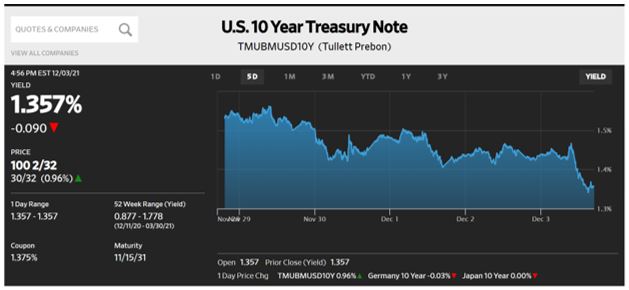
Transitory Is Moving On
For at least two-years Chairman Jay Powell has emphasized the Fed’s belief that inflation would be transitory, and the bank would even be willing to let it remain above its 2% target so that an economic recovery could be sustained by the current cheap money policy. That ended last week as the Chairman addressed several topics that will impact policy:
- Tapering of their monthly $15 billion bond purchases had been announced with an expected end date of June 2022 and now it is expected to end in March. Tapering does not mean tightening but
- Rate hikes are the sequel to the end of tapering and that may start when bond buying ends and that is what the market is expecting
Current Fed policy sets its rate target in a range of 0 - 0.25% and it is believed that rate, the rate at which banks can lend excess reserves to each other overnight, will reach 2.5% over the longer run—the same as the so-called terminal rate reached in 2018 at the end of the central bank's last cycle of rate increases.
And Then There Was Stocks
In a turbulent week that saw each session rise or decline by more than 1% stocks declined sharply on Friday under the weight of the Omicron variant’s spread and a disappointing employment report. Since discovery of the variant Nasdaq is down 4.6%.
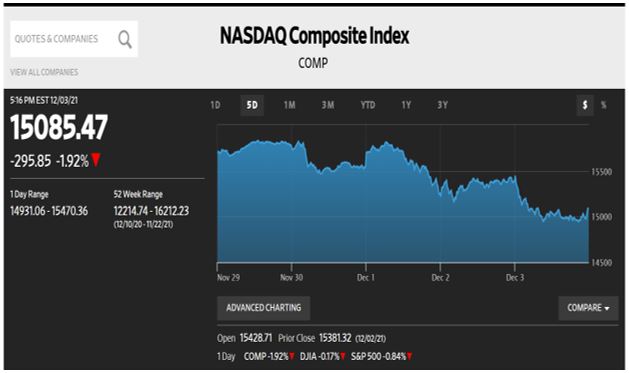
At 210,000 the jobs report was less than half what was forecast and the lower unemployment rate of 4.2% did nothing to offset that disappointment. On one level the expectation of the Fed not raising rates until March 2022 is comforting as it implies rates will remain low but recent stock market activity suggests the economy has weaknesses that will make it harder for the bank to tighten policy without impacting the economy.
Another example from this wave of risk aversion was Bitcoin, down 17% in Friday’s session alone.
The Week Ahead
Fed speak is paused during the blackout period ahead of the December 14-15 FOMC meeting, the SBA 504 program prices its 20 and 25-year December debentures, Treasury conducts its quarterly refunding, and a light week for economic reports.
Monday – Treasury sells $105 billion 13 & 26-week Bills
Tuesday – Treasury sells $54 billion 3-year Notes; SBA 504 announces its debenture sale
Wednesday – Treasury sells $36 billion 10-year Notes
Thursday – SBA 504 program prices its December debentures, Treasury sells $22 billion 3-year Bonds
Friday – Core CPI expected to be 0.5% and 4.9% y/y
November 29, 2021
Major Whipsaw Last Week
Mainly traders long volatility and haven positions had something to be thankful for by the close of markets last Friday. The tape bomb that hit about the Omicron coronavirus variant overnight Thursday made sure of that and yields fell sharply. But they got there in the volatile way now characteristic of the Treasury market.
First Came a Steep Climb in Yields
Last commentary we discussed the persistently elevated volatility in Treasury yields and last week furthered the discussion. Looking at the one-month ten-year T-note yield chart below we can see that after ending the prior week at 1.54% the yield started to lift off on Monday with President Biden’s appointment of Jerome Powell to a second term as Fed Chair (noted in red on the chart). It kept rising into Wednesday as Treasury auctioned over $150 billion of in three short- and intermediate-maturity coupons in a holiday-thinned market. On Wednesday morning the yield hit an intraday high of 1.69% (first green highlight on chart).
Then Yields Plunged Downward
But from Thursday into Friday news of the new Omicron coronavirus variant sent global markets into a full-on risk-off trade. We can see this move in the T-note yield labeled “Omicron gap” on the chart below. That was a 10 bps gap downward from the Wednesday New York close to the Friday open. The T-note yield fell yet further to 1.47% by Friday’s early close. The drop of 22 bps from 1.69% to 1.47% in about one and a half New York trading sessions was extraordinarily sharp.
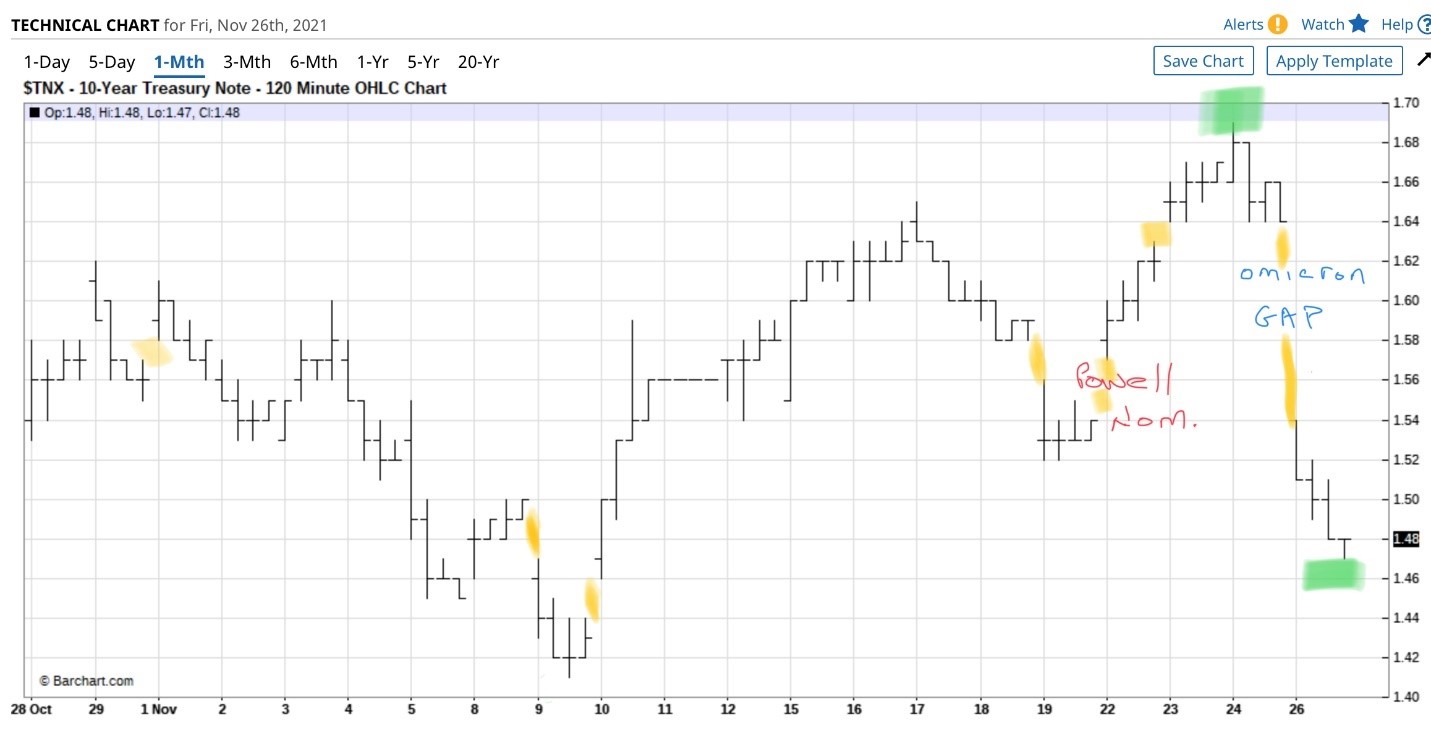
Mind the Gap
Speaking of gaps on charts, we highlighted in yellow the various gaps on the chart over the past month. Some are small and some are very large. All of these gaps are visual evidence of the choppy conditions in Treasuries made worse by relatively lower liquidity.
Sharp Indeed
Of note was the 10pt (and 53%) jump in the VIX index of expected stock price volatility as stocks fully woke up from Omicron. The already elevated MOVE index, which measures expected volatility in Treasury prices, rose 10% to the highest level since the massive spike at the start of the pandemic in March 2020. Other safe harbors such as gold and the Japanese yen rallied. Major economy stocks, economically sensitive commodities, junk bonds, EMs and cryptos sold off. The yield curve was pretty stable as were swap spreads. The FNMA current coupon MBS yield did not move so that spread to Treasury widened a good chunk.
At today’s very low coupons, longer-maturity Treasury prices are especially very sensitive to any change in yield. A downward move of 22 bps on the ten-year T-note yield results in an over two-point rise in its dollar price. Then consider that bond shops use a lot of leverage and are usually net short Treasuries to hedge spread products, and that the prices of those (long) spread products will freeze in markets like last week’s. Being on the wrong side of that Wednesday through Friday move would have been very painful.
This week the main events on the US calendar are Fed chief Powell’s speech and testimony on Monday and Tuesday, respectively, and Friday’s employment report for November.
November 22, 2021
Happy Thanksgiving!
We at Eagle wish you a peaceful Thanksgiving.

After a couple of volatile weeks, last week benchmark Treasury yields moved a bit lower in generally quiet trading. The ten-year T-note yield fell 5 bps to 1.53% and the yield curve flattened a touch. Economic data was overall better than expected. The better results are reflected in the Citigoup Economic Surprise Index that shows a good trend of stronger over weaker data surprises. That supports the somewhat less accommodative tone that has emanated from the Fed since the November FOMC meeting.
Along that line, on Friday Fed Vice Chair Clarida opened the door to a December FOMC discussion of faster taper (currently $15 billion/month) of Treasury and MBS purchases. The Fed wants to complete the taper before raising the Fed funds target range. The bond market took it pretty well, perhaps because since August bond bears have thoroughly mauled the bulls, and the bond market already leans toward faster time to wind down of QE and rate hike than the Fed has announced.
While Treasury yields and interest swap rates (i.e., “swaps”) were quiet, spreads to swaps moved out in the Agency CMBS market, the home of SBA 504 debenture pool trading. This is a seasonal phenomenon as Freddie Mac, in particular, floods the market to reach annual multifamily-backed securities issuance goals. Fannie Mae joins in this activity too. Last week Freddie floating and fixed rate classes backed by multifamily collateral. The new benchmark Freddie K A2 (SBA is compared to this ten-year WAL class) widened 5 bps to swaps versus the prior deal to clear the supply. A Fannie Mae ESG deal widened as just much versus its last deal. After a break this week the onslaught will continue.
There also will be competition from the private label CMBS and ABS markets as issuance there ramps up to wind up 2021. SBA spreads widened 5 bps m/m to swaps in the November deal. The continued new supply glut in the ACMBS market may require some further widening in December. But we have weeks to go before that wood must be chopped.
This holiday-shortened week Treasury will squeeze in a long list of auctions from Monday through Wednesday. Of most interest will be the five- and seven-year auctions as those yields are at the heart of the bear up-move in yields since August. The chart below shows the doubling of the five-year note yield since early August. That maturity, however, is broadly popular and auction results tend not to contain surprises.
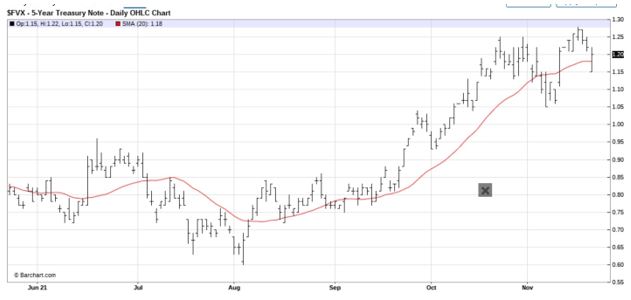
That has not been always the case with the seven-year note. Thinking way back into the ’80s, the seven-year note even then was a relatively tough sell. It lies in the no-man’s land between the very popular five- and ten-year maturities. A very weak seven-year auction several months back triggered a broad selloff in Treasuries.
A slew of economic data will be released, especially on Wednesday, Highlights will be the PCE inflation rates (overall and core), housing data, consumer confidence and durable goods sales (strong sales means more bottleneck clogs). Revised Q3 GDP data should be second tier
November 15, 2021
A Turbulent Ride in the Bond Market
The November 2021 SBA 504 debenture offering was conducted during volatile capital market conditions. Yet, if one simply observes the nearly identical SBA 504 debenture rates from October to November (separated by just 1 bp) one might think the capital markets had been dead quiet. That was far from what transpired and it is an interesting story to tell.
Over the past month there were volatile moves in longer Treasury yields, sharply higher shorter Treasury yields, and a whippy yet dramatically flatter yield curve. This all intensified during the holiday-shortened SBA debenture sale window. Yield volatility and flattening yield curve make for more challenging marketing of the 20- and 25-year maturity debenture pools. Sharply higher short-intermediate maturity Treasury yields were captured in the 41 bps increase in the 10-year SBA debenture rate from September.
To visualize the ride, in the chart below we show the intraday hi/lo and open/close levels for the benchmark 10-year T-note yield. The blue X is the 1.56% level of the T-note at the October SBA debenture pricing. The red X is the 1.50% level for the November pricing so little m/m difference. It just was fair fortune amid the volatility to have such a similar T-note yield to October to bench off for November. To wit, we highlight in yellow the wide range from 1.69% high to 1.41% low T-note yield over the past month.
Very Volatile Yield Movement
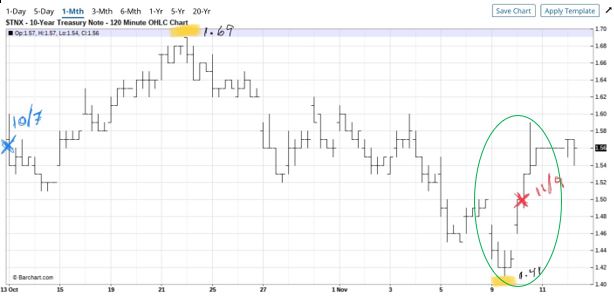
Within that turbulence was sharp intraday volatility during the November debenture offering window, captured in the green oval on the chart. When the November deal was announced at 9:30AM on November 9 the T-note yield was 1.43%. On pricing day, November 10, however, after the CPI data was released by the BLS at 8:30AM we can see that the yield gapped up. By the 10:30AM debenture pricing it was 1.50% (red X in the green circle above). We also can see it later shot up to 1.59% after a weak 1PM 30-year T-bond auction. In just one and a half trading sessions the yield ranged from 1.41% to 1.59%. That is pretty rare volatility in such a short timeframe.
We were very pleased we had quickly wrapped up marketing and placed the debentures with investors in just a few hours on that fairly calm Tuesday morning. Having the commitments of the investors to purchase the debenture pools at an agreed upon spread to Treasury pricing benchmark was crucial to smoothly navigate the market turbulence on Wednesday and obtain low loan interest rates for the borrowers.
The reasons for the unusually high volatility, sharply higher shorter Treasury yields and dramatically flatter curve were interlinked and included:
- A backdrop of globally high spot inflation rates (e.g. 6.2% y/y US CPI) and rising inflation expectations (e.g. the “5-in-5” inflation rate at record high 3.1%).
- In recent weeks, global bond markets shifted to expectations for less accommodative major central banks (Fed and ECB). After the US CPI data on Wednesday the market-implied first Fed rate hike moved forward to June from September 2022.
- In recent weeks there was forced selling by leveraged accounts in bad yield curve trades triggered after some smaller Anglosphere central banks were forced to quickly turn less accommodative after facing intense selling pressure in their government bond markets. This covering of bad curve trades flowed over to the Treasury market and helped push shorter yields higher and longer yields lower.
- Liquidity in Treasuries these days is less deep as measured by the wider gap between yields on older and new Treasury issues. Less dealer liquidity can contribute to sharp moves in yields.
- Expected volatility in the bond market moved steadily higher to an elevated level while expected stock volatility remained quiescent. This disconnect has to crack somehow and the bond market has a better record of anticipating central bank policy changes. Stocks finally did give a bit on Wednesday but recovered on Friday. The US dollar rallied as uncertainty and shorter yields rose.
- The Street ended up overbidding for the 10-year T-note auction on Tuesday which was held in front of the bearish inflation data released Wednesday morning. The Street then had to bid the 30-year bond auction in a rough market.
We can see we had about a year’s worth of drama packed into a few weeks and days.
Looking ahead the calendar is mostly second tier data releases led by retail sales, import prices and industrial production and NAHB home prices on Tuesday. On Wednesday we will have the SBA debenture funding and Housing Starts.
November 8, 2021
Less Support = Lower Rates (?)
In a week that saw the Fed confirm it would reduce its monthly purchase of bonds the benchmark ten-year Note declined 9 bps as the curve maintained its flattening trend.
This Stochchart display shows how the Note has reversed course over the last three weeks and returned to both its 50 and 200-day Moving Average, confirmation of how range bound we have been since March. The central banks of Canada and England have indicated they expect to tighten policy soon, the Reserve Bank of Australia decided not to defend a target rate on some debt and the Fed finally announced it would supply less support to the Treasury and Mortgage-Backed securities market with a rate hike expected next year. The result has been a short-lived spike in short-term rates, followed by this recent move in CT10 that leaves it 10 bps lower than when the 504 program priced its October debentures and leaving many traders offsides from the unexpected price action.
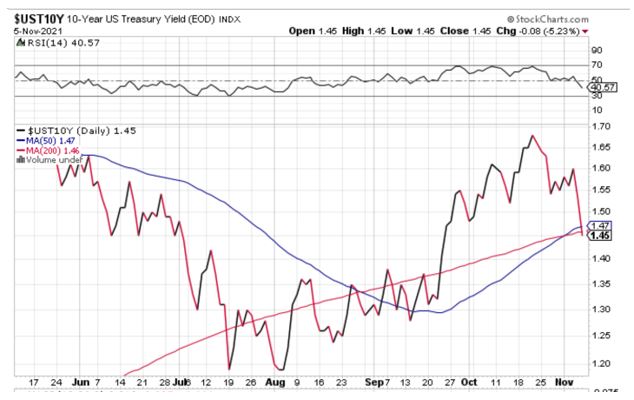
Along with the Fed announcement that will reduce purchases by $30 billion this quarter, Steve Van Order has noted that Treasury concurrently announced it would reduce Q4 issuance by $84 billion so the market will have about $54 billion fewer bonds to absorb and that also contributed to the market’s strong performance.
Stocks Also Rally
Helped by a strong jobs report and strong earnings reports stocks continue to set new records, also defying expectations. An example of that performance is 82% of the S&P 500 companies that have reported earnings this season exceeded forecasts. Higher than expected inflation, supply chain disruptions, and reduced staffing have had little impact on their performance.
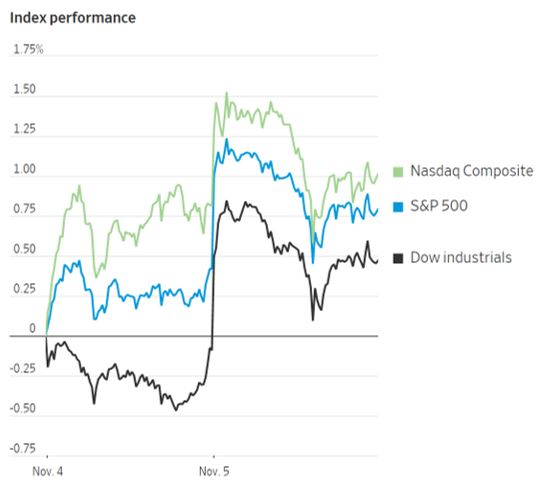
Reports
Friday’s Non-Farm Payroll report was above forecast at 531,000 with 235,000 upward revisions to previous reports. The Unemployment Rate declined to 4.6% and Average Hourly Earnings increased to 4.9% y/y.
Jobless Claims at 269,000 were a post pandemic low and Factory Orders were as expected at 0.2%.
The $1.2 trillion infrastructure package passed by Congress on Friday is expected to have a positive, though muted effect on the economy. Moody’s Analytics is quoted as saying it expects by 2031 the measure will have improved labor productivity growth by 0.03% a year.
The Week Ahead
Fed speak returns, Treasury conducts its quarterly refunding, more inflation data, and the 504 progrm prices its November debentures one day earlier than usual because of the Veterans Day holiday.
Monday – Treasury sells $105 billion 13 & 26-week Bills and $56 billion three-year Notes
Tuesday – PPI expected to be 0.6%, Treasury sells $39 billion ten-year Notes
Wednesday – CPI forecast at 0.5%, SBA 504 program prices its three November debentures, Treasury sells $25 billion thirty-year Bonds
Thursday – Veterans Day, markets are closed
Friday – University of Michigan Consumer survey forecast at 72
November 1, 2021
Central Bank Activity
In a week that saw mid-tier central banks withdraw some of their quantitative easing support, and the Fed’s preferred inflation gauge remain above target, the bond market’s reaction was atypical as rates declined and the slope of the Treasury curve flattened. An 8 bps decline in the benchmark ten-year Note puts the security at the same rate used to price the 504 program’s October sale while the slope of the 2/10 Treasury curve flattened 14 bps to +105.8 bps and 21 bps flatter than at the October pricing. That type of move belies any fears of the Fed raising short-term rates even though a Wednesday announcement is expected to confirm tapering of their bond purchases amid cautionary comments that inflation is more persistent than expected. The flattening trend also reflects traders reversing steepening trades that were expected to occur from reduced Fed buying but demand for that debt has remained strong.
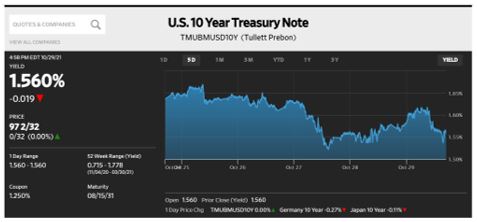
The central banks on the move are:
- Bank of Canada surprising investors Wednesday by suddenly ending its bond buying program and advancing its timeline for rate hikes
- The Reserve Bank of Australia stopped defending its target rate of 0.10% on its three year-Note only to see it decline sharply to as high as 0.80%
Both banks cited recent inflation releases that were higher than expected and reflect a probable shift to a tighter monetary policy.
Domestically, the Fed meets this Tuesday/Wednesday and is expected to reduce monthly bond purchases by $15 billion and raise short-term rates by 0.25% in 2022, yet the market seems more concerned about growth prospects going forward instead of inflation fears.
Personal Consumption Expenditures
Consumer consumption represents two-thirds of GDP and is directly affected by wages and inflation, both of which are rising the most in decades and identifies the Fed’s dilemma of controlling inflation while supporting economic growth.
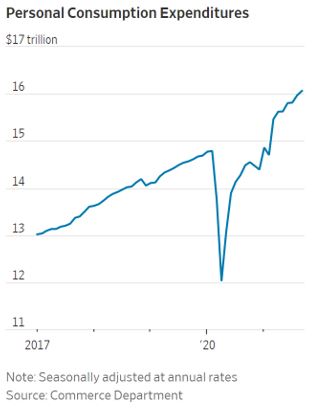
Friday’s release of the PCE inflation measure of 0.3% translates to an annual rate of 4.4% while the most recent wage gain data from the Bureau of Labor Statistics matches that rate. Another release last week was the University of Michigan’s Consumer Sentiment report showing another decline to 71.7.3 from a February 2020 high of 101. High inflation, strong wage gains and a glum mood for consumers seem to identify our recovery from the pandemic.
Other Reports
- New Home Sales came in above forecast
- Durable Goods at -0.4% were less negative than expected
- Advance 3Q GDP at 2% was below 2.7% consensus
- Personal Income was -1% vs. a forecast of -0.1%
The Week Ahead
Fed speak resumes Wednesday with Chairman Powell’s press conference, Treasury activity is light, and the jobs report is Friday.
Monday – Treasury sells $105 billion 13 & 26-week Bills
Tuesday – Treasury sells $52 billion 52-week Bills; FOMC meeting begins
Wednesday – FOMC announcement and Jay Powell press conference
Thursday – Jobless claims
Friday – Non-Farm Payroll expected to improve from September’s 194,000 figure
October 25, 2021
Operation Twist
No, not the one where the Fed sells short-term Bills to use the proceeds to buy long-term Bonds, but the way the market is changing course with higher rates that reverse course and a Treasury curve that steepens and then flattens, uncertain of the immediacy of a change in Fed policy. And the catalyst for that is persistent inflation which the Fed has believed will be transitory, but which is persistently impacting consumers.
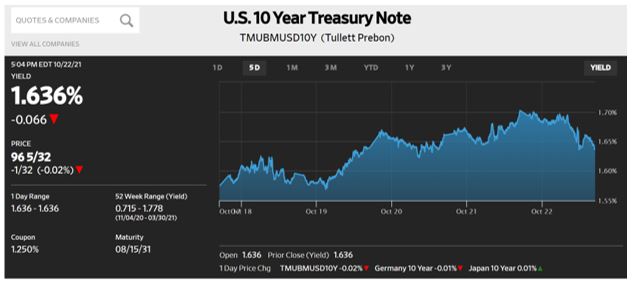
The odyssey of the benchmark ten-year Note saw it go from 1,57% to 1.70% only to close the week at 1.64% while the 2/10 curve steepened mid-week to +127 bps only to reverse course and finish just 1 bps steeper at +119 bps.
It was mentioned last week that starting next month the Fed has indicated it would reduce its monthly bond purchases by $15 billion, meaning the program would end in June and the market would be losing one of its bigger buyers. That adjustment does not mean they will tighten policy by raising short-term rates which is what would drive the curve flatter but does reflect market awareness of that development next year, as identified by the futures market.
Contributing to the inflation awareness is the ten-year Breakeven rate (nominal ten-year Treasury rate plus the ten-year TIPS rate) reaching 2.626%, its highest-level September 2012, and that may have been driven by some Fed speak by Chairman Powell: “Supply-side constraints have gotten worse, the risks are clearly now to longer and more-persistent bottlenecks, and thus to higher inflation.” So, inflation may not be transitory and full employment remains a challenge, meaning the Fed will need to be more flexible than previously thought and is a reminder that although the bank wants to be transparent it also needs to adapt to market dynamics.
Items of Interest
- Evergrande, the Chinese real estate developer did make its delayed interest payments, but two smaller developers did default on bond payments
- China’s 3QGDP declined to 4.9% from 7.9% as the government pared back stimulus, cracked down on its tech sector, and experiences problems with its supply chain, real estate valuations, and surging energy prices
- US Industrial Production disappointed at -1.3% vs. a +0.2% forecast
- Housing Starts and Permits were below consensus
- Existing Home Sales totaled 6.3M, which was the upper end of the consensus
- Jobless Claims at 290,000 were the lowest post-pandemic
To summarize, the global economy is experiencing rising energy costs, supply chain disruptions, and continued outbreaks of Covid-19 in Eastern Europe and parts of Asia. Central banks need to balance support for economies that have seen recovery, though not to pre-pandemic levels while also not letting inflation sustain itself at levels that will negatively impact consumers. That conundrum will persist as investors closely monitor reports and await the November 3 announcement from Chairman Powell to see what shape the Treasury curve will take.
The Week Ahead
No Fed speak as we enter the black-out period ahead of the November 2-3 FOMC meeting, an active Treasury calendar and more economic reports including the Fed’s preferred inflation gauge on Friday.
Monday – Treasury sells $105 billion 13 & 26-week Bills
Tuesday – Consumer Confidence Index; Treasury sells $60 billion two-year Notes
Wednesday – Durable Goods expected to be -0.7%; Treasury sells $28 billion two-year Floating Rate Notes and $61 billion five-year Notes
Thursday – Advance 3QGDP forecast at +3.0%; Jobless Claims, and Treasury sells $62 billion seven-year Notes
Friday – Personal Income & Outlays – PI expected to decline -0.1% and the raw numbers for PCE are +0.4% and +4.5% with the core (ex food & energy) at +0.2% and +3.7%
October 18, 2021
Corporate Profits and Fed Minutes
Stocks had their best week in almost three-months with the S&P 500 Index up 2% on the week with Thursday’s daily performance the best in eight-months. Stocks and bonds have been hampered by inflation concerns due to surging energy prices and supply chain disruptions that are thought to restrict companies’ ability to pass along price increases but quarterly earnings surpassed expectations.
Bond rates, as evidenced by this WSJ chart of the ten-year Note, declined on the week but rose after Friday’s stronger than expected 0.7% increase in Retail Sales. What was unusual about the week’s performance is the Minutes of the Fed’s September 21-22 meeting confirmed a stronger consensus to scale back the bank’s $120 billion monthly purchases. Plans would include reducing the purchases by $15 billion per month split proportionately between Treasuries and Mortgage-backed securities; so if they began the taper next month their purchases would end in June 2022. That news on Wednesday should have been expected to be negative for bonds but they rallied until Friday’s Retail Sales report that confirmed strong demand from consumers. That number was much stronger than the forecast of -0.1%.
Additionally, futures markets predict the Fed may raise interest rates by 0.25% by September next year which is earlier than the bank’s dot plan predicts.
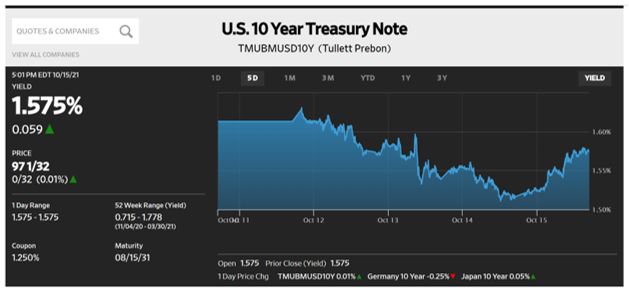
Inflation
Both reports came in as expected, confirming producers are not passing along all their cost increases, but also identifying the recent surge in energy prices. CPI numbers are higher than the Fed’s preferred gauge, Personal Consumption Expenditures, which shows y/y numbers of 4.3% and 3.6% ex food & energy, with an average slightly higher than 2% desired.
| Report | September | Y/Y | Ex food & energy | Ex food & energy Y/Y |
|---|---|---|---|---|
| CPI | 0.4% | 5.4% | 0.2% | 4% |
| PPI | 0.5% | 8.6% | 0.2% | 5.9% |
Items of Interest
- Jobless Claims at 293,000 is the first post pandemic report below 300,000
- The International Monetary Funds cautioned officials to be “very, very vigilant over rising inflation risks,” but says it is too early to be concerned about stagflation
- Confounding jobs data is 2.9% of the workforce left their jobs in August with 4.3 million workers still missing from the pre-pandemic workforce
- Social Security recipients will receive a 5.9% increase in benefits, dramatically higher than the average increase of 1.7%. This affects 70 million people who can also expect an increase in their Medicare Part B premium payments
The Week Ahead
More Fed speak, a light week for Treasury sales and reports.
Monday – Treasury sells $105 billion 13 & 26-week Bills; Industrial Production forecast at +0.2%
Tuesday – Housing Starts & Permits
Wednesday – Treasury sells $24 billion 20-year bonds
Thursday – Treasury sells $19 billion 5-year TIPS; Existing Home Sales at 6.1 million; Jobless Claims
Friday – Purchasing Managers Index flash report for services and manufacturing
October 11, 2021
Growth
That header may seem odd for a debenture sale that was smaller than the month before, but the September sale was the second largest in program history and October’s numbers were $73 million above the previous 12-month average.
This chart shows the sharp decline in funding that followed the record sale in September 2020 and how the 504 program recovered throughout FY2021 to record the second highest amount of debentures sold, $4,875,216,000. Coupled with Approved loans that are 41% greater than a year ago the program can expect to see more borrowers seeking fixed-rate loans in a recovering economy.
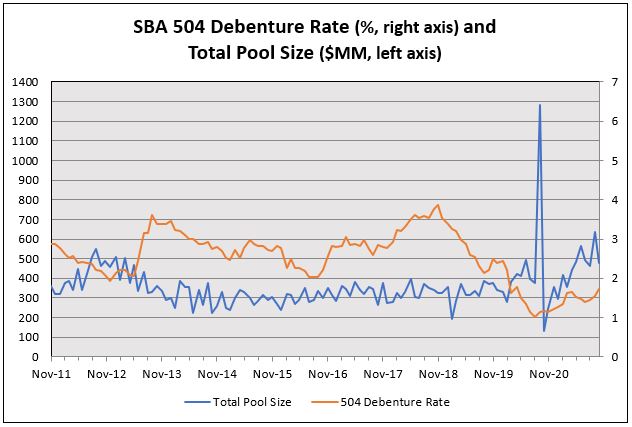
Regarding our October sale, the benchmark Treasury market had moved higher (1.557%) from its low, early pandemic levels of 0.752% when 2020-25H was priced at 1.01%. Fourteen months later the same maturity was priced at 1.74% but still offers an Effective Rate to small business borrowers below Prime, which serves as a base for alternative funding opportunities that are adjustable rate based.
| Issue | Debenture % | Ongoing Effective % | Prime % | Difference |
|---|---|---|---|---|
| 2021-20J | 1.54% | 3.021% | 3.25% | -0.229% |
| 2021-25J | 1.74% | 3.157% | 3.25% | -0.093% |
Higher Still
The Delta variant surge seems to have passed, supply chain disruptions linger, and more attention is being paid to price indexes that exclude extreme changes. For the year, CPI showed a 5.3% gain vs. the Fed’s PCE gauge of 4.3% (with a core reading of 3.6%) and CPI is what affects consumers most. An article in The Economist states that data shows pandemics usually lead to lower inflation, but history has never seen the kind of government stimulus that has been provided for Covid-19.
As much as the benchmark ten-year Note was 23 bps higher vs. the September sale it continued to rise into the end of the week, closing 20 bps above its 200-day Moving Average at 1.61%.
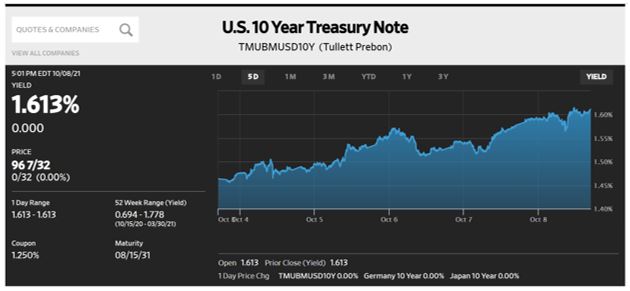
Employment
Managing full employment and inflation are the Federal Reserve Bank’s twin objectives and balancing the two may become problematic. The bank has affirmed its belief that current inflation rates will be transitory and Friday’s jobs report disappointed, even though the Unemployment Rate declined to 4.8%, driven by a smaller pool of workers as 183,000 Americans dropped out of the work force. At 194,000, jobs growth fell to the slowest pace of the year and upward revisions to July and August failed to match the forecast. That smaller pool of workers identifies women being a larger portion of that group, a decline of 1.347 million since January 2020. There are still five million fewer Americans employed than before the pandemic lockdowns, yet a National Federation of Independent Business report identifies 51% of its members still have openings they cannot fill.
A positive sign was a 4.6% growth in wages, yet that could add to inflationary pressures as that rate remains below CPI, meaning workers are not keeping pace with inflation.
Policy
The FOMC next meets November 2-3 and that may coincide with their first change of policy – tapering their bond purchases, with possible rate increases not occurring until 3Q2022 if all goes according to plan. To be determined is whether the central bank will favor supporting full employment rather than combating inflation if that proves to be more lasting as recent weaker than expected reports are giving rise to talk of stagflation, the least desirable outcome for the bank to face.
Adding to higher costs and supply shortages is a global energy crisis with Europeans facing severe shortages, some Chinese provinces rationing electricity, and domestically the average price of regular gasoline reaching $3.25 on Friday, up from $1.72 in April. These events can hamper the global economy at a time when leaders are trying curb inflation and promote green energy.
The Week Ahead
More Fed speak, the quarterly Treasury refunding, the 504 program funds its October debenture sale, and more inflation data.
Monday – Columbus Day holiday
Tuesday – Treasury sells $105 billion 13 & 26-week Bills, $58 billion three-year Notes and $38 billion ten-year Notes.
Wednesday – Treasury sells $24 billion thirty-year Bonds; the SBA 504 program closes its October sale; FOMC Minutes from the September 22 meeting, and CPI expected to be 0.3% and 5.3% y/y
Thursday – PPI forecast at 0.5% and 8.7%, another indication that producers are absorbing much of their increased cost
Friday – Retail Sales expected to decline to -0.1% from August’s strong +0.7% gain
October 4, 2021
Stocks Weaker, Treasuries Flat, Government Open
In a week where rates were expected to rise following the Fed’s hawkish tone in their September 22 announcement the benchmark ten-year Note did reach 1.55% before weakness in stocks and an agreement to temporarily extend the debt ceiling eased concern about a government shutdown. That agreement lasts until December 3 at which time it is hoped a more permanent piece of legislation can be enacted.
At 1.46% CT-10 stands 13 bps higher than when the 504 priced its September debentures while credit spreads and the slope of the curve are close to unchanged.
Confounding this move is data from the Commodity Futures Trading Commission that through September 28 fund managers added 93,00 new short contracts on ten-year Treasury futures, leaving them with the biggest net short position since September 2016. It would appear that activity was in response to Fed plans to reduce their monthly bond purchases by year-end and CT-10 has rallied 12 bps since that date
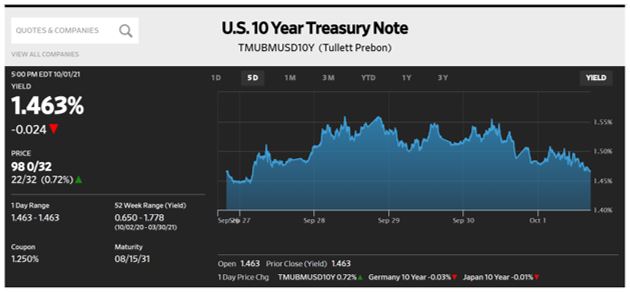
Friday’s recovery for stocks was not enough to offset a 2.2% weekly loss for the S&P 500 index which closed the month off 5%. A slowing economy, fear of inflation and a hawkish monetary policy for the Fed are reasons identified for the weakness.
Happy Anniversary
October 1st marked the 40-year anniversary of our current bull market that began after the exhausting effort to Whip Inflation Now in the 1970’s that was unsuccessful until the Fed aggressively raised interest rates. That policy led to a 15.78% rate on a 20-year Bond to clear the market on September 30, 1981, and after peaking at that level the rates market has been in a prolonged rally with the most recent 20-year auction on September 21st selling at a rate of 1.789%.
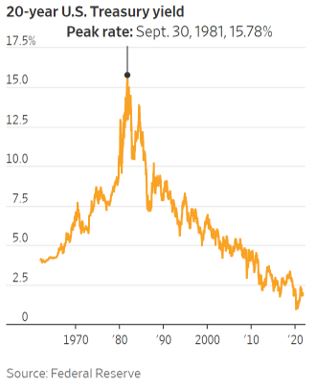
Inflation
Recent inflation readings are a big part of equity weakness as the Eurozone cited supply chain bottlenecks and a natural gas shortage as reasons for September’s rate of 3.4% being the highest level in thirteen years.
Domestically, Chairman Powell stated on Thursday that those same bottlenecks are the cause for the recent spell of higher inflation “that may last longer” than anticipated. This identifies the tension between the Fed’s two objectives of low stable inflation and high employment. If inflation were not to stabilize and the Fed became more hawkish that could negatively impact employment which remains below target.
Reports
- 2Q GDP was slightly increased to 6.7%
- Fed’s preferred inflation gauge was 0.3% and 3.6% y/y
- ISM Manufacturing remains strong, coming in at the upper end of the projected range
- Durable Goods was +1.1%
- Consumer Confidence declined to 109.8 from 114.8 in August
The Week Ahead
The SBA 504 program prices its October debentures, ongoing Fed speak, and light Treasury issuance with the jobs report on Friday.
Monday – Treasury sells $105 billion 13 & 26-week Bills; Factory Orders at +1%
Tuesday – Treasury sells $34 billion 52-week Bills; SBA 504 debenture sale announced
Thursday – SBA 504 program prices its 20 & 25-year debentures; Jobless Claims
Friday – Non-Farm Payroll forecast at 485,000
September 27, 2021
Central Bank Focus
A very quiet rates market absorbed the FOMC announcement with a shrug and then saw long-term rates spike higher on Thursday as equities recovered from Monday’s decline. Strength in equities is harder to explain with continued Delta infections and supply chain disruptions, but bond weakness can be tied to the Fed’s announcement that it expects to cut back bond purchases later this year.
The benchmark ten-year Treasury closed 11 bps higher on the week (1.47%), 14 bps above where the 504 program priced its September debentures and as this Stockscharts.com chart shows it has broken above its 50-day Moving Average based on weekly closes. The rise in rate was focused on longer-term maturities with the 2/10 Treasury curve steepening to +118.3 bps as the market will need to absorb more securities because of reduced Fed purchases.
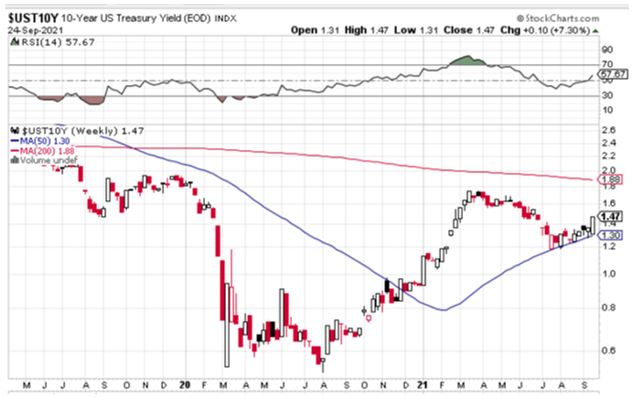
With as many as nine of the Fed Governors stating they now expect rate increases in 2022 the FOMC announcement supported such action provided the economy continues to heal, while it also reduced its GDP forecast to 5.9% from 7% previously. Another forecast that was weakened was the Unemployment rate which now is expected to be 4.8% vs. 4.5% previously.
While the FOMC did not raise rates last week Norway became the first major western country to do so since the onset of the pandemic. South Korea and Brazil followed suit as they seek to reverse their long-standing super easy money policies.
Inflation
This is the topic of most concern as even with supply chain bottlenecks analysts predict economic recovery to pre-pandemic strength. If the Fed is correct that inflation will be transitory it can pursue gradual rate increases but if inflation remains elevated, it will need to act more forcefully and possibly disrupt economic strength.
Based on research from the Organization for Economic Cooperation & Development inflation is expected to remain elevated through 2022 though it should lower to 2% for the major players of G20, like the US, UK, Germany etc. However, for smaller members of that group and for emerging market countries inflation is expected to remain above pre-pandemic levels.
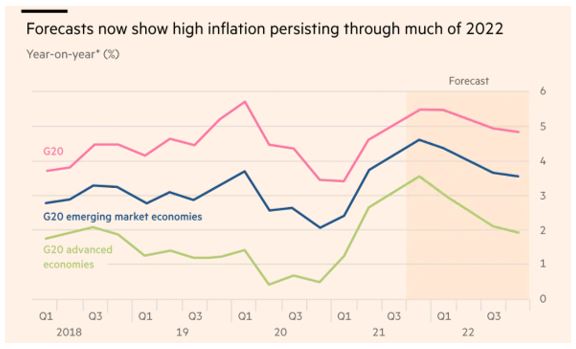
Disruption
Many sectors are experiencing volatility:
- China declared crypto-currency transactions to be illegal, causing Bitcoin to drop 12.5% last week
- Evergrande made its interest payments as scheduled but remains at risk of future default. The largest Chinese real estate developer has paused projects in a vastly overbuilt sector of the economy which represents 29% of China’s GDP. Its debt is currently trading at 28 cents on the $
- Shipping costs have increased sixfold this year and bottlenecks like 62 container ships sitting offshore at Long Beach and Los Angeles identify why shortages exist
- A potential government shutdown will be addressed with a Monday vote to extend the debt limit which will expire in October, votes that have been done in the past without a dollar limit when done by bi-partisan vote. The catch this time is that Republicans want Democrats to pass the limit using a specific dollar amount, making the bill a political issue in 2022.
Reports
In a light week for reports housing data held firm, jobless claims increased to 351,000 and Leading Indicators at +0.9% points to continued economic strength.
The Week Ahead
A heavy amount of Fed speak resumes, an active week for Treasury, and the Fed’s preferred inflation gauge on Friday.
Monday – Treasury sells $105 billion 13- & 26-week Bills, $60 billion two-year Notes, and $61 billion five-year Notes; Durable Goods forecast at 0.6%
Tuesday – Treasury sells $62 billion seven-year Notes
Wednesday – Pending Home Sales Index
Thursday – 3rd estimate of 2Q2021 GDP 6.6%, Jobless Claims
Friday – Personal Income expected to be +0.2% after a 1.1% gain in July; core Personal Consumption & Expenditures forecast at +0.2% & +3.6% y/y; ISM Manufacturing expected to remain strong near 60
September 20, 2021
Resilient or Weakening?
As always, there is more than one way to interpret economic reports and projections. Signs of slowing economic growth, increased Delta infection rates and uncertainty about central bank policy left US stocks at their lowest level in almost a month as longer-term Treasury rates inched higher.
In a week where the 504 program funded its second largest debenture sale the benchmark ten-year Treasury moved 4 bps higher from when the debentures were priced, leaving it at its 200-day Moving Average, an area where it has spent a lot of time recently.
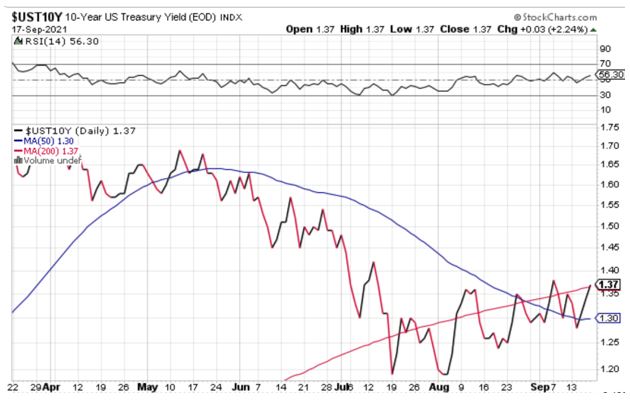
As much as Treasury rates have improved this year stocks, as viewed by the S&P 500 index, have also rallied, up 18% ytd though closing on Friday near a four-week low. Delayed office reopening’s, mask and vaccine mandates, and continued supply chain disruptions are all having an impact as reports continue to offer differing analysis.
Reports
- Industrial Production at +0.4% was weaker than consensus, possibly impacted by Hurricane Ida
- Retail Sales rose 0.7% partially reversing a revised 1.8% decline for July
- Jobless claims increased to 332,000 but remain near a pandemic low
- Retail Sales in China are +2.5% ytd, far below the expected increase of 7% and the government has clamped down on its largest real estate developer, Evergrande, that has $300 billion in debt and recently announced it would pause certain interest payments
- Production in the UK has been disrupted by soaring energy prices, with electricity costs up almost seven times y/y, forcing factories to cut bank hours or temporarily close down
- A recent surge of Covid-19 cases in Southeast Asia has jammed ports and created shortages of raw materials, adding to supply chain disruptions
Projections
The August 2021 Survey of Consumer Expectations was released by the Fed last week and it shows the median 1-year ahead inflation expectation hit 5.2%, a series high. That is in contrast to the central bank’s estimate of an average rate slightly above 2%. The report cites three categories in particular that could be responsible for the increase – gas prices at 9.2%, medical care at 9.7% and food prices at 7.2%, all things that affect daily life.
Perhaps it was this information plus the stronger than expected Retail Sales report that gave markets a whiff of inflation causing recent weakness, but this will further focus attention on Wednesday’s FOMC announcement and press conference for Chairman Powell. Expectations are for a reduction in monthly bond purchases to begin later this year but that may be conditional on the September jobs report recovering from August’s dismal level of 235,000.
The Week Ahead
No Fed speak until Wednesday, a fairly light Treasury calendar, heavier A-CMBS calendar, and no significant economic reports.
Monday – Treasury sells $105 billion 13 & 26-week Bills
Tuesday – FOMC meeting begins, Treasury sells $24 billion 20-year Bonds; Housing Starts & Permits
Wednesday – FOMC announcement and Powell press conference; Treasury sells $24 billion 2-year FRN’s; Existing Home Sales
Thursday – Treasury sells $14 billion 10-year TIPS
Friday – New Home Sales
September 13, 2021
Trends
Rates remain range bound, producer prices stay high, and the SBA 504 loan program sees issuance surge higher with the second largest sale in program history. At $635,138,000 the September sale trails only the year ago sale of $1.3 billion that represented the culmination of P&I forgiveness as directed by Section 1112 of the Cares Act and was 56% greater than the 12-month average of $406,268,000. Prospects for increased issuance are high as loan approvals through July 31 are 44% higher than a year ago and the program recently reached its authorization cap of $7.5 billion for Fiscal Year 2021. Halting approvals for the rest of this month may cause some disruption for the size of coming sales but between already approved loans and the expansion of Debt Refinance the 504 program is poised for growth.
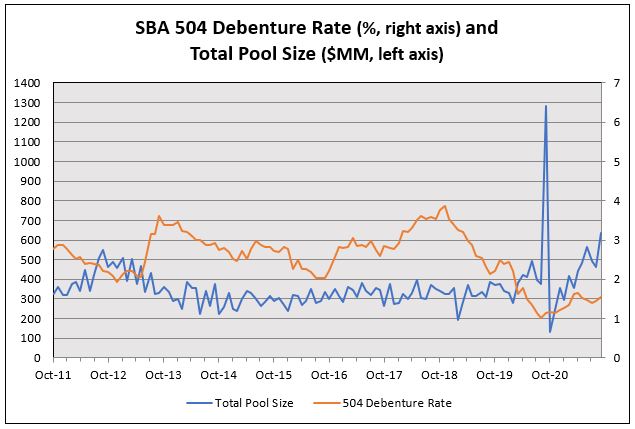
An indication of the range for rates is the debenture rate for 2021-25I was just 16 bps above that maturity’s 12-month average, and more importantly, the ongoing effective rates for both issues remain far below Prime Rate.
| Maturity | 12-month Debenture Average | September Debenture Rate | September Ongoing Effective Rate |
|---|---|---|---|
| 20-year | 1.27% | 1.38% | 2.86% |
| 25-year | 1.40% | 1.56% | 2.977% |
Economy
Analysts still look for rates to rise, especially if a significant amount of the President’s proposed $3.5 trillion infrastructure proposal is passed, yet here we are with rates only inching higher and stocks having their worst week since June as increased Covid infections and deaths dominate the headlines. After a 20% gain ytd for the S&P 500 index what is interesting about last week’s decline of 1.4% is a common explanation that stocks have not yet had a 5% correction so investors seem prepared for some continued weakness.
Much of this year’s gains are based not only on performance but projections for 2022 and many companies are reducing their forecasts because of the Delta variant and its potential impact. Return to the office plans are being paused and federal guidelines for mandatory vaccinations or testing are being met with resistance, adding to that uncertainty.
Reports last week were few:
- Jobless Claims declined to 310,000
- Producer Price Index was above consensus at +0.6% and the core was +6.7% y/y. This index continues to run higher than its CPI counterpart as producers seem unable to pass along full price increases to consumers.
- Treasury is stretched as it funds various government programs with reserves as the debt ceiling, currently at $28.5 trillion, needs to be lifted by mid-October. At risk is a partial government shutdown if a new law or at least a continuing resolution is not passed.
FOMC
As they prepare for their September 21-22 meeting the Committee is expected to address tapering their monthly bond purchase program, perhaps as early as November. This is another item in addition to potential increased issuance for infrastructure that could test the market’s appetite for more supply at these rates.
The Week Ahead
No Fed speak ahead of the September 21-22 FOMC meeting; Treasury sells only Bills and a light economic calendar.
Monday – Treasury sells $105 billion 13 & 26-week Bills
Tuesday – Core CPI expected to be +0.3% and +4.2% y/y
Wednesday – SBA 504 program funds its September sale
Thursday – Retail Sales expected to be -0.8%
Friday – Consumer Sentiment expected to improve from August’s sharp decline
September 7, 2021
Taper on Hold?
There have been several conflicting topics that are driving the economy, the markets and Fed policy – the surge in Covid-19 variants, inflation, and an expected tapering of the Fed’s Quantitative Easing policy. Before exploring the latter two it is important to note the significance of the spike in infections that is causing concern for consumer confidence, retail sales and a full return to the workplace and school. This WSJ chart shows the spike in daily new cases from a recent low of 11,000 cases on June 21 to August 31’s level of 156,000. Hospitals are overwhelmed with unvaccinated people as even mask mandates are met with resistance.
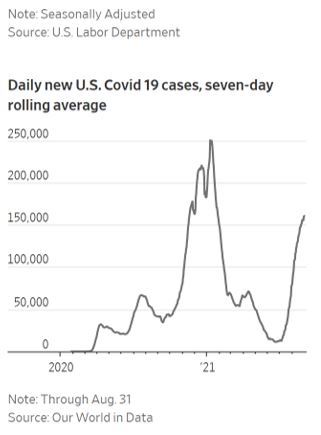
While companies have recovered most of the jobs lost to the pandemic there are 5.3 million fewer workers than in February 2020. Responsibility for that gap is being attributed to the virus outbreaks that are discouraging job seekers and probably led to Friday’s disappointing report. Following gains of one million on average for the previous two months the August number of 235,000 was far below consensus and may cause the Fed to be more cautious about cutting back on their bond purchases. Positive take-aways from the report were a pandemic low unemployment rate of 5.2% and a 4.3% wage gain from a year ago.
The economic downturn starting in 2020 has improved but has had an impact on Social Security as the program expects to make payments in excess of its revenue this year and for its reserves to be depleted by 2034. As a result of inflation its Cost-of-Living Allowance is expected to increase by as much as 6% for 2022, further pressuring its solvency.
Regarding Treasury supply, the failure to increase the debt ceiling in July has reduced the amount of short-term Treasury issuance by about $900 billion, lowering the yield on these securities that Money Market funds depend on for investments. The result is lack of supply with 12-month T-Bills yielding just 0.06%, leaving the funds stretched for income and having to cut expenses.
Markets
In the rates market the 504 program’s September debenture sale is scheduled for Thursday with the benchmark ten-year Note 11 bps higher m/m and just slightly above its 50-day Moving Average. As we begin the fourth quarter Steve Van Order reports credit spreads are firm with the market anticipating an increase in issuance.
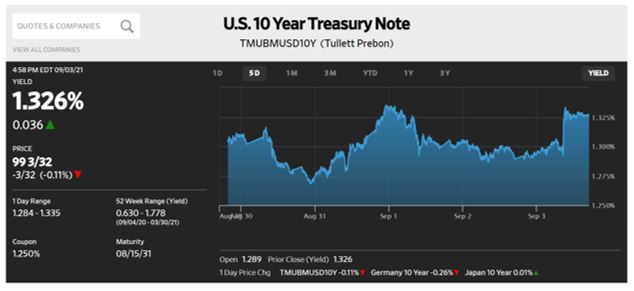
Equities were mostly quiet for the week with the Nasdaq performing best, up 1.5%. Certain name and sector trends stood out – Zoom declined 17% on Tuesday as there is skepticism the company can sustain growth if workers return to the office (a big if); while airlines weakened as travelers fear restrictions may resume soon.
So, rates remain lower than expected, economic reports are mixed, and stocks continue to inch higher as the FOMC prepares to meet again on September 21-22.
The Week Ahead
The SBA 504 program prices its September 10, 20 and 25-year debentures, Treasury conducts its quarterly refunding, and a light calendar of reports and Fed speak.
Tuesday – Treasury sells $105 billion 13 & 26 week-Bills and $58 billion 3-year Notes; 504 program announces its debenture sales
Wednesday – Treasury sells $41 billion 10-year Notes
Thursday – 504 program prices its debentures; Treasury auction $24 billion 30-year Bonds
Friday – PPI forecast at +0.5%
August 30, 2021
Virtually Jackson Hole
In a week where new debt issuance was easily absorbed, markets showed little reaction to concerns over the Afghan evacuations and focused instead on comments from Fed Chairman Jay Powell. For the second consecutive year the Federal Reserve Bank of Kansas City’s Symposium was held virtually, a telling comment on the status of our business lives as we deal with a recovering economy, high inflation, and a surge in Covid-19 variant infections.
Chairman Powell’s speech at the conclusion of the conference touched on those key items:
- The central bank’s plan to begin reversing its easy money policy later this year was reaffirmed. Their next meeting is September 21-22, and it is believed tapering their $120 billion monthly purchases could begin by November as there should be more clarity about raising the debt limit by late October. Mr. Powell did make clear that ending this support will not lead directly to a tighter money policy as any decision on that will be further into the future.
- The recent surge in inflation is expected to fade over time. Friday’s release of the Fed’s preferred inflation gauge showed its core index holding at 3.6% y/y.
- It was noted that since the FOMC’s July meeting there has been progress in employment, but concern was expressed about the increased spread of infections as it is already resulting in restricted travel and leisure activities.
Reports
Reflecting the push/pull effect that is taking place in the economy is the 1.1% increase in Personal Income that was helped by families receiving tax credits of up to $1,600 per child as part of the $1.9 trillion pandemic relief package passed earlier this year. At the same time the Commerce Department reported that consumer spending slowed 0.3% while savings were increased, confirming the recent decline in consumer confidence that is attributable to increased infections.
Durable Goods orders declined 0.1% after recording gains in 13 of the previous 15 months. Regarding inflation the Office of Management & Budget expects inflation to increase 4.8% in the fourth quarter, up sharply from the administration’s 2% forecast in May. Echoing the Fed’s belief that inflation will be transitory OMB’s forecast for 4Q2022 does show a reduced level of 2.5%.
Rates
As seen in the stockcharts.com chart below the benchmark ten-year Treasury wobbled a bit on Thursday as the market processed the less than popular 7-year Treasury auction but recovered on Friday after Mr. Powell’s comments. The 1.31% rate is 9 bps above where the 504 program priced its August debentures and sits just 2 bps below the security’s 50 and 200-day Moving Averages.
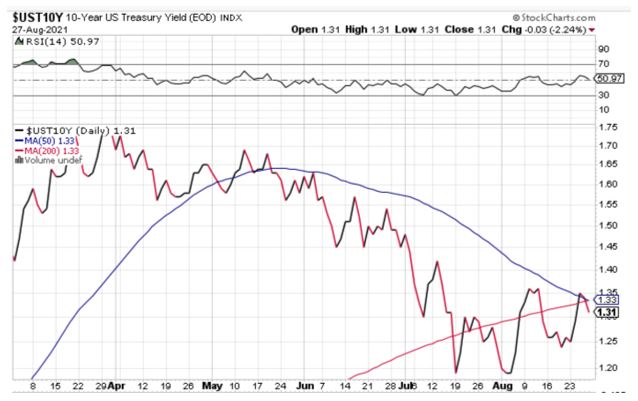
Stocks
The S&P 500 and Nasdaq markets both closed at record highs, also comforted by Mr. Powell’s comments. For the year the S&P is higher by 21%, defying predictions of inflated price/earnings ratios, yet a pile of cash sits on the sidelines, A Market Watch report identifies the top 25 Private Equity firms are holding $509.8 billion in uninvested cash, 22.3% of their total deposits. FOMO does not seem to apply here.
The Week Ahead
Traditional Fes speak resumes with the jobs report on Friday being the most significant report with a light Treasury calendar.
Monday – Treasury auctions $105 billion 13 & 26-week Bills
Tuesday – Consumer Confidence index may trend lower like Consumer Sentiment did
Wednesday – ISM Manufacturing expected to remain strong
Thursday – Jobless Claims projected at 350,000
Friday – Non-Farm Payroll consensus is 740,000
August 23, 2021
Flatter
As the SBA 504 loan program approaches its September debenture sales the Treasury market continues to mark time as it balances a potential reduction of Fed purchases with the possibility of reduced Treasury issuance while also monitoring what is hoped to be a transitory increase in inflation. One measure that has changed has been the slope of the Treasury curve and as this WSJ chart indicates investors seem confident they have a handle on Fed policy as the spread between the 5-year and 30-year Treasury rates declined sharply since mid-year when the Fed declared after its June meeting it would have less tolerance with inflation exceeding 2%. For now, the Fed continues to purchase $120 billion Treasury and Agency Mortgage-backed securities each month while Treasury sees increased tax receipts that reduce the need for more bond issuance. It is believed the Fed will not change its zero-interest rate policy until it completes its bond buying so this willingness to buy long-term debt by investors probably indicates they have concern not only about increased Covid-19 infections affecting the economy but also are prepared for the eventual policy change by the central bank.
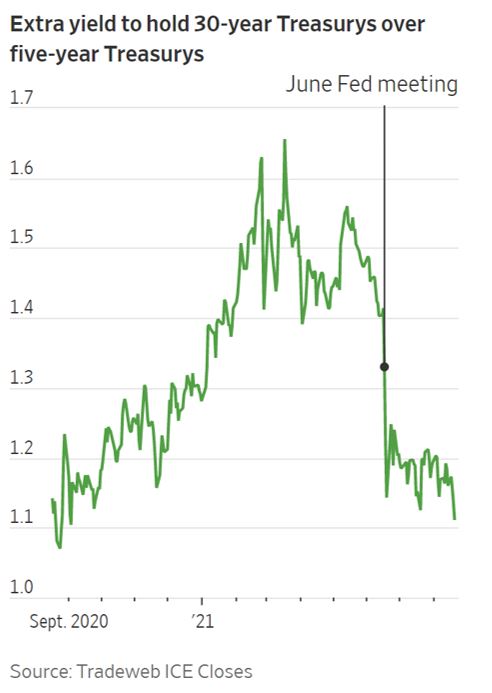
Rates
With news coverage focused on the Afghan evacuations the rates market was flat on the week with the ten-year benchmark closing at 1.26%, just 6 bps higher than when the 504 program priced its August debentures eighteen days ago. The low rates continue to make the 504 loan program attractive as small business borrowers can lock in fixed-rate funding for as long as 25-years. Steve Van Order points out that if using the Morgan Stanley 1st rate of 4% and a 2.8% 504 Effective Rate the 50/40 blended rate of about 3.5% is significantly lower than what is available from other sources.
Supply & Demand
Boston Fed President Eric Rosengren was quoted by the Financial Times as supporting a “taper” to the Fed’s purchases this autumn and ending the program by mid-year 2022. His rationale is that bond buying “is not the right remedy in an environment of severe shortages of essential materials and workers.” Unlike 2008 when the Fed faced a lack of demand now there is a lack of supply, meaning the demand created by the Fed’s Quantitative Easing is no longer appropriate. The surge pricing that has developed in housing and used cars is indicative of low rates and lack of supply but does little for solving high unemployment.
Such a change this year was identified in Wednesday’s release of the Minutes from the Fed’s July 27-28 meeting and the topic may be addressed at the Federal Reserve Bank’s Jackson Hole Symposium this week.
Other Items
- Stocks rallied Friday but closed down slightly for the week as increasing infection rates are causing concern
- Retail Sales at -1.1% was greater than its forecast of -0.2%
- Industrial Production was +0.9%
- Jobless claims were lower at 348,000
- One impact of inflation running higher than the Fed’s 2% sustained average is the 2022 COLA for Social Security recipients is expected to show the largest increase since 1982, The Senior Citizens League predicts an increase of 6.2% while Moody’s estimate is a more reserved 4.6%, which may not cover the increased Medicare Part B premium cost.
The Week Ahead
Fed speak will be centered on the Jackson Hole conference, Treasury issuance is active, an update on 2QGDP, and the Fed’s preferred inflation gauge on Friday.
Monday – Treasury to sell $105B 13 & 26-week Bills; PMI Composite Flash expected to show continued strength
Tuesday – Treasury to sell $60 billion 2-year Notes
Wednesday – Durable Goods expected to be -0.4%; Treasury to sell $26 billion 2-year FRN’s and $61 billion 5-year Notes
Thursday – Treasury to sell $62 billion 7-year Notes
Friday – 2QGDP expected to be +6.6%; Personal Income (+0.3%) plus Personal Consumption Expenditures core at 0.3% and 3.6% y/y
August 16, 2021
Resilient
Neither supply, nor concerns of reduced Fed buying, nor strong corporate profits have been able to raise concerns over reflation. After pushing as high a 1.37% during the Treasury’s quarterly refunding auctions the benchmark ten-year Treasury closed the week unchanged once Thursday’s auction of $27 billion thirty-year bonds cleared the market.
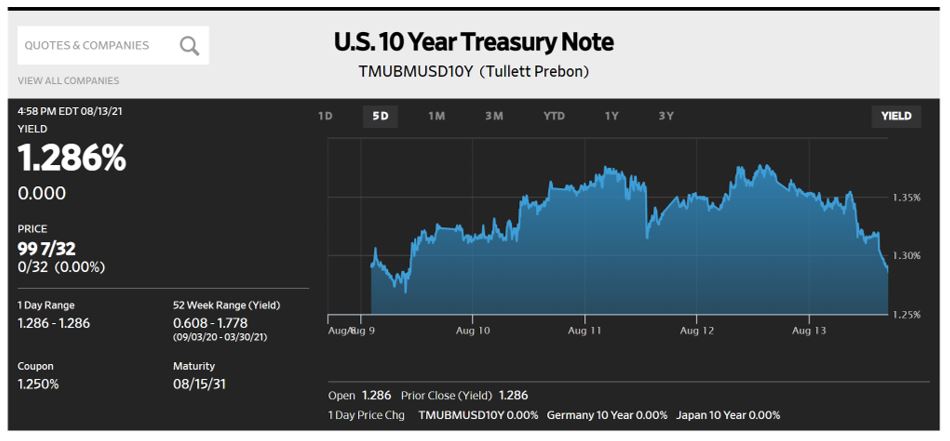
Also helping the improved price action was Friday’s report of sharply reduced Consumer sentiment, declining 13.5% on the month as consumers reflected their concerns over the spread of the Delta variant. This reading is below its level from the early pandemic period of April 2020 and matches its reading during the financial crisis of 2008.
Stocks
The DJIA and S&P 500 continue to grind higher while the Nasdaq underperforms as many tech stocks underperform. Just as analysts still expect interest rates to rise (to a revised level of 1.80% by year-end, down from previous 2.0% estimates) stocks are viewed as over-priced, yet here we are.
Reports
- Inflation was mentioned earlier and while CPI came in as forecast, ex food & energy at 0.3% and 4.3% y/y, PPI was much higher at 1% and 6.2%.
- Jobless claims were lower at 375,000.
- The budget deficit narrowed to $2.5 trillion for the first ten-months of the fiscal year. Federal revenues rose 18% from the same period a year ago to a record $3.7 trillion, largely due to higher receipts from individual and corporate income taxes. This performance does support elevated stock prices as even with concerns over the Delta variant affecting consumer confidence the economy is reopening, cautiously.
More Jobs than Workers
This WSJ chart shows how the 8.7 million unemployed American worker figure is surpassed by the number of available jobs, a reflection of a tight labor market. Whether or not it is pandemic blues or lack of qualifications employers continue to offer increased wages plus signing and retention bonuses in hopes of attracting and keeping employees as companies once again modify their return to the office plans due to the spike in infections. Restart dates of early September are already being pushed back as a work from home mindset remains strong and cities grapple with managing school curriculums.
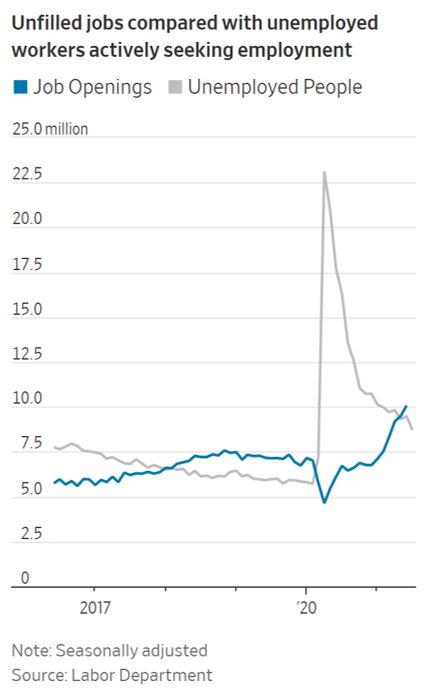
The Week Ahead
Fed speak continues, a light calendar for economic reports and Treasury sales, plus Minutes form the Fed’s July 28 meeting as analysts speculate about bond tapering.
Monday – Treasury sells $105 billion 13 & 26-week Bills
Tuesday – Industrial Production forecast at +0.5%
Wednesday – Treasury sells $27 billion twenty-year Bonds; Minutes from the July 28 FOMC meeting
Thursday – Treasury sells $8 billion thirty-year Treasury Inflation Protected Securities, currently yielding -0.31%; Jobless Claims are released
Friday – nothing scheduled
August 9, 2021
Rates Remain Low
As the rates market continued to defy expectations allowing the 504 program to price its August debentures at rates below 1.50% for the third consecutive month the program is poised to benefit from the Interim Final Rule for SBA Debt Refinancing that became effective July 29th. The below chart shows the ongoing Effective Rates for 2021-20H (2.748%) and 2021-25H (2.866%) to both be well below Prime which serves as the base for most adjustable-rate loans. The ability for existing 504 borrowers to refinance without expansion as well as borrowers in other federally guaranteed programs to access 25-year fixed rate money to improve cash flow is a significant step for the 504 program. Coupled with a ytd increase of 37% in approved loans the program is poised for growth. It is noted that recent Effective Rates have inched higher as the benchmark Treasury has declined and that represents investor’s seeking increased credit spread due to the low benchmark rate. Steve Van Order, Selling Agent for the program reports the Underwriters saw increased customer participation for the debentures which bodes well for expected increased size in future months.
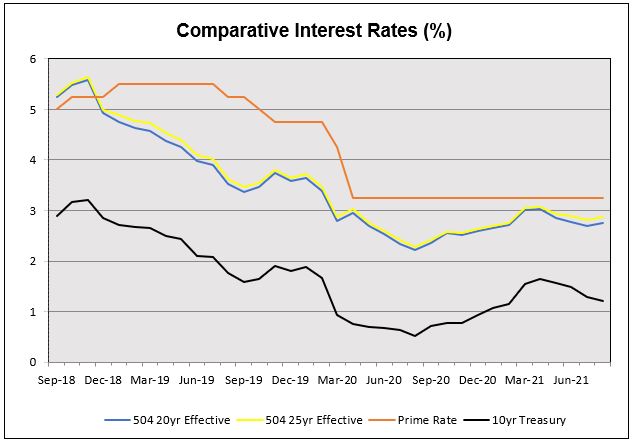
And it comes at a time when the economy continues to show strength, as evidenced by Friday’s jobs report that showed a gain of 943,000, its largest in eleven months.
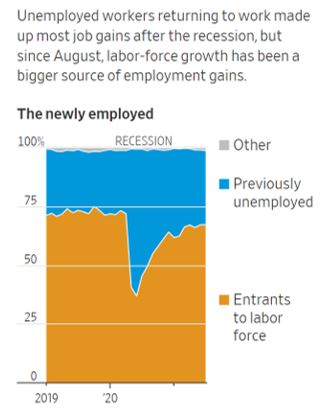
A positive part of the report showed growth in entrants to the labor force which drove down the Unemployment rate below expectations to 5.4% and the impact of this report was to move rates higher as the benchmark ten-year Note closed 10 bps higher than it was on Thursday when the August debentures were priced. It is this type of rate movement that makes investors cautious in an economy that is regaining force as it battles increased cases of the Delta variant.
An interesting component of the report showed employment at public schools rising by 221,000, likely a result of increased summer programs to help students affected by virtual learning during the regular school year.
Additionally, average hourly earnings showed a y/y increase of 4%.
Other Items of Interest
- While there are expectations the Fed may taper their $120 billion of monthly purchases the European Central Bank increased its bond purchases to $87 billion through July
- The Fed will have one more jobs report before its September 21-22 meeting where tapering is expected to be discussed and an offset to that reduced support is the possibility Treasury may reduce debt issuance in the coming quarter as funding needs for economic relief are easing
- A Federal Reserve Bank of NY report showed household debt increased 2.1% in 2Q2021, the largest notional increase since 2007. Yet another indicator of economic strength along with increased earnings and reduced unemployment
- Stocks continue to be helped by strong corporate earnings and close the week near record highs
The Week Ahead
More Fed speak, a heavy Treasury calendar with its quarterly refunding, more inflation data and the 504 program funds its August debenture sale.
Monday – Treasury sells $105 billion 13 & 26-week Bills
Tuesday – Treasury sells $58 billion three-year Notes
Wednesday – Treasury sells $41 billion ten-year Notes; CPI ex food & energy expected to be 0.4% and 4.3% y/y; August DCPC sale closes
Thursday – Treasury sells $27 billion thirty-year Bonds; Final Demand PPI ex food & energy forecast at 0.5% and 5.6% y/y
Friday – Consumer sentiment expected to be flat
August 2, 2021
Lower Rates and Lower Stocks
A months long rally in stocks continued to weaken as it appears an economic recovery is slowing down from record levels, assisted by increased cases of the Delta variant, rally exhaustion, and China’s crackdown on tech companies. An indication of how difficult it may be to achieve higher prices is Amazon’s Thursday report after the close showed a profit of $30 billion, with sales slightly below forecast and its stock sold off almost 7%.
Though down for the week US stock indexes held onto modest gains for the month of as much as 2%.
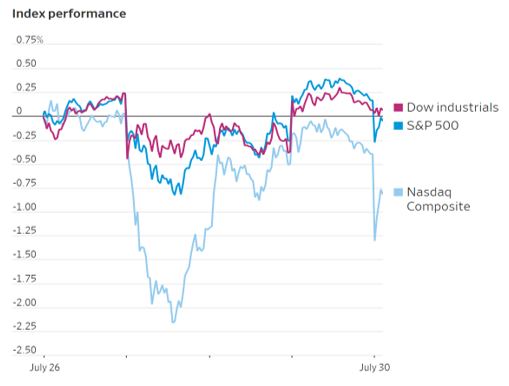
FOMC
In a week where Treasury supply was well distributed and economic reports were mostly at consensus the minutes of the Fed’s June meeting were a focal point. With employment making good progress toward its goals the Committee seems ready to address tapering its bond purchases. At $120 billion per month the bank has supported both the Treasury and Mortgage-backed market by purchasing more than $2 trillion of debt while holding interest rate near zero since March 2020. In his news conference Chairman Powell said that “raising interest rates is not on our radar screen right now” but with an improving economy they could inch closer to less bond buying. Their next meeting is not until September 21-22 so they will have ample time to assess further progress.
Rates
Grinding lower is the best way I can describe the recent performance of the Treasury market as last week’s significant supply was easily managed. The benchmark ten-year Note was 5 bps lower on the week and from when the 504 program priced its July debentures, yet investors remain skeptical about this trend continuing. With a possible reduction in Fed purchases, elevated inflation and a GDP report that slightly exceeded pre-pandemic levels it will be interesting if the economy can overcome the impact of the Delta variant. As the 504 program approaches this week’s sale, we note lower Treasury rates with swap spreads and credit spreads that have widened as investors require more yield to compensate for the unexpectedly low benchmark rate.
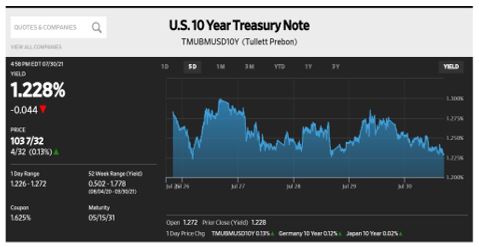
Reports
Reports were mostly positive with new home sales and Durable Goods orders below consensus, and the Fed’s favorite inflation gauge remains well above its 2% average target. Regarding inflation, market participants appear to agree with the FOMC opinion that it will be transitory as the ten-year breakeven rate for Treasuries is 2.43%, meaning traders are pricing in a moderation of inflation in coming years.
- New Homes Sales of 675,000 were far below consensus of 800,000
- Durable Goods was +0.8% vs. a forecast of +2.1%
- Jobless Claims inched higher at 400,000
- Personal Income was +0.1% after last month’s 2.1% decline
- Personal Consumption & Expenditures was slightly below forecast at +0.4% and +3.5% y/y
The Week Ahead
A very light week for Treasury issuance, Fed speak picks up, the 504 program prices its August debentures, and the jobs report.
Monday – Treasury auctions $105 billion 13 & 26-week Bills; ISM Manufacturing index expected to remain stable
Tuesday – SBA 504 program announces its August Debenture sale
Thursday – SBA 504 program prices its 20 and 25-year August
Friday – Non-Farm Payroll for July consensus is a gain of 900,000 with a decline from June’s 5.9% unemployment rate
July 26, 2021
Resilient Markets
Last week had a weird start – Treasury rates broke through resistance levels and stocks sold off sharply, mostly because of renewed concerns about the Covid variant. From Tuesday on saw a reversal for both markets as focus turned once again to the economic recovery, strong corporate earnings, and super easy monetary policy. All three remain in play with central bank support the key, and we will get an update on that Wednesday at the conclusion of the FOMC meeting.
With expectations of a record GDP to be reported this week continued strength in stocks is not a surprise as evidenced by the DJIA closing above 35,000 for the first time as all three major indices recovered from Monday’s volatile 2% selloff. Stellar earnings were identified as a driving force in their rebound as 85% of the roughly 110 companies in the S&P 500 that have reported second quarter earnings have exceeded analyst forecasts.
Additionally, according to data from Refinitiv Lipper investors world-wide has put more than $900 billion into US mutual and exchange funds this year, a record level going back to 1992.
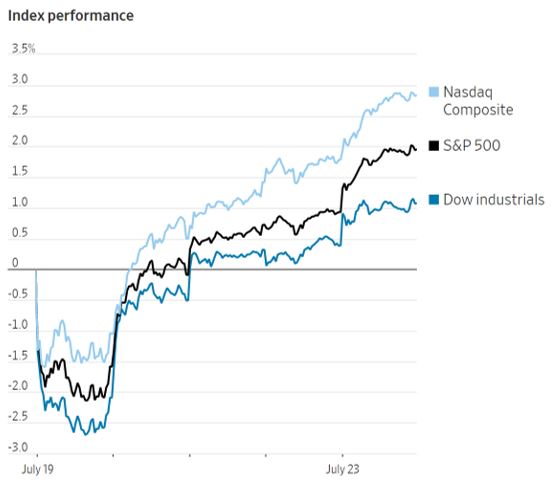
Treasury rates dropped as low as 1.13% intraday on the ten-year benchmark before easing off to close the week unchanged at 1.28%. The previous week’s resistance level of 1.26% was smashed before bond bears reestablished control in a security that in late March appeared to be on its way to 2%. Many forecasts continue to call for a rise in rate, but the market has resisted that call since the US market is relatively attractive with $16 trillion of global debt trading at negative yields.
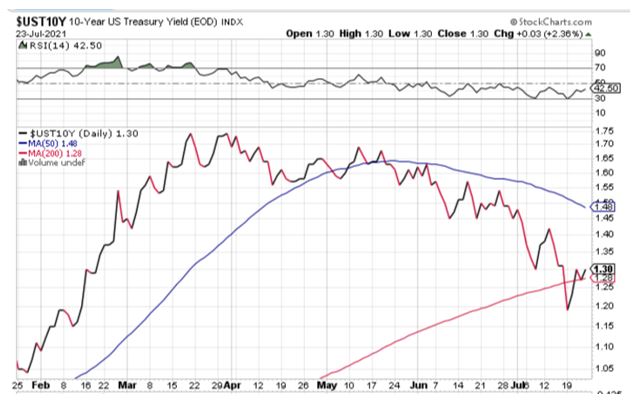
What is of most interest to small business borrowers is this contradictory performance that has seen the 504-program price its last two twenty-five-year Debentures below 1.5% with 2021-25G offering an ongoing effective cost of 2.88%. That cost is below Prime and significantly below adjustable-rate loans that use Prime as a benchmark. In addition to low rates as we approach the August sale the last four sales have averaged $495MM, an indication the program has recovered from the hangover of last September’s record sale that fast-tracked loans to qualify for P&I forgiveness. With loan approvals scoring a fiscal year increase of 37% and Debt Refinance parameters about to be extended the program is poised for more growth.
Reports
It was a light week for reports with Jobless Claims reversing trend to increase to 419,000 while Leading Indicators at 0.7% were below forecast as was the Purchasing Managers Index that was 7% below consensus.
The Week Ahead
Fed speak resumes with Chairman Powell’s Wednesday press conference at the conclusion of the FOMC meeting, an active Treasury calendar totaling $316 billion, and we see if the rates market can continue to endure elevated inflation numbers with Friday’s Personal Consumption & Expenditures report.
Monday – New Home Sales look to rebound; Treasury sells $105 billion 13 & 26-week Bills and $60 billion two-year Notes
Tuesday – Durable Goods forecast at 2.1%; Treasury sells $61 billion five-year Notes
Wednesday – Treasury sells $28 billion two-year Floating Rate Notes
Thursday – 1st estimate of 2Q GDP is 8%; Treasury sells $62 billion of seven-year Notes
Friday – Personal Income consensus is -0.7% with core PCE at 0.5% and 3.7% y/y
July 19, 2021
No One Knows Why
Bond prices don’t react well to inflation yet in a week that saw continued spikes in inflation data the only setback for bond prices was because of long-term Treasury debt being auctioned mid-week. In an active week for Treasury supply, Fed speak and inflation data the Treasury market continued its relentless and unexpected move to lower rates.
This WSJ chart for the ten-year benchmark shows the 10 bps spike in rate after Tuesday’s 30-year bond auction was not well received.
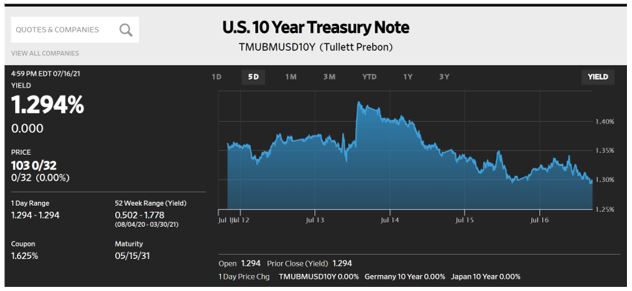
That move had little to do with earlier reports showing inflation accelerated in June at its fastest pace in 13-years. The below chart from the Bureau of Labor Statistics shows CPI rising 5.4% in June while the core index, excluding the volatile food & energy measures, rose 4.5% on the year.
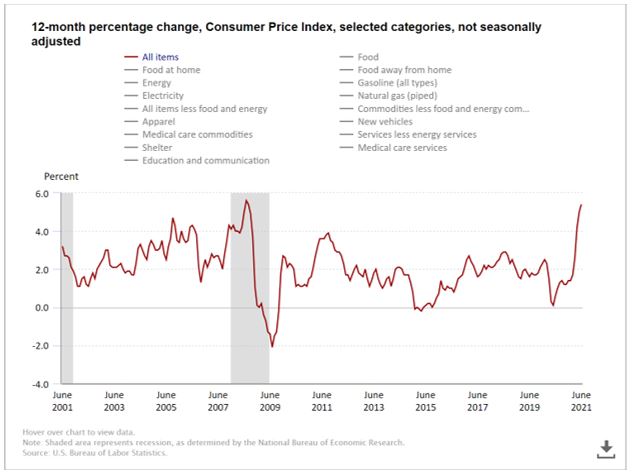
As if those numbers were not strong enough, they were followed by the Producer Price Index report that also was above consensus at +1% and +5.6% y/y for the core numbers. Driving the increase for consumers was a 10.5% increase for cars and trucks which are in short supply due to chip shortages, a function of the supply chain breakdown. This component alone represented one third of the increase.
That brings us to the most pertinent of last week’s Fed speak, Chairman Powell’s congressional testimony where he admitted “inflation has been higher than we’ve expected and a little bit more persistent” but he repeatedly emphasized the Fed expects inflation to ease later this year. Additionally, he does not see the bank paring its $120 billion monthly purchases of Treasury and Mortgage-backed securities any time soon.
So, some takeaways from last week are:
- The market didn’t like 30-year debt at auction time but its redistribution at higher rates found buyers
- Contrary to conventional wisdom the market seems unconcerned about inflation’s impact on bond rates
- The 10-year Treasury benchmark moves closer to its 200-day Moving Average of 1.26% which should provide some resistance
- Stocks ended their three-week winning streak with moderate losses for the week
Other Reports
- Retail Sales came in stronger than expected, +0.6% vs. a -0.4% consensus
- Industrial Production was +0.4%, slightly weaker than forecast and still below pre-pandemic levels
- Jobless claims continue to decline, 360,000
The Federal Reserve Bank of NY released its Survey of Consumer Expectations, showing higher expectations for the year ahead. This is an internet-based survey of approximately 1300 household heads using the same individuals each month.
- Median year-ahead inflation of 4.8%
- Median home price change of 6.2%
- Median college education cost increase of 7%
- Median medical cost increase of 9.4%
- Median rent increase cost of 9.7%
- Median year-ahead expectations of household income rose to 3.0%
The Week Ahead
No Fed speak ahead of their July 27-28 meeting, relatively light Treasury calendar and some housing data.
Monday – Treasury sells $105 billion 13 & 26-week Bills
Tuesday – Housing Starts & Permits
Wednesday – Treasury sells $24 billion 20-year Bonds
Thursday – Treasury sells $16 billion 10-year TIPS; Existing Home Sales
Friday – PMI Composite Flash
July 12, 2021
It’s Always Something
Out of nowhere, concern about labor shortages, supply chain disruption, and Covid-19 variants surfaced Thursday morning lowering stock prices and bond yields and rewarding contrarians. Of particular benefit was the 504 program’s pricing of its July debentures that used a benchmark ten-year rate of 1.29%, 20 bps lower than for the June sale and matching its lowest level since February 18. That move eased back a bit on Friday as the Note closed at 1.36% and equities gained outgained Thursday’s loss.
The below chart has everything moving in the right direction – long term debenture rates remain below 1.50% and issue size, though lower than in June still approximates the fiscal year’s monthly average.
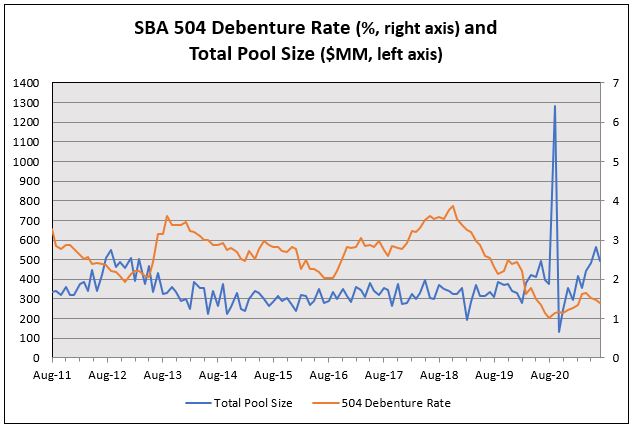
Another trend that impacts 504 debenture rates is the slope of the Treasury curve as measured by the spread between two-year and ten-year rates (2/10) and that had flattened 19 bps since the June sale to +110 bps. That action resulted from the contrarian rally in Treasuries, with longer-term rates declining more than shorter rates and led investors to view the Weighted Average Life (WAL) of the amortizing debentures differently, but still permitted the program to price the 25-year debenture series at its lowest rate since February.
More important than the debenture rates are the ongoing Effective Rates for small business borrowers and this table displays the levels shown in the chart below it.
| Issue | Debenture Rate | Effective Rate | Effective vs. Prime |
|---|---|---|---|
| 2021-20G | 1.22% | 2.699% | -55 bps |
| 2021-25G | 1.40% | 2.817% | -43 bps |
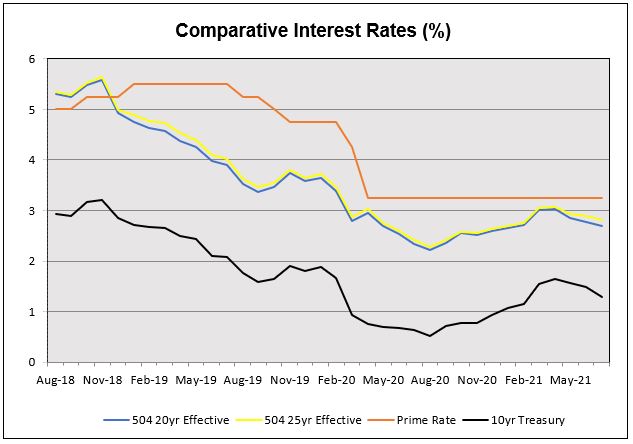
Other Developments
Lending support to recent Treasury performance net inflows to bond funds (excluding money market funds) are outpacing those for equities, even with inflation fears so prominent. Through June 23 these funds have seen deposits of $372 billion vs. just $160 billion for equities.
On July 12, the Fed will begin the sale of corporate bond holdings that it began purchasing in March 2020. Sales of its corporate ETF holdings had begun last month.
Minutes from the June 17 Fed meeting indicate the Fed may begin to pull back their support for the economy sooner than expected and that would be in the form of its Treasury and Mortgage-backed securities purchases. Their next meeting is July 27-28.
The Week Ahead
A heavy week for concentrated Treasury sales ($259 billion) and Fed speak with Chairman Powell spearing before congress for semi-annual testimony which is what compacted the Treasury sale dates. Fed speak will lighten up soon as we approach the blackout period ahead of the next meeting. Plus, more inflation reports and retail activity.
Monday – Treasury sells $105 billion 13 & 26-week Bills; $58 billion three-year Notes and $38 billion ten-year Notes
Tuesday – Treasury sells $24 billion thirty-year Bonds; core CPI expected to be +0.5% and +4% y/y
Wednesday – PPI ex food & energy expected to be +0.6% and +5.6% y/y; Chairman Powell speaks
Thursday – Chairman Powell continues testimony
Friday – Retail Sales expected to remain negative at -0.4% after the previous release of -1.3%
July 6, 2021
Rates Continue to Rally
As we begin this holiday shortened week and approach the 504 program’s July debenture sale the benchmark Treasury market reversed itself last week, discounting the recent inflation readings. At 1.44% the benchmark ten-year Note is 5 bps lower than when the June debentures were priced and matches its lowest weekly close since February. This performance is counter to market expectations of rising rates and seems to affirm the Fed’s contention that inflation will rise (which it already has) but will be transitory.
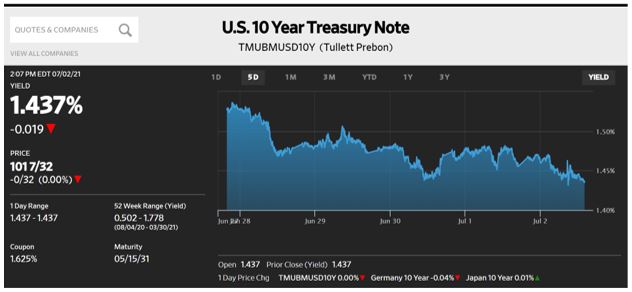
In other markets equites continue to inch their way to record highs as investors hope that strong earnings continue to support elevated price/earnings ratios. The week’s performance was aided by Friday’s strong jobs report that helped the S&P 500 index close higher for the seventh consecutive day for the first time since 1997. For the week it gained 1.7% slightly less than the Nasdaq’s 2% gain.
Regarding that report, the gain of 850,000 jobs was above forecast and the trend was bolstered by a positive revision of 24,000 for the May report. This was the biggest gain since last August and while the Unemployment rate rose to 5.9% that was viewed as a positive since more people were seeking to rejoin the labor force. A possible contributing factor to inflation, certainly to increased costs, was a 3.6% increase to average hourly earnings and that number jumped to 7. 6% in the restaurant and hospitality sector. Such a benefit is only one of many tools that companies are using to retain and hire workers to meet consumer demand, signing bonuses being another. Amidst all this companies, especially banks, are dealing with how to return employees to the office, and in what format as a full-time return is being resisted.
Though this report is positive 6.5 million jobs remain lost from before the pandemic, as shown in this WSJ chart. Job postings continue to surge (9.3 million as of April), much of the stimulus money has been distributed, the supplemental insurance money is still available in many states., and ironically, more people that usual have retired, perhaps fearful of resuming their old jobs and a possible infection.
The bottom line to this is more uncertainty about not only bond and stock markets but how and when businesses more fully staff themselves and in what fashion.
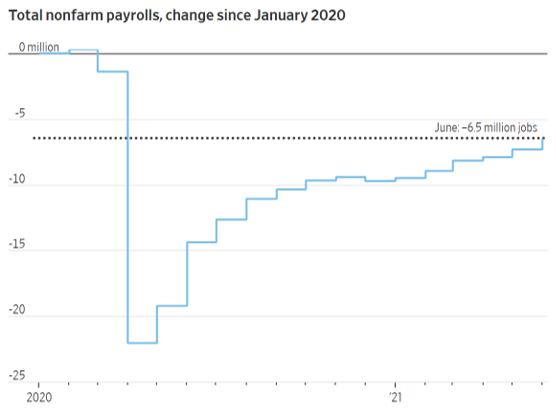
Other Reports
Just as the jobs report showed growth jobless claims dropped to 364,000 and Factory Orders showed a 1.7% increase. The Case-Schiller Home Price Index rose 14.6% from a year ago, its largest increase since the index began in 1987.
The Week Ahead
The SBA 504 program prices its July debentures, a very light week for Treasury supply and economic reports. Most prominent Fed speak will be Wednesday’s release of minutes from last month’s meeting.
Tuesday – Treasury auctions $105 billion 13 & 26-week Bills
Wednesday – Minutes of the June 16 FOMC meeting are released
Thursday – SBA 504 program prices its July debentures; Jobless claims
June 28, 2021
Scorecard
Domestic stock indices closed the week at or near record levels while Treasury rates moved slightly higher, both in response to a proposed bipartisan infrastructure deal and more confirmation of higher inflation.
This Financial Times chart shows the S&P 500 index having its best week (+2.7%) since February and analysts cite the potential benefits of the $1 trillion infrastructure deal that was announced Thursday. There remain several caveats that could impede its passage but for now the stock markets are bolstered by this coordinated effort plus strong second quarter earnings reports.
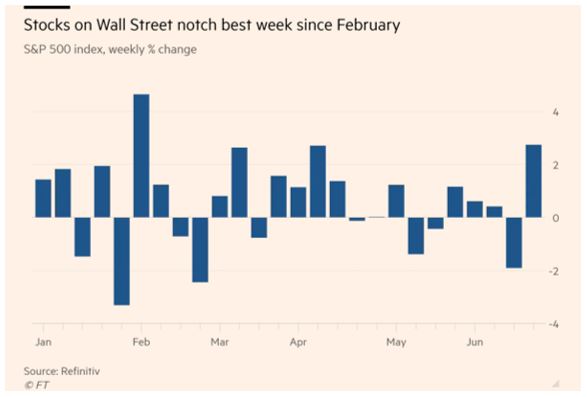
Treasuries improved early in the week, but eventually gave ground with this WSJ chart showing the benchmark ten-year rate moving higher by 9 bps on the week. An indication of how static this rate has been found in its 1.53% close being just 4 bps above where the June debentures were priced and is also 3 bps below the pricing day average for the 504 program’s sales dating back to March. With this rise in rate the Treasury curve reversed the recent flattening move and steepened by 7 bps with the 2/10 curve closing at +125.5 bps. As mentioned last week, the slope of this curve impacts the credit spread for how securities are priced and traded.
What is most surprising about that is the multiple inflation reports that have shown a rate well above the Fed’s 2% target which they are willing to see exceeded for a controlled period. The most recent evidence of this was Friday’s Personal Income & Outlays report that showed Personal Income declining 2% but the Committee’s preferred inflation measure, core Personal Consumption & Expenditures, increased 0.5% and 3.4% y/y. This index is calculated by the Commerce Department and is more inclusive and lower than Labor’s CPI index, but both exceed the 2% target which the Fed believes will be transitory as these increases are being measured against depressed levels from the onset of the pandemic.
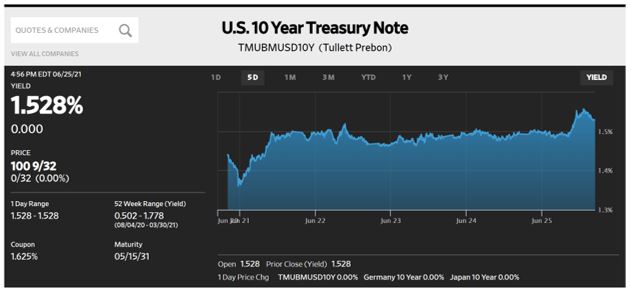
Other reports of interest:
- Existing home prices hit a record gain of +23.6% y/y with median prices exceeding $350,000
- Durable Goods rose 2.3% as expected, reversing April’s 1.3% decline
- Jobless claims increased to 411,000
- Q1 GDP was as expected +6.4%
- Fed speak continues to be varied as Fed Bostin President Rosengren believes it is time to weigh a pullback from stimulus while Minneapolis President Kashkari believes the economy has a way to go before policy can be tightened.
The Week Ahead
Fed speak, a light Treasury calendar, and the jobs report.
Monday – Treasury sells $105 billion 13 & 26-week Bills
Tuesday – Consumer Confidence expected to be more positive but still far below pre-pandemic levels
Thursday – Jobless Claims
Friday – NFP expected to be 675,000 with Unemployment declining to 5.7%
June 21, 2021
Tilt!
In a week that contained some enlightenment from the Fed the most interesting development for the rates market was the shift in the slope of the Treasury curve. The security that is of most interest to the 504 program, the ten-year Treasury Note, closed the week little changed at 1.44% but as this Federal Reserve Bank of St. Louis chart shows its relationship to the two-year maturity has shifted by 39 bps since March 30th. The current spread of +119 bps affirms that curve flattening trend with 11 bps of the move occurring after last Wednesday’s FOMC meeting and announcement. In August 2019, this spread was -.03 bps before the Fed affirmed its zero-interest rate policy as the pandemic spread and the curve began steepening. Further out the curve the thirty-year Bond declined 18 bps to 2.03% after the Fed announcement, its lowest level since March.

The Fed unexpectedly signaled a shift in its policy, reacting to strong inflation data and moving forward their forecast for when it might start raising rates and begin discussing a reduction of its monthly purchases of $120 billion Treasury and Mortgage-backed securities. Though the announcement identified two possible rate hikes in 2023 James Ballard, President of the St. Louis Fed speculated on an even earlier rate hike in late 2022. Either way it can be expected the market may front run the Fed as it balances its goals of full employment and manageable inflation in an economy expected to produce 7% GDP.
Existing reflation trades suffered as the US$ rallied with its best week since September; that affected the price of commodities which sold off because of increased cost, and value stocks weakened with the DJIA suffering its worst week since October, declining 3%.
Reports
- One of the inflation reports that influenced the Committee was Tuesday’s PPI-Final Demand reading of +0.8% and +6.6% y/y; ex food & energy the numbers were still robust at +0.7% and +4.8%. We will get a more accurate reading with Friday’s PCE report
- Jobless claims rose to 412,000 for the week ended June 12
- Retail Sales continue to suffer with stimulus payments having expired, down 1.3% in May after a 0.5% decline in April
- Responding to heavy cash deposits and meager investment opportunities the Fed raised its reverse repurchase rate to 0.5% for money market accounts and banks. The impact was immediate as $765 billion soon came in. The bank also raised its interest rate on excess reserves held at the Fed to 0.15%
The Week Ahead
Fed speak resumes, Treasury comes to market with $317 billion in Bills, Notes and Floating Rate Notes, and the Fed’s preferred inflation gauge on Friday.
Monday – Treasury sells $108 billion 13 & 26-week Bills
Tuesday – Treasury sells $60 billion two-year Notes
Wednesday – Treasury sells $21 billion two-year FRN’s and $61 billion five-year Notes
Thursday – Durable Goods forecast at +2% to reverse April’s -1.3% report; Treasury sells $62 billion seven-year Notes; third estimate of 1Q21 GDP expected to be +6.4%
Friday – Personal Income & Outlays includes the Personal Consumption Expenditures report. Personal Income expected to be negative as stimulus payments have expired and core PCE forecast at +0.6% and +3.5% y/y
June 14, 2021
Against The Norm
Over the last three weeks we have received reports of increased inflation that usually result in reduced valuations of bonds and stocks, but not now. Three weeks ago, the Fed’s preferred inflation gauge, PCE, showed a 3.1% annual increase, far above a sustained target level of 2% and there was little reaction. Last week the CPI report was above expectations at +0.6% and +5% y/y and both markets rallied. For now, it appears the markets believe the Fed’s assessment that inflation will be transitory due to base effects like the low pandemic levels current prices are being compared to. While a true interpretation of that concept may be deferred until 2022 what is certain is that the SBA 504 program continues to provide small businesses with low-cost loans for up to 25-years.
Just as conventional wisdom dictates bond rates should rise due to inflation it also argues for fixed rate loans to be more attractive in a rising rate environment, yet here we are with both of the program’s longest-term debentures offering ongoing effective rates substantially below Prime and that is before other charges are added for adjustable rate loans.
| Issue | Debenture % | Effective % | Prime Rate | Difference |
|---|---|---|---|---|
| 2021-25F | 1.47% | 2.887% | 3.25% | -.363% |
| 2021-20F | 1.29% | 2.77% | 3.25% | -.48% |
Other items of interest:
- With the benchmark ten-year rate declining 10 bps on the week 2021-25F was priced at its lowest level since February.
- This unexpected drop in the 10-year rate was preceded by a significant reversal in its breakeven rate, from a high of 2.56% last month to its current level of 2.33%. This rate is calculated by subtracting the real yield of 10-yesr TIPS (-0.88%) from the nominal yield of the 10-year Note (1.45%), another indication that perhaps inflation will be contained.
- Loan approvals show a 30% increase through May and that bodes well for increased issuance through this fiscal year.
- The below chart also shows the June sale as the second largest ($565,462,000) in history after last September’s surge that was guided by Section 1112 of the Cares Act. Issuance has recovered from the hangover of loans that were accelerated for that September sale and the June sale seems to have been aided by a longer than usual Cut-Off date from May.
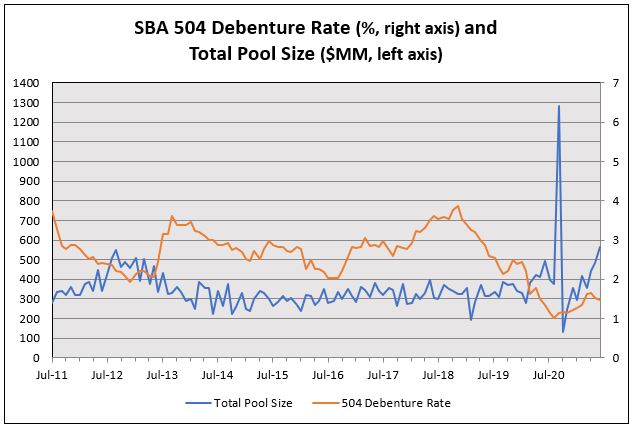
Reports
The CPI release has already been mentioned and in a light week for reports Jobless Claims showed a continued decline to 376,000 and Consumer Confidence showed gains to 86.4. No other reports but there were some interesting stories, like banks telling corporate clients they do not want any more deposits just as Money Market funds are hard pressed for investments as US markets flirt with negative rates.
The Week Ahead
FOMC meeting so no Fed speak until Chairman Powell’s Wednesday press conference, Treasury to sell $182B Bills, Bonds and TIPS.
Monday – Treasury sells $108B 13 & 26-week Bills
Tuesday – PPI Final Demand is expected at +0.6% and +4.8% y/y; Retail Sales forecast to decline 0.4% as stimulus checks ended in April; Treasury sells $34B 52-week Bills and $24B 20-year Bonds.
Wednesday – FOMC meeting concludes with announcement at 2:30 press conference.
Thursday – Treasury sells $16B 5-year TIPS.
Friday – No reports scheduled.
June 7, 2021
Uneventful, Until Friday
There was not much happening early in the holiday shortened week as Treasuries marked time and stocks came under some selling pressure until a lower than expected, but still strong jobs report was released Friday morning. At 559,000 it was weaker than expected but enough to move prices higher in both markets with Treasury rates declining for the third consecutive week. The benchmark ten-year Note has hovered around 1.6% since mid-April and now sits just 1 bps below where the 504 program priced its May debentures. A decline to 5.8% for the Unemployment Rate and a 0.5% increase in average hourly earnings added to a positive interpretation of the report.
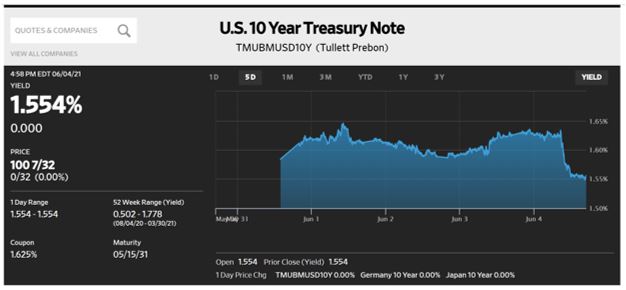
The labor market is taking longer than expected to recover as 7.8 million workers remain unemployed from pre-pandemic levels and that shortfall is a focus of the Fed’s monetary policy which the market expects to stay in place. Criticism of the government’s $300 supplement to state unemployment benefits has been identified as a disincentive to seek employment with many states having already rejected it and now the Administration is considering its termination.
These developments identify the push/pull effect of market conditions:
- Recent inflation indicators have been higher than forecast, usually a negative for fixed-income securities yet rates are lower.
- Higher than 2% inflation will be tolerated as the bank believes it will be transitory and markets seem to agree with that. If not, both bonds and stocks could see selling pressure and force a change in policy before full employment is achieved.
- Minutes from the Fed’s April 27-28 meeting showed several officials agreeing it might be appropriate to soon discuss the subject of asset purchases at an upcoming meeting. The bank has been buying $80 billion Treasuries and $40 billion Mortgage-backed securities each month since June 2020 and that has helped to absorb supply.
- That tapering will be broadcast just as the Fed did announce it would begin selling some of its $13.7 billion corporate bonds and ETF funds that it purchased last year. Those purchases were less than anticipated but the program’s existence did provide needed stability.
Major stock indexes gained 0.7% on the week, closing near record levels but with great attention paid to stocks like AMC Entertainment that was up 83%. This became a MEME stock, one that sees an increase of value not because of corporate performance but because of increased social media focus driving its value higher. Ironically, after moving higher as much as 98% the company announced a stock sale with caution to investors about its performance.
Reports
Other than the jobs report and a continued decline in jobless claims to 385,000 Factory Orders came in below consensus at -0.6% while the ISM Manufacturing index was above forecast at 61.2.
The Fed’s Beige Book, a compilation of business activity released two weeks ahead of scheduled FOMC meetings reported the economy grew at a somewhat faster rate between early April and late May. Materials and workers were in short supply and companies also dealt with delivery delays. These reports are prepared by one of the twelve Federal Reserve District Banks on a rotating basis.
The Week Ahead
No Fed speak ahead of the June 15-16 FOMC meeting, Treasury conducts its quarterly refunding, the SBA 504 program prices its June debentures and no significant economic reports are scheduled.
Monday – Treasury sells $105 billion 13 & 26-week Bills
Tuesday – Treasury sells $58 billion 3-year Notes
Wednesday – Treasury sells $38 billion 10-year Notes
Thursday – SBA 504 program prices its 20 and 25-year June debentures; Treasury sells $24 billion 30-year Bonds; CPI forecast at 0.4%
Friday – Consumer Sentiment declined in April, a small correction is expected
June 1, 2021
Inflation Doesn’t Seem to Matter, For Now
One week after larger than expected CPI and PPI increases didn’t affect markets Friday’s release of the Fed’s preferred inflation gauge, Personal Consumption Expenditures, showed the largest annual increase in thirty-years and markets again shrugged it off.
- At +0.7% and +3.1% both the monthly and annual core numbers were above consensus and reflected increased spending. Including food & energy the annual increase was higher at +3.6%.
- This information is contained within the Commerce Department’s Personal Income & Outlays report and that reflected the impact of government stimulus payments in March as Personal Income declined 13.1% after a 20.1% surge in March when consumers received the cash.
- Consumer spending rose 0.5% in April, driven by a 1.1% increase in money spent on services rather than goods. That uptick reflects the continued reopening of the economy with Covid-19 cases dropping and vaccinations increasing. Not unexpected the size of the April increase was drive by price increases as indicated by the PCE report.
Fed officials have acknowledged they expect inflation to exceed their 2% target and are willing to see a higher than 2% rate be sustained for a period they believe will be transitory, possibly through the summer after which the annual comparisons should decline. Part of the reason for that tolerance is the base effects of the annual comparison as recent numbers are being compared to base levels that were exceedingly low in the early stages of the pandemic.
Markets
Dead calm may be an apt description of how the usually sensitive government bond market has reacted to recent inflation increases. Beginning the week at 1.62% the benchmark ten-yar Note declined almost 4 bps, an indication that perhaps market participants agree with the Fed’s perspective of price increases being temporary. This level is just 2 bps higher than when the 504 program priced its May debentures 26 days ago and 19 bps below its highest level in the first quarter of the year.
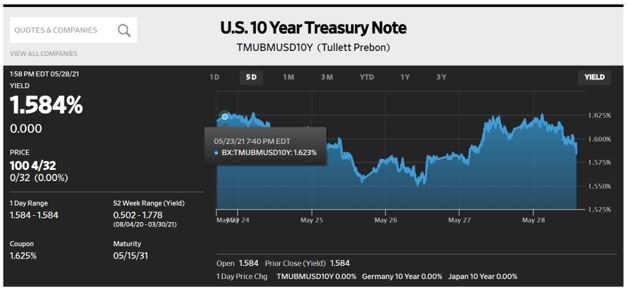
Stocks continued recent gains with the Nasdaq showing the best weekly results though down 1.5% for the month of May. Both the DJIA and S&P 500 did show monthly gains as investors seem confident inflation will not be lasting.
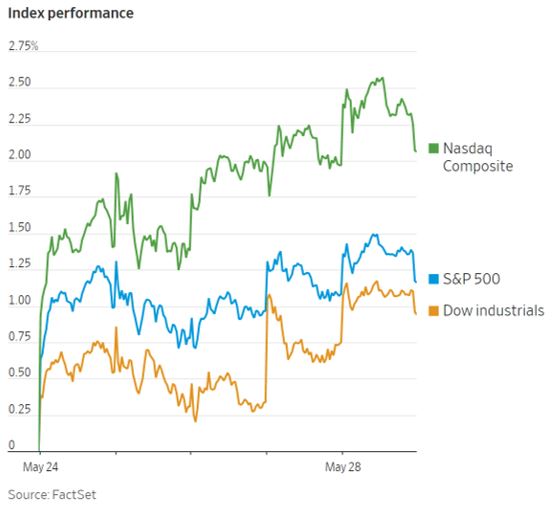
One market that continues to fade is crypto currencies where Bitcoin closed the week under $35,000 again, reflecting a 48% loss of value from its highs.
Other Reports
Personal Income & Outlays dominated last week while other reports stayed true to recent trends.
- Jobless claims of 404,000 set a new pandemic low
- House Price Index showed a 13.9% annual gain as light inventory and strong demand continue to drive that sector
- Durable Goods orders declined 1.3%, offsetting the previous month’s +1.3% gain that reflected money spent on goods in March unlike April’s increased spending for services.
The Week Ahead
A lot of Fed speak with a Chairman Powell speech on Friday, a very light Treasury calendar and Friday’s jobs report highlights the economic data.
Tuesday – Treasury sells $105 billion 13 & 26-week Bills, ISM Manufacturing report
Wednesday – The Fed’s Beige Book of economic activity in its 12 Districts is released ahead of its next meeting in 2 weeks
Thursday – Jobless claims and a yet to be determined amount of 4 & 8-week Bills is auctioned
Friday – Jay Powell speaks and Non-Farm Payroll is expected to be 645,000, recovering from April’s below consensus figure of 266,000.
May 24, 2021
Contained
In a week that saw the benchmark ten-year Note move sideways at 1.63% it resisted comments from Fed officials that in normal times might have pushed it higher in rate. This stockcharts.com chart shows the Note’s two-year journey resulting from a zero-interest rate policy that Chairman Powell has said is not about to end anytime soon while the Committee will have a chance to evaluate Friday’s release of their preferred inflation report.
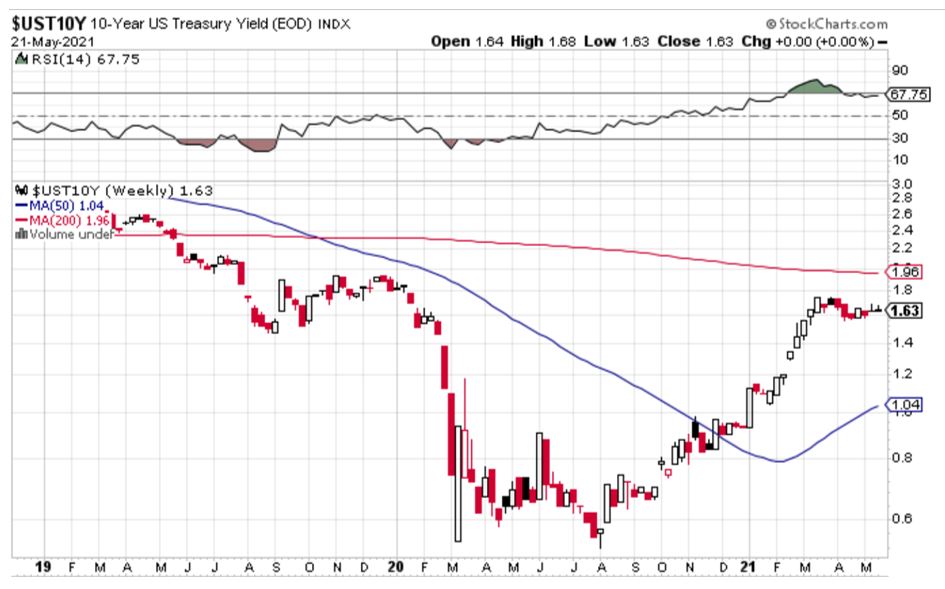
Spikes in recent CPI and PPI reports have had no negative impact and even the release of the April FOMC meeting minutes that said officials want to begin planning for tapering of the bond buying program were shrugged off. Analysts seem uniformly agreed that this Note rate will rise to 2% but there is no urgency as it remains cheap compared to global sovereign debt and taxable bond funds continue to see increased deposits, helping to provide stability.
Crypto
As static as the rates market was equities showed little change on the week but did have a volatile session on Wednesday and this Financial Times chart and accompanying story make the connection to Bitcoin’s performance after Chinese agencies announced a crackdown on digital currencies. That announcement followed Elon Musk’s statement that Tesla would no longer accept the currency as payment due to its harmful impact on the environment. Besides the crackdown on the currency China further added it is developing a renminbi based digital currency and Chairman Powell announced the Fed will publish a paper on digital currency this summer as central banks around the world experiment with a new form of money.
It appears it is not a question of if, but a question of when and what form of digital currency that central banks will adopt and while it is impossible to predict performance of outstanding platforms this pending development could cap short-term price action. At one point Sunday Bitcoin had surrendered 48% of its value from its April high.
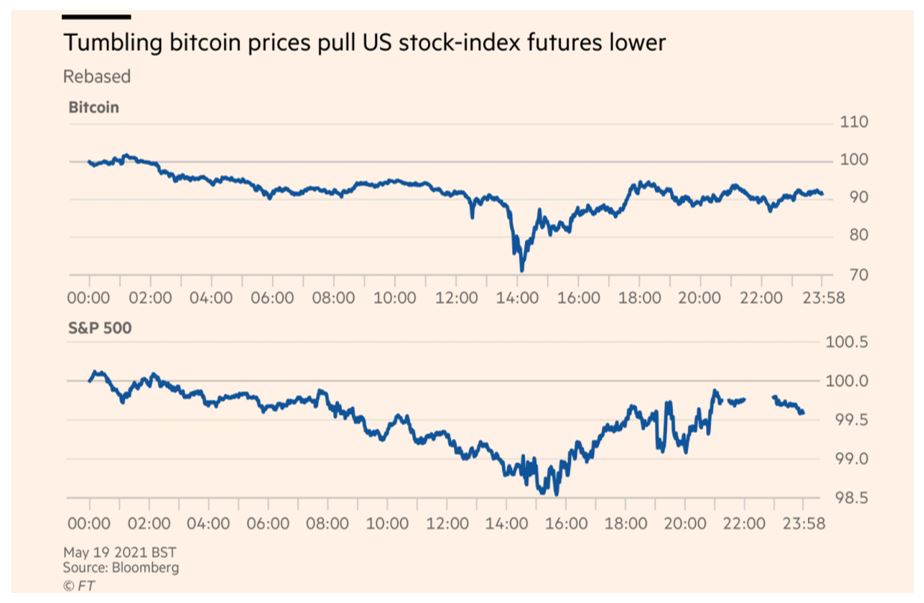
Reports
There were no major reports last week and the housing releases reflected commodity and labor shortages plus light inventory of existing homes.
- Housing starts and existing home sales both were below consensus
- Leading Indicators were higher than forecast at +1.6%
- Jobless claims of 444,000 represent a pandemic low and the number of people receiving some form of unemployment benefits declined by 900,000 to 16 million
The Week Ahead
Fed speak continues, a heavy Treasury calendar and the Fed’s preferred inflation gauge on Friday that is expected to show a significant jump.
Monday – Treasury sells $105 billion 13 & 26-week Bills
Tuesday – Treasury sells $60 billion 2-year Notes, New Home Sales and Consumer Confidence
Wednesday – Treasury sells $26 billion 2-year FRN’s and $61 billion 5-year Notes
Thursday – Treasury sells $62 billion 7-year Notes; Durable Goods expected to be +0.7% and 1Q GDP forecast as 6.5%
Friday – Personal Income expected to decline after March’s surge and Personal Consumption Expenditures, ex food & energy expected to be +0.7% and +3% Y/Y
May 17, 2021
Weak Reports
First, higher inflation for consumers, then a flat Retail Sales report that showed no increase after stimulus money had been spent in March, and then a higher inflation reading for producers. Chairman Powell has frequently stated the Committee expected inflation to rise, emphasizing it would be transitory and analysts seem to support that view. Now that we received confirmation of an increase from last Wednesday’s +0.8% CPI report we can settle in to see how sustainable it will be and how it is presented when the next Personal Consumption Expenditure report is released on May 28. The market was cautioned by a Federal Reserve Bank survey released on Monday showing that median year-ahead inflation expectations increased to 3.4% in April, confirmation of the bank’s expectations.
This 0.8% spike translates to a 4.2% seasonally adjusted annual rate, the highest since 2008 and if the volatile food & energy components are removed that figure is reduced to 3%, significant but not as dramatic. Energy alone was up 25.1% Y/Y and explains why economists tend to focus on the core values ex food & energy, minimizing volatility. Though the monthly increase is noteworthy the Y/Y surge is modified by the pandemic induced low levels from a year ago.
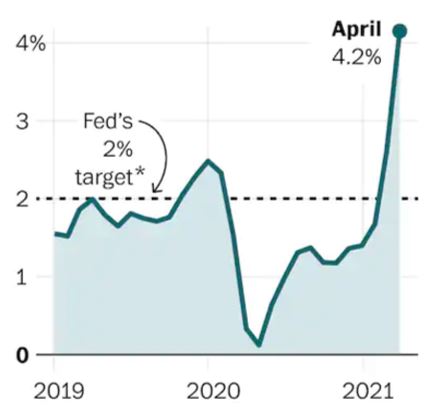
- Following the CPI release the Producer Price Index also exceeded consensus with a 0.6% gain and a 6.2% increase Y/Y. A major factor in in this final demand report was an 18.1% increase for steel Y/Y. Like CPI the core component was lower at +4.1% Y/Y.
- Retail Sales was another miss as it came in flat as consumers spent less on goods and more on services as the economy started to reopen. Forecast to be +1% the difference might have been absorbed in the +0.9% upward revision to March, making that increase 10.7% and reflecting consumer response to March’s stimulus payments.
- Jobless claims continued to decline with the recent reading of 473,000 but there are still 9.8 million unemployed which is an 11 million improvement from May 2020. Following the previous week’s jobs report attention turned to the $300 weekly supplement to state unemployment benefits that critics contend is a disincentive to the unemployed to seek work. That argument is just a part of the discussion as the proposed $1.8 trillion American Families Plan is advanced.
- Industrial Production was another report below forecast at +0.7% but also saw its Mach number revised upward by 0.8%.
- On Friday, the Consumer Sentiment reading of 82.8 was far below its forecast of 90, possibly another casualty of expired stimulus dollars.
- The budget deficit for the first seven months is $1.9 trillion resulting from a 30% increase in government spending on stimulus and jobless benefits.
Market Impact
Stocks had a tumultuous week showing a strong recovery on Friday to end the week with modest losses after a sharp decline midweek. Repeated comments from Fed officials seemed to soothe investor fears of inflation for now, leaving the Nasdaq with a 2.3% weekly loss after being down as much as 5.3% on Thursday, as seen in this WSJ chart.
Even with $33.3 billion in cash and cash equivalents on hand Amazon sold $18.5 in debt at spreads as tight as 0.1% to the two-year Treasury benchmark. Use of proceeds is for stock buybacks, acquisitions, and improved delivery services.
Overall, bonds cheapened with the ten-year benchmark rate higher by 6 bps at 1.64% which is 8 bps higher than when the 504 program priced its May debentures eleven days ago and that is a modest reaction to inflation fears, another indication that perhaps the market agrees that any increase will be temporary.
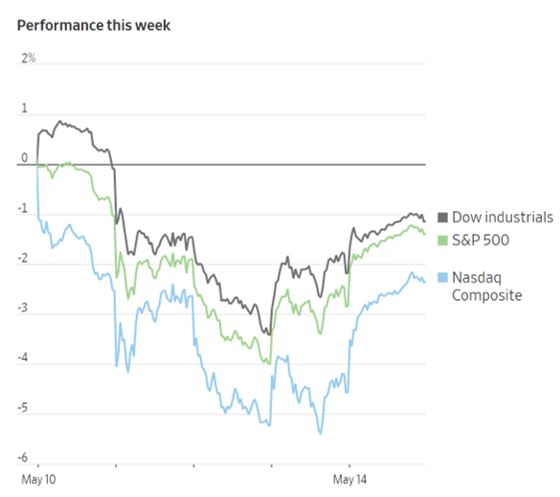
The Week Ahead
Fed speak continues, Treasury sells $179 billion of debt, and a light week for economic reports.
Monday – Treasury sells $105 billion 13 & 26-week Bills
Tuesday – Treasury sells $52 billion 52-week Bills
Wednesday – Treasury sells $27 billion 20-year Bonds
Thursday – Treasury sells $13 billion 10-year TIPS; Jobless claims
Friday – PMI Composite flash and Existing Home Sales
May 10, 2021
Continuing Trend
As mentioned last week, in a year that has seen benchmark Treasury rates rise in response to increased vaccinations that have led to an economic rebound we continue to see the SBA 504 program outperform both Treasuries and comparable Agency CMBS product. On Thursday, the program benefitted from a continued decline in Treasury rates as the benchmark CT-10 was 8 bps lower than in April, but the 20-year DCPC was priced 17 bps lower m/m while 2021-25E was priced 14 bps lower, also outperforming the benchmark move.
The reasons for the difference in those two spread changes are the smaller size of 2021-20E plus the longer duration of 25E which made investors less willing to accept any tighter spread. This chart below tracks the 25-year debenture rate as of July 2018 and the pool size which at $482,232,000 continues to trend higher since the drop off following the record September sale.
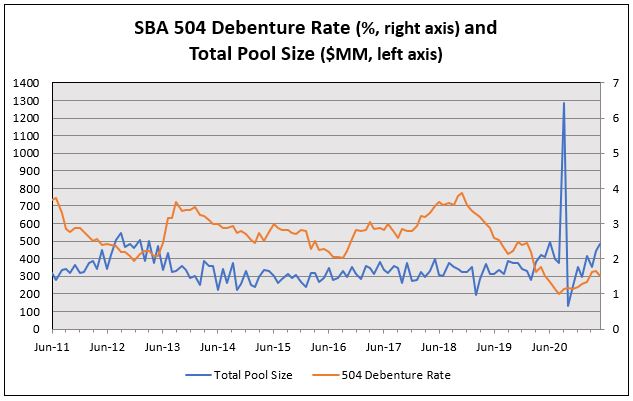
In addition, to improved pricing spreads and oversubscribed sales, this month’s three maturities enjoy two additional traits in common:
- All three were priced at negative spreads to Interest Rate Swaps with both 20E and 25E also priced at negative spreads to CT-10
- More importantly, all three debentures represent an ongoing Effective Rate for small business borrowers below 3%
This chart identifies the 2.85% Effective Rate for 2021-20E and 2.94% rate for 2021-25E, both well below the Prime Rate of 3.25% that serves as a base level for many loans.
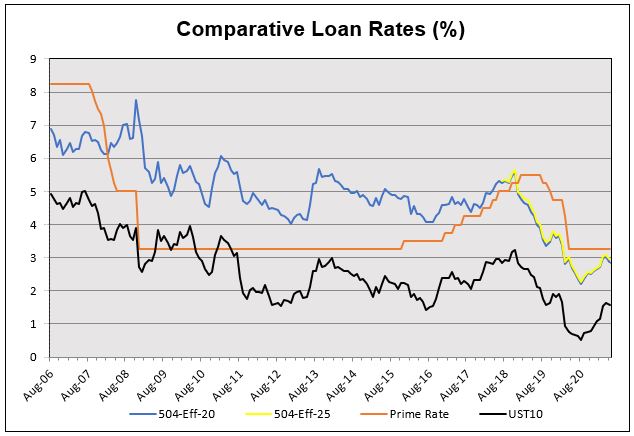
Other Events
- ISM Manufacturing index disappointed with a reading far below consensus at 60.7
- Factory Orders at 1.1% was also below consensus but a nice rebound from -0.8% in February
- Jobless claims at 498,000 continues a downward trend and is the first sub 500K reading since the pandemic began
- Friday’s Non-Farm Payroll report disappointed, coming in at 266,000, far below a consensus report for 1,000,000
The Week Ahead
Fed speak, Treasury conducts its quarterly refunding, some inflation reports and Friday’s jobs report closes out the week.
Monday – Treasury sells $105 billion 13 & 26-week Bills
Tuesday – Treasury sells $58 billion 3-year Notes
Wednesday – SBA 504 program funds its May sales; Treasury sells $41 billion 10-year Notes; CPI
Thursday – Treasury sells $27 billion 30-year Bonds; PPI
May 3, 2021
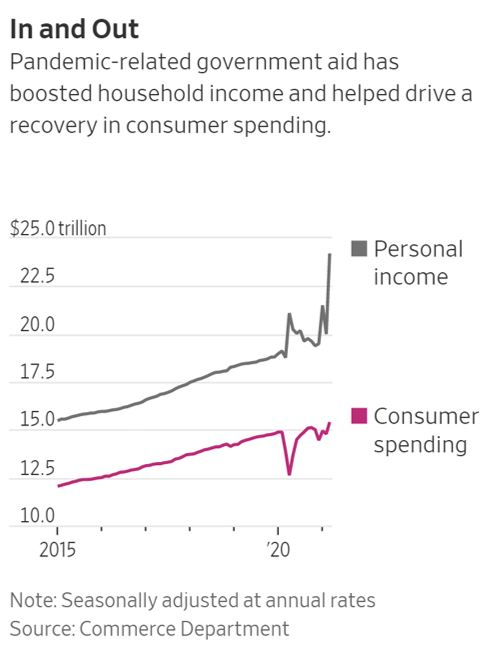
The header from this WSJ chart captures the economic impact of personal income on consumer spending which accounts for almost 70% of domestic GDP. The spike in government aided income 13 months ago resulted in decreased spending as individuals reacted to pandemic fears by increasing savings. Friday’s Personal Income report showed a March increase of 21.1%, the largest in the report’s history while also showing spending on goods increased 8.1% and personal savings increased by 27.6%. That last item can be problematic because the economy needs that money to be spent and the chart shows that spending is not matching personal income, yet. With increased vaccinations and reduced restrictions an economic recovery is underway and an earlier report, plus comments from Chairman Powell, support that view.
The earlier report was Thursday’s 1QGDP release showing a 1.6% gain, annualized at 6.4% vs. the previous quarter’s annualized rate of 4.3%. As for Chairman Powell, his message stayed on track with policy to hold steady on rates and bond purchases. He did note recent progress in growth and employment, admitting that the recovery has advanced quicker than expected but “remains uneven and far from complete.”
Other Reports
- The Conference Board reported its Consumer Confidence index as 121.7 vs. a forecast of 112, and approaching pre-pandemic levels
- Jobless claims declined again to 553,000
- The inflation component of the Personal Income report (Personal Consumption Expenditures) did confirm increases to 0.4% monthly and 1.8% Y/Y
After advancing the $1.9 trillion American Rescue Plan President Biden announced a proposed $1.8 trillion American Families Plan that will increase taxes on high earners, promote buying American goods and help blue collar workers. This puts current Administration proposals at $6 trillion and will take some time to implement. What didn’t take long was a fairly mild correction in the rates market that saw the benchmark ten-year Note move higher in rate after the President’s speech. As we approach the May debenture sale at 1.63% the benchmark is 1 bps lower than when the 504 program priced its April debentures and though this benchmark is 55 bps higher than in the January sale the program’s 20-year debenture in April was higher by just 36 bps. This disparity has been explained in recent commentaries by Steve Van Order as the result of a steeper yield curve and strong investor demand for DCPC’s.
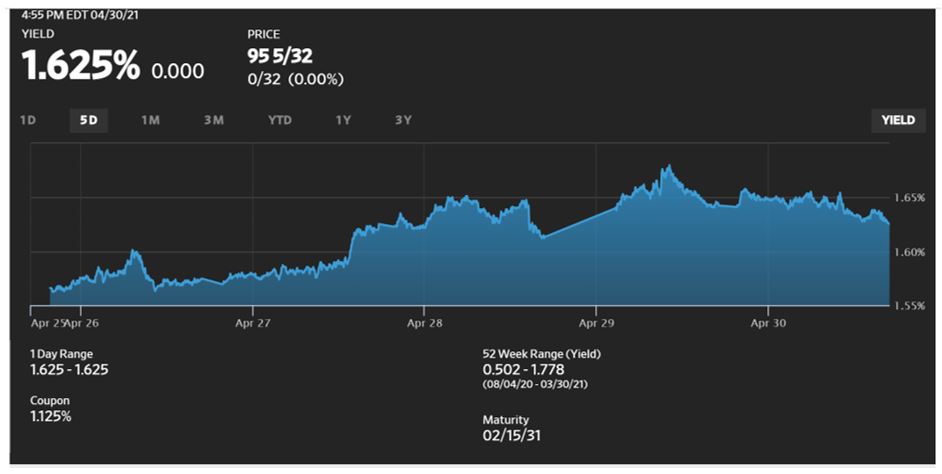
The steeper yield curve is explained by the Fed holding short-term interest rates near zero as Treasury increases the size of longer-term debt for its funding needs, and the strong investor demand is the result of increased marketing coupled with investors seeking high quality assets.
The Week Ahead
SBA 504 program prices its May debentures, Fed speak has resumed, a light week for Treasury issuance, and Non-Farm Payroll is the most significant report.
Monday – Treasury sells $105 billion 13 & 26-week Bills; Institute of Supply Management reports its Purchasing Managers Index
Tuesday – 504 debenture sales are announced
Wednesday – ISM Business Services report
Thursday – Jobless claims; 4 and 8-week Bill auctions, 504 debentures are priced
Friday – Non-Farm Payroll consensus is 938,000
April 26, 2021
Rates are Static, Equities Recover from Shock of a Tax Plan
After a slight rise early in the week the benchmark ten-year Treasury closed the week unchanged at 1.56%, 8 bps lower than where the 504 program priced its April debentures while equities slumped sharply twice before recovering on Friday to close the week at a small loss. Previously, it was written that Japanese buying had halted the increase in Treasury rates, but other forces are also in play, like an oversold market prematurely expecting inflation plus renewed outbreaks of Covid-19 virus.
Ironically, as outbreaks expand, especially in India where infections exceed 300,00 daily and represent almost half the total global infections, vaccine supply is outstripping demand domestically as vaccinations seem to have plateaued with restrictions being eased and businesses reopening. Every American 16-years of age and older can get a shot, the question now is just how many want it.
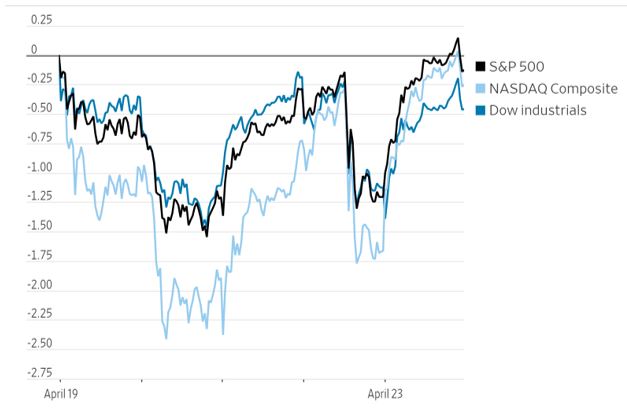
The market reaction to President Biden’s tax proposal acknowledges that more than corporations and the top 1% of income earners can be affected by the trickle-down effect of the increases. Raising the corporate tax to almost double its current rate could reduce S&P 500 earnings by almost 9% per share next year according to a Goldman Sachs review. And while equities shuddered a bit before recovering nowhere was the announcement felt more severely than in cryptocurrencies where Bitcoin, as shown in this Coindesk chart, declined 18% on the week and though currency digitalization seems to be part of our future it remains largely unregulated volatile.
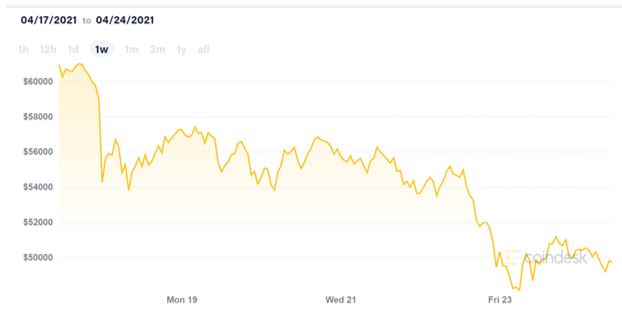
Besides capital gains tax concerns, other reasons for the sharp selloff must be considered – like speculation of Treasury Department charges of money laundering in cryptocurrencies plus unwinding of leveraged bets by overseas traders. Additionally, Turkish authorities have detained 60 people and issued an arrest warrant for the CEO of Thodex, a Turkish cryptocurrency platform, who is believed to have fled with $2 billion of investors’ money.
Reports
There were few economic reports, but they were positive:
- Purchasing Managers Index for Services was 63.1, far above consensus.
- New Home Sales were calculated to be 1,021,000 annually vs. a consensus of 887,000. It seems whatever is built can be sold as existing home sales are slumping due to reduced inventory. Contributing to price increases for new homes is the cost of lumber that is +203% Y/Y as demand exceeds supply that was reduced when sawmills shutdown a year ago. This cost had added $24,000 to the average cost of a new single-family home.
- Inflation protected bond funds saw a 29th consecutive week of inflows for a year-to-date total of $14.4 billion. Whether price pressures will be “transitory” as Fed Chairman Powell has stated or become more lasting, investors continue to seek protection in TIPS (Treasury Inflation Protection Securities).
The Week Ahead
No Fed speak ahead of Tuesday’s meeting and all Treasury auctions occur ahead of that meeting. Some housing data, 1Q GDP and consumer sentiment with Friday’s release of Personal Income which will be very strong due to stimulus checks and the Fed’s preferred inflation gauge (Personal Consumption Expenditures), also expected to be a strong reding.
Monday – Treasury sells $105 billion 13 and 26-week Bills; $60 billion 2-year Notes and $61 billion 5-year Notes.
Tuesday – Treasury sells $62 billion 7-year Notes and $28 billion 2-year Floating Rate Notes; FOMC meeting begins.
Wednesday – FOMC announcement at 2:00 and Chairman Powell press conference at 2:30
Thursday –1Q GDP forecast to increase to 6.3%
Friday – Personal Income & Outlays - Personal Income forecast to exceed 20% with core PCE +0.3% and +1.8% Y/Y.
April 19, 2021
Contrast
A week that saw Retail Sales climb the most in ten-months, jobless claims decline to the lowest level since pre-pandemic, and headline CPI increase 0.6% also saw both stocks and bonds improve, which is a bit confusing. Strong economic growth, which is becoming more obvious, usually signals inflationary increases that weaken demand for bonds, but the benchmark ten-year Note declined 10-bps on the week and 19-bps over the last two weeks. Just another reminder that markets don’t move in a straight line though the S&P 500 index is doing its best to track that path – up 1.5% on the week and 13% YTD.
It has been reported how cheap US Treasuries are compared to other sovereign debt like Japan’s, where ten-year yields are 0.08% and a WSJ article identifies Japanese investors as recent buyers of US debt, having purchased $15.6 billion Treasuries the first week of April. It is that type of participation that can soften the expected inflationary rise in domestic rates and was counter to Japanese selling in February ahead of quarter end that resulted in a 30-bps spike in rates, including a very weak 20-year bond auction.

Reports
- Stimulus money, Covid-19 vaccinations and business re-openings spurred a 9.8% increase in Retail Sales. Since mid-March, the federal government has distributed 159 million checks to households, totaling $376 billion
- Nearly 200,000 fewer people filed claims for unemployment benefits with that number still elevated at 576,000 but far below forecast
- Industrial Production, a measure of mining, factory and utility output gained 2.6% in March after a February decline
- China reported a record rate of 18.6% for 1Q2021 GDP
- Consumer sentiment continues to increase, now at its highest rate since last March
- CPI came in above consensus with the headline number of +0.6%, +2.6% Y/Y; though economists prefer to remove the volatile food & energy costs to achieve core readings of +0.3% and +1.6%. Since we all spend money on food & energy this WSJ chart shows an increase that exceeds the 2% target that if sustained would trigger a rate increase. Though this is not the FOMC’s preferred inflation gauge it does signal higher consumer costs.

And speaking of rate increases and Fed policy Chairman Powell was quoted as saying job gains and economic activity are expected to pick up “much more quickly,” but a rate increase this year is “highly unlikely.” Regarding the monthly purchases of $120 billion securities Mr. Powell said the Fed would slow their purchases “well before “any rate increase.
The Week Ahead
A light week for major reports, no Fed speak ahead of the April 27 meeting, and modest Treasury issuance.
Monday – Treasury sells $105 billion 13&26-week Bills
Tuesday – Treasury sells $34 billion 52-week Bills
Wednesday – Treasury sells $24 billion 20-year Bonds
Thursday – Treasury sells $18 billion 5-year TIPS
Friday – Purchasing Managers Index (PMI) expected to hold steady
April 12, 2021
April 2021 SBA 504 Rates – Continued Record Tight Spreads to Pricing Benchmarks
Below we update the analysis and table that highlights the execution in the April offering versus a year ago.
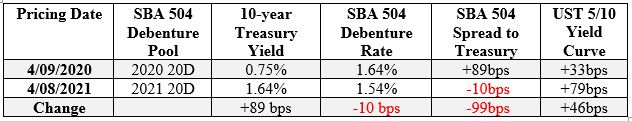
It is remarkable that the 10-year Treasury yield increased 89 bps over the past 12 months while the 504 program April 20-year debenture rate was 10 bps lower. This phenomenon was much because:
- Massive Fed and fiscal support last spring which started a long risk-on rally favoring spread products like 504 debenture pools (SBAP).
- Demand for high-quality assets remained strong.
- Strong distribution of the SBA 504 pool certificates. Over 20 investors now regularly participate in the benchmark 25-year class versus half that number for the then-benchmark 20-year class some years back.
- Steeper yield curve boosts demand for the pool certificates.
- Investor now expect the pools will prepay faster than convention. That’s because, as any 504 servicer knows, over the long haul the 504 loans (and therefore the debenture-backed pools) prepaid at a speed closer to 9% CPR versus the 5% CPR convention. Even low coupon pools have prepaid faster than expected. Underwriter research departments and trading desks have periodically focused on this phenomenon for several years, which helped to raise investor awareness. As a result, a faster-than 5% convention expectation has taken root in the market - at least 7% CPR for new current coupon pools.
The last reason above, that prepayments will be faster than convention, has in recent years led an increasing number of investors to calculate a shorter expected weighted-average life (WAL) for new and outstanding pools. For example, the 5% CPR convention results in a WAL of 9.3 years for the April 2021 25D class, but 8.1 years calculated at 7% CPR. In a steep yield curve, like today, this makes the pool certificate coupons look attractive when compared to that 8-year point on the yield curve. Combine that phenomenon with historically tight spreads in the ACMBS market and we can understand why both classes were priced in April at coupons at or below the ten-year Treasury benchmark yield (e.g., 2021-20D was set at a “negative spread” to Treasury).
If, however, future 504 pool prepayment speeds run persistently below these faster expectations, the spread to Treasury/swaps on outstanding and newly issued SBAP would widen to offer an adequate return measured over a longer WAL. We can see these key relationships in the chart below:
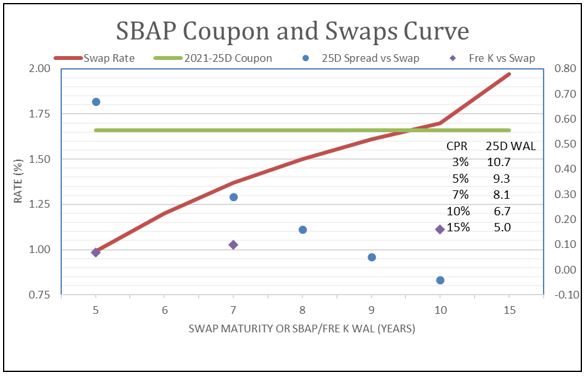
Notice how the 2021-25D coupon (green line) is barely above the swaps curve (red line) at the 9-year WAL point on the x-axis (roughly the WAL calculated at 5% CPR convention). For those who prefer Treasuries as benchmark, the swaps curve is a near-substitute for the Treasury curve so is fine for this analysis.
Investors clearly believe 2021-25D will prepay much faster than 5% CPR or they would not accept a SBAP coupon set right on top of the ten-year swaps (and Treasury) rate. SBAP is fully guaranteed but is significantly less liquid and embedded with a prepayment option compared to Treasury.
At faster CPR (and therefore shorter WAL) assumptions, however, the SBAP spread over swaps (blue dot marker) widens and is more attractive. An 8.1-year WAL (7% CPR) assumption offers about the same spread as benchmark Freddie K multifamily classes (purple diamond marker). At an even faster speed like 10% CPR, and a WAL of 6.7 years, the SBAP spread is clearly more appealing than the Freddie spread and the SBAP coupon sits nicely over the swap curve.
If, however, 2021-25D prepays slower than 5% CPR, the coupon spread to swaps quickly becomes more negative. No investors would pay for that. So, we can clearly see that because the SBAP market now prices off faster speeds and investors do not want to see the SBAP pools prepay too slowly.
This SBAP investor bias is quite different from traditional thinking on prepayment risk in current coupon mortgage pools. That’s because SBAP 504 loans behave differently than residential mortgages. The 504 loans backing the debentures in SBAP pools have been more sensitive to the economic cycle and CRE equity gains than to interest rates. So, seasoned low coupon pools, such as from 2012-13, prepaid faster than convention as the post-GFC economic expansion and rising CRE equity factors (until the pandemic) overshadowed the interest rate factor. For example, 2013-20A (1.93% coupon) has a lifetime prepayment rate (voluntary and accelerations) of 6.6%.
The Week Ahead
Monday – T-note auctions
Tuesday – T-bond auction, CPI, MFIB small business indices
Wednesday – April 504 funding closes, Fed Beige Book, import prices
Thursday – T-bill auctions, Claims, Retail Sales, Industrial Production, NAHB indices
Friday – Starts and Permits
April 5, 2021
8.4 Million More to Go
Friday’s jobs report of 916,000 far exceeded estimates and included an upward revision of 89,00 to February’s number with the unemployment rate declining to 6.0%. Even though the above header sounds ominous about getting employment back to pre-pandemic levels the below chart identifies a positive WSJ forecast for continued growth through 2022 that should dramatically reduce that deficit.
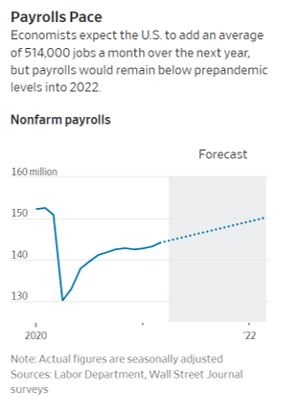
Some interesting items in the report:
- Average work week increased to 34.9 hours
- The leading sector for gains was restaurants and hotels at 280,000, a result of reduced restrictions as more people are vaccinated
- Average hourly earnings declined 0.1% vs. forecast of +0.3%. Y/Y the increase is +4.2%
- 21% of those employed teleworked because of the pandemic, a decline of 1.7% from the prior month
An interesting detail that identifies the efficiency of domestic vaccinations is that a private entity, CVS Pharmacy, has vaccinated over 10 million people, a figure that approximates the total of several European countries and might explain why the European recovery is lagging. Additionally, the administration reports that 97 million adults have received at least one shot, that is 37% of the adult population.
Rates
As we approach the April debenture sales for the 504 program it is noted the ten-year Benchmark Note rose slightly on the week and is higher by 18 bps from the March sale. The good news is that credit spreads, something that is key to 504 debenture pricing, are holding firm as investors continue to seek value as yields increase.
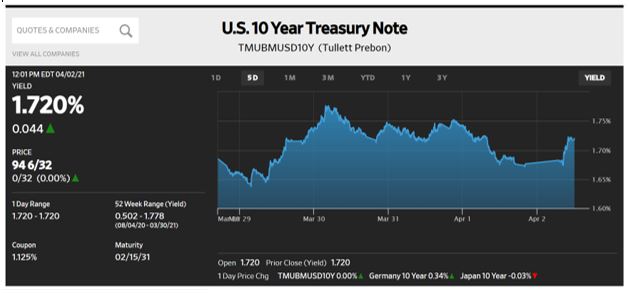
Wednesday’s announcement of President Biden’s $2.3 trillion infrastructure package is likely to pass in some form in some amount of time. That probability is a contributing factor for recent rate increases as deficit spending requires funding and that requires more debt issuance by Treasury. Secretary Yellin has endorsed “going big” on fiscal policy and Chairman Powell has cautioned this is not the time to be concerned about the deficit, so two of the administration’s senior finance officials support this and possibly future initiatives.
Reports
Besides the jobs report other releases were also positive:
- Consumer Confidence expected to be 96 was 109.7, reflecting the benefit of two rounds of government stimulus. Like total employment this reading is far below the pre-pandemic level of 132.6
- Institute of Supply Management Manufacturing index was forecast as 61.5 and was 64.7
- Though he sees “no need to hurry” Chairman Powell has endorsed research to develop a Central Bank Digital Currency, something that China is developing, and which could be the future of financial technology
The Week Ahead
More Fed speak, a very light week on reports and Treasury issuance, the 504 program prices its April debenture sales.
Monday – Treasury to sell $105 billion 13 & 26-week Bills
Tuesday – SBA 504 debenture sale is announced
Wednesday – FOMC minutes from the March 17 meeting are released
Thursday – SBA 504 program prices its 20 and 25-year April debentures
Friday – PPI ex food & energy expected to be +0.2% and +2.5% Y/Y
March 29, 2021
Mini Rally Ends
Ten-year Treasury rates had declined as much as 13 bps when the market revisited another $62 billion auction of seven-year Treasury Notes on Thursday. “Uninspired but not horrific” was the faint praise attributed to its results that showed improved retail distribution over the February sale but still had a large tail (difference between the low yield and high yield for the sale). The previous week’s closing levels reflected a market that was oversold in anticipation of supply and fear of inflation but seemed poised to accommodate an active Treasury calendar. Strong demand for the early auctions did not follow through to this hybrid maturity that doesn’t quite fit the preferred duration for various investors, so what seemed like a market that was prepared to accommodate this maturity saw the market selloff to close the week at 1.69%. That level does represent an improvement on the week but illustrates the concern for managing increased funding needs and is also 15 bps higher than when the 504 program priced its March debentures.

Fear vs. Need
This Financial Times chart was part of an article titled “Inflation bogeymen unsettles markets” and asks the question if investor fears over stimulus packages and central bank bond buying is justified. It is clear the one-year 13% decline in value exceeds the rate from the 2013 taper tantrum when the market perceived Quantitative Easing was ending and may indicate current investor fears over a rapid rise in inflation and supply. However, the article also identifies this Treasury yield is greater than 69% of the bonds in the Bloomberg Barclay’s Global Aggregate Index and any further increase could attract foreign buyers starved for yield.
Market mavens such as Warren Buffett, Bill Gross and Ray Dalio have negative opinions about bonds but there are investors like insurance companies and pension funds that are bound by regulations and accounting rules that commit them to these products. That leaves us with a balance that will be sought going forward as the market sits at pre-pandemic levels with increased government intervention as both a seller and buyer.
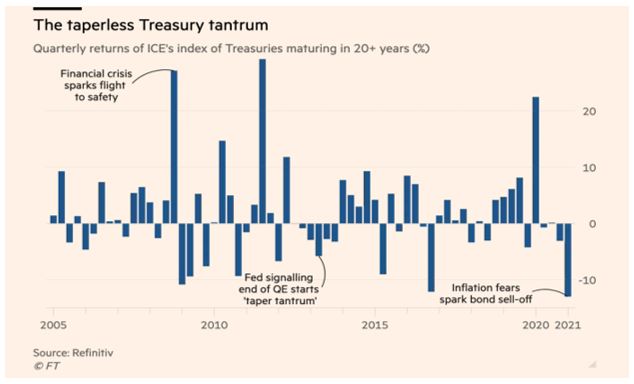
The Week in Review
Most reports were weaker than consensus except for 4QGDP which came in at 4.3%, .02% above previous estimates. Other reports were:
- Existing and New home sales were below forecast due to reduced inventory and rising rates.
- Durable Goods orders at -1.1% were far below the +0,8% forecast and was attributed to supply chain challenges that could be exacerbated by the Suez Canal logjam.
- Personal Income was -7.1% and core PCE was +0.1% while declining y/y to +1.4%.
Other Items of Interest
Domestic stock indices other than Nasdaq closed at or near record highs even as one private investment firm sold at least $20 billion of holdings in a “forced deleveraging.” One of those stocks was Viacom CBS whose share price declined 50% on the week because of the fire sale brought on by margin calls. This activity is costly to not just the fund but also its brokers who provided the financing.
Chairman Powell and Treasury Secretary Yellen appeared before Congress and highlights of Mr. Powell’s testimony were supportive of Fed policy, as expected:
- Stimulus is unlikely to fuel inflation.
- Rise in bond yields reflects economic optimism.
- Now is not the time to focus on reducing debt.
The Week Ahead
A very light Treasury calendar, more Fed speak, and the jobs report.
Monday – Treasury sells $105 billion 13 & 26-week Bills
Tuesday – Consumer Confidence is expected to reflect the benefit of expanded vaccinations
Wednesday – No major reports but President Biden is expected to detail his planned $3 trillion infrastructure plan
Thursday – Institute of Supply Manufacturing Index expected to increase
Friday – Non-Farm payroll expected to rebound to +600,000 with the Unemployment Rate declining to 6.0%
March 22, 2021
FOMC Report Optimistic/Market Reaction Not So Much
Wednesday’s FOMC announcement was interpreted as dovish, and analysts referenced stimulus dollars for individuals that will increase consumer demand as a reason, driving prices higher as businesses struggle to keep up with demand. Evidence of that stimulus was a Treasury release confirming 90 million payments totaling $240 billion have already been made, with a like amount to be sent out shortly.
The Fed’s updated projection for inflation expects it to accelerate by year-end though Mr. Powell indicated the increase is expected to be temporary and would not meet the Fed’s bar for raising rates.
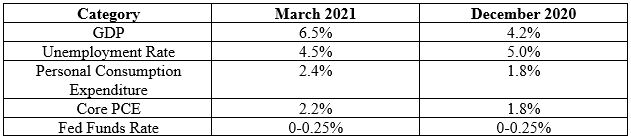
As positive as the updated forecasts are Chairman Powell cautioned “it will take actual progress, not forecast progress” to get the Fed to change policy. The Fed expects to maintain its zero-interest policy into 2023 and will continue to purchase $80 billion Treasuries each month but is discontinuing its regular purchases of up to $40 billion Agency CMBS as of March 23, though they will resume purchases if necessary.
Another Fed announcement that may reduce projected demand for Treasuries was the central bank’s termination of a favorable bank initiative that reduced banks’ Supplementary Leverage Ratio which permitted them to exclude Treasury holdings in calculating the number of reserves to be held at the Fed. Some may consider this the first step in the Fed’s normalization of policy as it is committed to low short-term rates while it may see longer-dated real yields rise.
Supply/Demand
That basic description of price action captures the move in Treasury rates as one-month Bills are pushing negative territory and long-dated Treasuries broke through support levels with the ten-year benchmark ending the week 10 bps higher and 81 bps higher YTD, as seen in the WSJ chart below. Though there was little new Treasury supply there was increased concern over economic strength and expectations of higher inflation and that will influence demand for the increased amount of Treasury debt needed to fund Covid relief and infrastructure spending. The absence of Treasury issuance will be amended this week as a total of $322 billion will be auctioned, including another 7-year auction which met little demand last month. This maturity is a bit of a hybrid as it does not specifically fit the duration needs of many investors and the recent backup in rates could help its distribution.
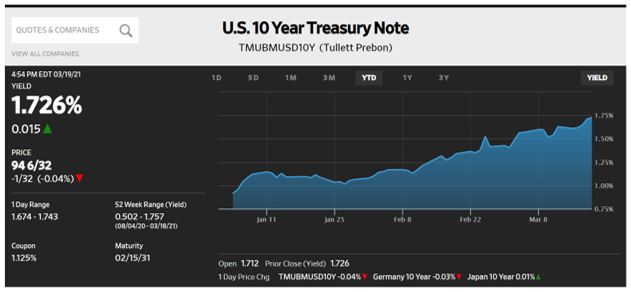
Other Items
- Jobless claims remained high at 770,000 for last week indicating there is little progress in more than 10 million unemployed workers returning to work anytime soon, even as Chairman Powell indicated the Fed expects the Unemployment Rate to decline to 4.5% by year-end.
- Retail Sales disappointed at -3% vs. a consensus forecast of just -0.5%.
- Leading Indicators were slightly weaker than forecast at +0.2%.
- As the US focuses on economic recovery and rising inflation, consumer prices in Japan declined 0.4% as its central bank continues its ongoing battle with deflation. That self-described “complex and sticky” situation is what the Fed strives to avoid and explains the bank’s willingness to seek a sustained inflation rate in excess of 2%.
- Weak demand for oil pushed down its price by 7%, its biggest weakly decline in five months.
- Springtime in Paris will be different as the city braces for its third Covid related lockdown as the country deals with poor distribution of vaccines, a common problem in Europe as it attempts to gain economic traction.
- Stocks showed small declines with the Nasdaq trending lower the most as rates rose.
The Week Ahead
Fed speak resumes with Chairman Powell speaking multiple times on Capitol Hill, a heavy calendar for Treasury, and the Fed’s preferred inflation gauge on Friday.
Monday – Treasury sells $105 billion 13 & 26-week Bills
Tuesday – Treasury sells $34 billion 52-week Bills and $60 billion 2-year Notes
Wednesday – Durable Goods report expected to be +0.6%; Treasury sells $61 billion 5-year Notes
Thursday – 3RD estimate of 4Q GDP expected to be +4.1%; Treasury sells $62 billion 7-year Notes
Friday – Personal Consumption & Expenditures expected to show a 7% decline in Personal Income following a 10% January increase, with core PCE at +0.2% and +1.5% Y/Y
March 15, 2021
Last week, despite smooth quarterly auctions Treasury yields continued to rise from expectations of strong economic growth, higher shorter-run inflation rates, and heavy future supply of Treasuries. President Biden’s signing into law of the $1.9 trillion economic recovery package and boosted vaccine purchases were part of the backdrop for bearish action in government bonds and bullish action in equities and corporate credit. The 10-year T-note yield broke up above 1.6% to close the week at 1.635%.
SBA 504 Funding – New Record Tight Spreads to Pricing Benchmarks
This week we updated and expanded Frank Keane’s table from the prior week to post results for the March 2021 SBA 504 20-year debenture results.
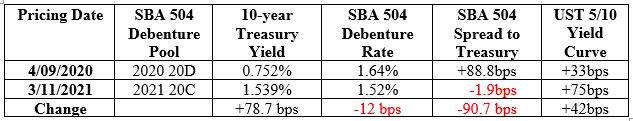
It is remarkable that Treasury rates increased 79 bps over the past 11 months while the 504 program March debenture rate was 12 bps lower. This phenomenon was much because:
- Demand for high-quality assets remained strong.
- Strong distribution of the SBA 504 pool certificates. About 20 investors now regularly participate in the benchmark 25-year class versus half that number for the then-benchmark 20-year class some years back.
- Steeper yield curve can boost demand for the pool certificates in the right conditions.
- Investor expectations the pools will prepay faster than convention. That’s because for quite a few years now the 504 debenture pools prepaid at a speed, if anything, closer to 10% CPR than the 5% CPR convention. So, a faster-than-convention expectation has taken root in the market, perhaps closer to 7% CPR.
The last reason above, that prepayments will be faster than convention, has in recent years led an increasing number of investors to calculate a shorter expected weighted-average life (WAL) for new and outstanding pools. For example, the 5% CPR convention results in a WAL of 9 years for the March 2021 25C class, but just 8 years calculated at 7% CPR. In a steep yield curve, like today, this makes the pool certificate coupons look attractive when compared to that 8-year point on the yield curve. Combine that phenomenon with historically tight spreads in the ACMBS market and we can understand why the March 20C class could be priced at a coupon slightly lower than the ten-year Treasury benchmark yield (i.e., at a “negative spread” to Treasury).
If, however, future 504 pool prepayment speeds were to run persistently below these expectations, the spread to Treasury would need to widen to offer an adequate return measured over a longer WAL.
The Week Ahead
Headlined by the FOMC meeting, with second-tier economic data.
Monday – Nothing of note
Tuesday – Retail sales, industrial production, home builder indices
Wednesday – Permits, starts and FOMC statement and presser
Thursday – Claims, Philly Fed Indices, Leading Indicators
Friday – Noting of note
March 8, 2021
Same Speech – Different Response
For as long as the Fed has maintained its zero interest rate policy Jay Powell has repeatedly said NO rate hikes until:
- Full employment was met
- Inflation was sustainably above 2%
On Thursday he repeated those comments and the market sold off another 2+% in equities and Treasury rates that had been creeping higher moved sharply higher with a steepening yield curve. What the steeper yield curve reflects is optimism towards economic growth and also that some investors fear the risk of higher inflation. Thursday Mr. Powell added the Fed would welcome both conditions and suddenly people are realizing he has meant this all along – there will be no change in rates.
To say opinion is conflicted on these developments is to understate the case:
- An economy that is projected to grow 6% this year bodes well for companies and their stock yet focus seems centered on stretched valuations.
- While rates are rising and are increasing the cost of corporate funding credit spreads remain tight with investor demand for assets very strong.
- Inflation is subdued at present but there seems to be apprehension over the pending Covid-19 stimulus which covers more than pandemic needs, plus the pending infrastructure spending which the Administration is planning.
This WSJ chart shows the 40 bps monthly change in the benchmark ten-year Treasury rate and that change is close to the 42 bps change from when the February DCPC’s were priced (1.147%).
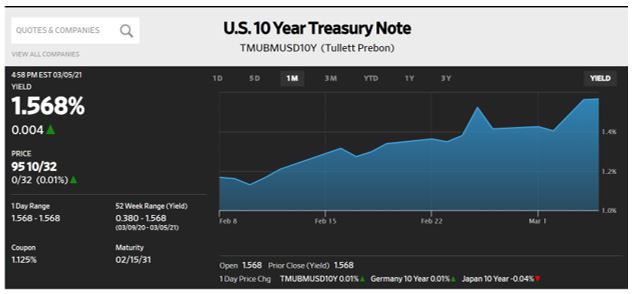
SBA 504 Funding
It is obvious the March rate will be higher than February but referencing the earlier comment about improved pricing spreads the market has accepted tighter spreads as benchmark rates have risen, as was mentioned two-weeks ago. Here is another table that shows how the market adjusts its relationship of credit spreads to benchmark rates.
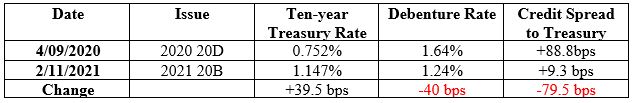
It is remarkable that Treasury rates increased 40 bps over ten-months and the 504 program priced its February debenture 40 bps lower because of demand for high quality assets and improved distribution of the Certificates coordinated by Steve Van Order and the program’s Underwriters, BofA Securities and Credit Suisse.
It is clear that investors charged a pricing premium last year when benchmark rates were near historic lows, just as they are now willing to accept less spread as rates rise in an environment supported by the Fed’s easy money policy and that reinforces the ability for corporate America to continue accessing the market on favorable terms. What is of concern to the market is the amount of debt being taken on by the government as the deficit already exceeds annual GDP and will only increase as more stimulus is provided.
Reports
Friday’s jobs report was encouraging and helped two of the major stock indices close slightly higher on the week while the Nasdaq continued its recent decline. Not only was the 379,000 gain above consensus but January was revised upwards by 117,000 and the Unemployment Rate declined to 6.2%. Both private sector employment and manufacturing sectors were above consensus.
Earlier in the week the Institute of Supply Management report was also above consensus as demand for manufacturing goods is rising, as evidenced by last week’s positive Durable Goods report.
Affirming Chairman Powell’s comments both the Minneapolis and Atlanta Fed leaders stated they are unconcerned about rising yields and do not see any need for change to Fed policy. That stance was challenged by Bank of America which called for the Fed to reinstitute Operation Twist, whereby the bank would sell short-term debt (Bills) and buy longer-term debt (Notes & Bonds), thereby flattening the Treasury curve. This approach is different than Yield Curve Control that has been previously discussed but also commits the Fed to more involvement in the market, making its eventual withdrawal more challenging.
Very quietly, oil has continued its surge with Brent crude, the international benchmark now trading at $70 a barrel after OPEC and Saudi Arabia announced additional production cuts.
The Week Ahead
No Fed speak during the blackout period ahead of the March 16-17 FOMC meeting, SBA 504 program prices its March debentures, Treasury conducts its quarterly refunding.
Monday – Treasury to sell $105 billion 13 & 26-week Bills.
Tuesday – Treasury sells $58 billion three-year Notes.
Wednesday – Treasury sells $38 billion ten-year Notes; CPI forecast at +0.4%
Thursday – SBA 504 programs prices its ten, twenty, and twenty-five year Debentures, Treasury sells $24 billion thirty-year Bonds.
Friday – PPI forecast as +0.4%
March 1, 2021
Is it Economic Recovery or Fear of Inflation?
On Friday, the House passed a $1.9 trillion COVID-19 Aid bill that if approved by the Senate will include $1,400 to individuals in addition to the $600 paid out in January that had been supplemented by a $300 weekly unemployment benefit. This action came the same day that Household Income reported a 10% increase in January, the second largest in history after last April which reflected the initial pandemic aid relief.
Volatile market action last week left the ten-year benchmark Note at 1.42%, 43 bps higher than on March 3, 2020 when the Fed first cut rates in response to the pandemic and 25 bps higher than when the 504 program priced its February debentures eighteen days ago. By last March, the market had already eased for the Fed and now it seems it is tightening for them in anticipation of either an economic recovery or increased inflation, or both.
This WSJ chart shows how most of the volatility occurred last Thursday as the Street, not retail investors, purchased the bulk of that day’s $62 billion auction of seven-year Notes. The auction had a 4 bps tail, meaning bidders were awarded Notes 4 bps cheaper than expected which forced them to hedge those purchases by selling five-year Notes. Intraday the ten-year benchmark Note traded as high as 1.60% and that area is viewed as its next major support level.
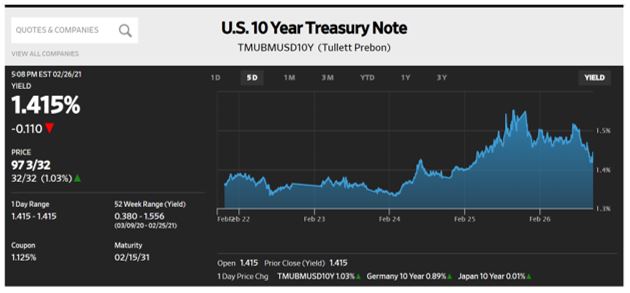
As the rates market wobbled equities, especially the tech sector, sold off hard. Down 4.9% for the week the Nasdaq led stocks down just as it has led them higher. It is agreed that inflation is kryptonite for bonds and the sense of it increasing is affecting stocks which had benefitted as an alternative investment to low yielding bonds. While an economic rebound will benefit stocks concern over inflation and eventual policy change will be detrimental to bonds as forecast by Warren Buffett in his annual letter: “Fixed Income investors worldwide – whether pension funds, insurance companies, or retirees – face a bleak future.”
Stocks had weakened early in the week but found support from Chairman Powell’s Congressional testimony where he affirmed the bank’s commitment to easy money and controlling inflation but seemed prophetic when he expected inflation “to be volatile over the next year or so.”
With Treasury Secretary Yellen advocating for the Administration to “act big” with fiscal stimulus it now seems the market is asking the Fed to assume a bigger role as well. They already are dedicated to a zero interest rate policy until inflation, currently at 1.5%, averages more than 2%, as well as purchasing $120 billion Treasury and Mortgage-backed securities each month and it is this activity that the market is hoping to see expanded as it has an impact further out the curve. As measured by the 2/10 Treasury rates spread the curve has steepened by100 bps since last March and longer-dated maturities have been identified by Treasury for increased funding. Since Treasury rates directly affect Mortgage rates that market has recently seen a 51 bps increase in conventional 30-year financing that led to an 11% decline in refinancing for the week ending February 19.
Another policy action to be considered is Yield Curve Control whereby the Fed would set specific long-term rate targets. This is more drastic and was used during World War II to keep down the government’s borrowing costs. By setting those rates the Fed would purchase any government bond that exceeded its target rate.
Other Reports
In addition to a strong Personal Income report:
- The Fed’s preferred inflation gauge, PCE, came in slightly above forecast at +0.3% and +1.5% Y/Y.
- Durable Goods report also exceeded consensus at +3.4%, its ninth straight month of gain and the largest monthly increase since July 2020.
- Initial unemployment claims declined by 111,000 to 730,00 last week, the biggest drop since last summer.
- The Conference Board reported consumer confidence improved in February for the second consecutive month.
What these reports point to is a more positive attitude about the economy and an attempt to get ahead of the Fed should inflation accelerate. Part of Chairman Powell’s testimony included the bank’s plan to provide advance warning ahead of future moves but the market views that as reactionary and is signaling its intent to be proactive. Rates recovered on Friday as stocks marked time, so will wait on Congress, the Fed and Treasury to outline recovery plans and track progress on containing the virus with the next FOMC meeting scheduled for March 16-17.
The Week Ahead
Fed speak, a very light Treasury calendar, and few reports but the jobs report is Friday.
Monday – Treasury sells $105 billion 13 & 26 week Bills, ISM Manufacturing index
Friday – Non-Farm Payroll forecast at +218,000
February 22, 2021
Higher & Steeper
As we approach the one-year anniversary of the FOMC policy move that returned us to a zero interest rate policy we look to gauge how the market has performed and with the recent spike higher in long-term rates it is clear that investors believe two things:
- The Fed is committed to zero (short-term) rates until inflation, currently at 1.5% per Personal Consumption Expenditures, averages more than 2%.
- The need for increased Treasury funding will be significant as the Administration pursues more stimulus, and that financing will take place in longer-dated maturities like this week’s auction of $62 billion 7-year Notes.
Confirming both points is the Y/Y change in the following table showing that investors are willing to accept almost zero return for buying short-dated T-Bills, not only for their safety but also to use as collateral. T-Bills are used as excess reserves held at the Fed or for security transactions like when leveraged mortgage banks react to rising long-term rates that decrease the likelihood of mortgages being refinanced. When that happens the duration of their investments increases and they sell long-dated Treasuries, or use derivatives to sell, to offset that risk, and that requires collateral like T-Bills.
| Issue | Current Yield | One-Year Change |
| 3-Month T Bill | 0.03% | -155 bps |
| CT-5 | 0.58% | -84 bps |
| CT-10 | 1.34% | -24bps |
Since T-Bills have a short maturity the need to replenish those investments is constant thereby preserving strong demand for their weekly auctions and keeping rates low as long as policy remains unchanged. If ever there is a chance for negative Treasury yields it is in this asset class.
This Financial Times chart shows how the market had eased for the Fed last February ahead of the actual rate cuts and how rates have trended higher, accelerating since the November election. Correspondingly, the S&P 500 index is up 25% since last March and while it is conceded that inflation is bad for bond holders any sharp increase will also impact stocks, something that could fulfill the predictions of analysts who caution about elevated valuations.
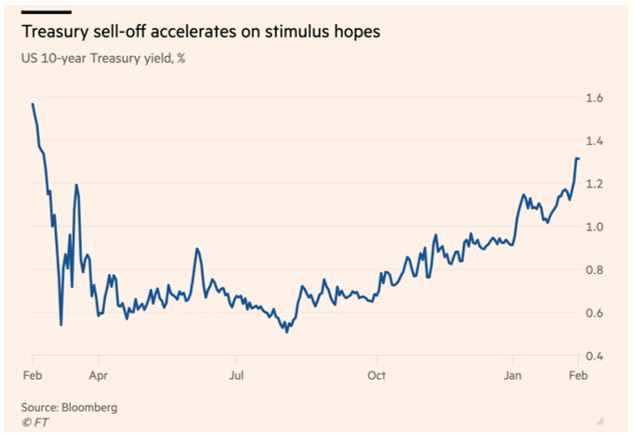
A Hint of Inflation?
In a week of few reports there were two that surprised - Wednesday’s release of PPI-Final Demand came in much stronger than expected at +1.2% ex food & energy vs. a forecast of just +0.2%, and Y/Y it was +2% vs. the +1.2% consensus. While this is not the Fed’s preferred inflation gauge it does show surpricing strength in an indicator that had been lagging.
Retail Sales rose 5.2% after three months of decline during the holiday season as the $600 stimulus check in January was identified as the change agent.
January home sales surprised with a positive gain of +0.6% and was +23.7% Y/Y. Additionally, home prices increased 14.1% in that same period as low interest rates and thin inventory contributed to the surge.
Wednesday’s release of the January FOMC Minutes affirmed the easy monetary policy will stay in place and the bank will continue to buy $120 billion Treasury and Mortgae-Backed securities each month.
The Week Ahead
Fed speak includes Chairman Powell speaking to Congress Tuesday & Wednesday, a heavy Treasury calendar, and some GDP and manaufacturig reports.
Monday – Treasury sells $105 billion 13 & 26 week Bills; Industrial Production to be +1%
Tuesday – Treasury sells $34 billion 52-week Bills and $60 billion 2-year Notes
Wednesday – Treasury sells $26 billion 2-year Floating Rate Notes and $61 billion 5-year Notes
Thursday – Treasury sells $62 billion 7-year Notes; 4QGDP expected to be +4.1%; Durable Goods consensus is +1%
February 16, 2021
Issuance Back on Track & DCPC’s Outperform
After experiencing several months of reduced issuance following September’s record sale of $1.3 billion the 504 program last week funded $415.2M debentures, a number close to the 12-month average which was greatly influenced by that same September sale. This chart shows the dramatic drop in volume to $131MM in October and the steady increase since then.
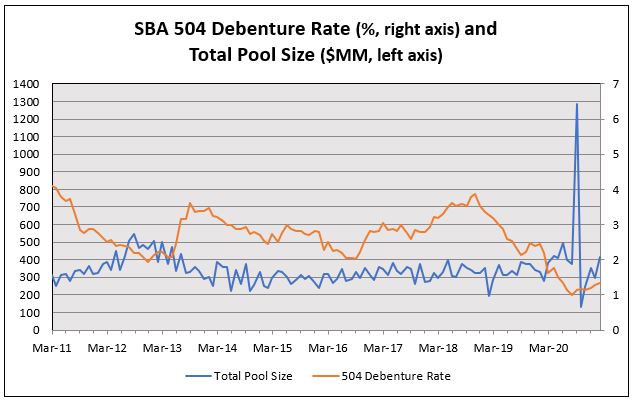
We have frequently written of how Steve Van Order has identified the strong investor demand for DCPC’s, and this month’s sale stands out in particular. Benchmark Treasury rates gradually rose with CT-10 closing the week at 1.21%, its highest level since last March, but Thursday’s sale was priced off a rate of 1.147%. Plus, other rates that influence our monthly pricing, like Interest Rate Swaps, also increased. Here is a display of where 2021-20B, priced at a rate of 1.24% would have been priced if the Underwriters had not developed a book totaling as many as 19 investors whose demand helped to tighten pricing spread.
1.18% DCPC 2021-20A priced January 7 with CT-10 at 1.079%
0.068% increase in CT-10 to 1.147%
0.07125% increase in 10-year Interest Rate Swap rate (added to CT-10 rate for pricing)
1.319% an increase of 0.079%, rounded to a debenture rate of 1.32%
(Interest rate swaps usually involve the exchange of a fixed interest rate for a floating rate, or vice versa, to reduce or increase exposure to fluctuations in interest rates and have been used in pricing DCPC’s since 1999. Debentures have been priced with IRS at levels as low as -16.5 bps and as wide as +127 bps. This month’s level was +6.25 bps.)
The reason why 2021-20B was priced at 1.24% is because buyer interest was so strong its pricing spread was tightened by that same 8 bps and printed at a single digit pricing spread (+3 bps) to Interest Rate Swaps for the first time in program history. That spread also represents a significantly tighter spread than the Freddie Mac K-2 series that is considered the benchmark for pricing in the Agency CMBS market. The same circumstances enabled 2021-25B to be priced 8 bps tighter to benchmarks than in January.
A final comment about issuance being back on track is the expected boost for the 504 program from the extension of 504 borrower P&I relief and the prospect of refinancing federal government guaranteed debt. Treasury rates are rising in response to optimism over decreased infections and increased vaccinations; adding that to stimulus spending that will spur the economy and potentially inflation, making it prudent for small business borrowers to seek fixed-rate debt for their funding needs.
The Week in Review
- Economic reports were few with CPI showing zero ex food & energy and just 1.4% y/y. Consumer Sentiment declined more than expected, driven lower by households with lower income, confirming the inequity of the effects of the pandemic.
- Chairman Powell’s speech underscored the importance of “patiently accommodative” monetary policy to boost the pandemic ridden labor market which he described as being “very far” from being strong. He also stressed there would be no rapid change to policy that is expected to remain in place through 2022.
- GDP in Europe was weaker than expected with the UK -9.9%, France -8.8%, and Italy -8.3%; all much weaker than the US at -3.5%.
- CBO estimates US debt is on track to hit 107% of GDP by 2031.
- Stocks continued to show gains, closing the week at, or near recent highs.
The Week Ahead
The SBA 504 program funds its February sale, some Fed speak, and a light week for economic reports and Treasury sales.
Monday – Presidents Day holiday
Tuesday – Treasury sells $105 billion 13 & 26-week Bills
Wednesday – 504 funds its February debenture sales; PPI and Industrial Production both forecast at 0.5%; Treasury sells $27 billion 20-year Bonds; FOMC minutes of its January 27 meeting are released; Pitchers & Catchers report
Thursday – Treasury sells $9 billion 30-year TIPS
February 8, 2021
Proposed Stimulus Moves Rates and Stocks Higher
Both the Senate and House are moving forward to legislate President Biden’s plan to stimulate the economy and provide relief for unemployed workers and states impacted by the coronavirus. The proposed amount reflects recent comments by Janet Yellen to “act big” yet is criticized by not only GOP representatives but also Lawrence Summers, former economic advisor to Barack Obama who believes that amount is excessive and will lead to inflation not seen in a generation. By overheating the economy Mr. Summers believes “having now committed 15% of GDP to address these challenges with essentially no increase in public investment” the administration is using up too much of its bandwidth to be able to achieve its other goals.
As the legislation coursed its way through the Senate and House, Treasury rates increased in an orderly fashion, accompanied by wider interest rate swap spreads. As seen in this WSJ chart the ten-year benchmark closed the week 9 bps higher than when the 504 program priced its January debentures and one reason why the move has been orderly is the strong investor demand for high quality assets like Treasuries and DCPC’s.
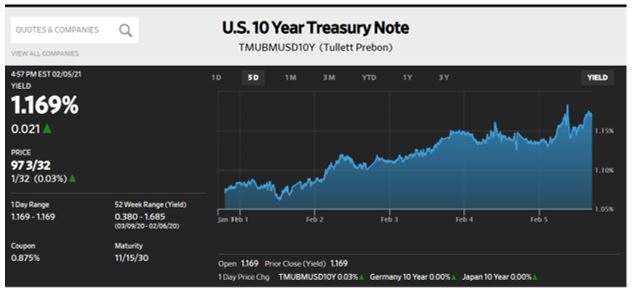
Along with higher rates and wider swap spreads the benchmark Treasury yield curve is steepening, as seen in this Financial Times chart with the difference in yields between the 30-year and 5-year Treasuries the greatest since 2015. Of interest is how the most recent tight spread occurred in March 2020 when the Fed reinstated its zero-interest rate policy in response to the pandemic. Since then, Treasury’s shift to issuing more longer-term debt, coupled with increased funding needs to finance relief packages that should result in higher inflation have combined to pressure long-term rates. An indication of that pressure is the ten-year breakeven rate (ten-year Treasury yield plus the ten-year TIPS yield) hit 2.20% on Friday.
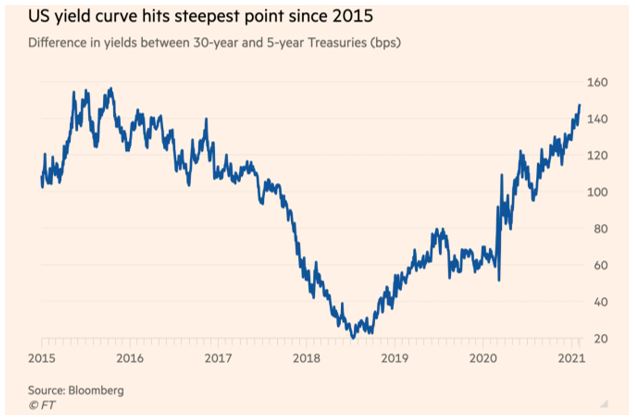
Besides Treasury supply the market should continue to see corporate issuance from companies like Apple and Alibaba, as seen by the latter selling $5 billion US$ denominated bonds out to 40-years in maturity at a spread just +100 bps to Treasuries. The total sale was 7X oversubscribed, confirming strong investor interest at current rates, but also identifying a lack of capital investment as share buybacks are one objective for the proceeds.
The Week in Review
It was a light week for Treasury issuance and reports with Friday’s weak jobs report the only major release. At +49,000 it was below consensus, plus December was revised down by 87,000 to -227,000. A lower Unemployment rate of 6.3% was explained by fewer workers seeking employment.
Stocks had their best week since early November as the NASDAQ improved by 6% while Newton’s theory of gravity proved only too true for GameStop, the previous week’s darling for punters. Down 80% on the week the company lacked the support it had previously received from online trading sites, allowing hedge funds to recover some of their losses as they reinstated short sales that, along with profit taking, punished the stock.
The Week Ahead
The SBA 504 program prices its February debentures, Treasury conducts its quarterly refunding, a lot of Fed speak and few economic reports.
Monday – Treasury sells $105 billion 13 & 26-week Bills
Tuesday – DCPC sale is announced; Treasury sells $58 billion three-year Notes
Wednesday – Treasury sells $41 billion ten-year Notes; CPI forecast at +0.3%; Jay Powell speech
Thursday – 504 program prices its 20 and 25-year debentures; Treasury sells $27 billion thirty-year Bonds
February 1, 2021
Equity Volatility Returns
A week that saw heavy Treasury issuance left rates unchanged while domestic equity markets saw the largest selloff since the week ended October 30, with the three major indices down from 3.2% to 4%, marking a pause, at the very least, in a long upswing. While we frequently report on the strong over subscriptions from buyers that the 504 program is experiencing in this cash rich, asset poor market there is an alternative trade in equities that captured headlines last week. It focused on short selling and that is a strategy employed by hedge funds to drive down the price of a stock this is considered overvalued.
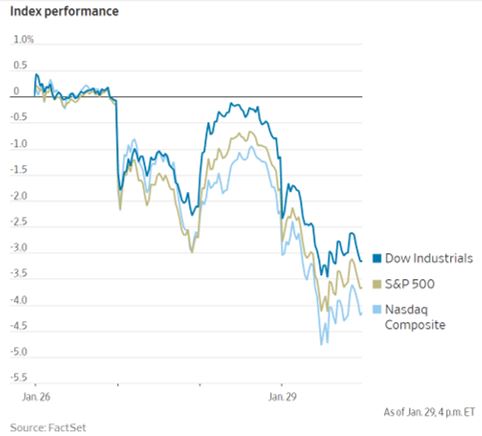
To do it, an investor needs to borrow shares and immediately sell them, hoping to buy them back later at a lower price, return the borrowed shares to the lender and pocket the money difference. What sent some company shares higher during the broad selloff was a short squeeze engineered through a social media outlet, Reddit, that saw “amateur” investors band together to buy stocks they knew had been shorted by certain hedge funds, forcing some of those funds to capitulate and cover their short positions. That action was counterproductive and costly for the funds as their demand for the shares drove the prices higher. Additionally, those investment firms may have had to sell some of their winning positions to rebalance and that process added to the overall market weakness. One such firm is Melvin Capital Management which lost 53% in January (more than $4 billion) due to this short squeeze and other positions in companies like AMC and Bed, Bath and Beyond.
In the case of GameStop, the company’s share price was higher by as much as 400% on the week, and this is a company with no profitability trading at a P/E ratio of -76. At some point it will have to justify its $23 billion valuation but for now it is the hottest of investments.
Recapping the market’s activity chaos reigned as trading was halted in some stocks, margin requirements were increased, and hedge fund managers cried foul, as they “were hoisted with one’s own petard.”
The Week in Review
The rates market remains in a vacuum and besides rally exhaustion other reasons given for stock weakness ranged from concern over the supply and distribution of vaccines to the three R’s as cited in a Bank of America research piece – “rates, regulation and redistribution are expected to end the bull market this year.” The rates increase is expected to result from increased stimulus and funding needs, with inflation to follow. Regulation is already being changed with multiple executive orders and redistribution is a challenging objective of the administration as critics contend it is more of a political issue than economic.
Economic reports were mixed, as is their custom:
- Consumer confidence was strongly above forecast but household spending fell for the second consecutive month
- FOMC will keep its easy monetary policy in place and continue purchasing $120 billion bonds each month while noting the pace of recovery has moderated.
- Durable Goods was +0.2% but far below forecast
- Personal Income rose 0.6% and the reason spending was down is an increase in household savings of 13.7%. That figure now stands at $1.7 trillion and represents consumers’ concern for economic stability
- 4QGDP closed the year strongly at 4.0%, leaving the yearly figure at -3.5%
- The Fed’s preferred inflation indicator was above consensus at +0.3% for the month and +1.5% Y/Y.
The Week Ahead
A very light week for Treasury issuance, Fed speak resumes, and we get Friday’s jobs report.
Monday – Treasury to sell $105 billion 13 and 26-week Bills
Wednesday – ISM report on business services
Thursday – Jobless claims
Friday – Non-Farm Payroll expected to be a slight gain after December’s -140,000 report.
January 25, 2021
Optimism
A week that once again saw little movement in rates saw equities manage slight gains with Nasdaq again ahead of the pack at +3.7%. The Financial Times writes about “A Massive second-half recovery: Biden, China and the Global Economy.” Its focus is the strength of global equities since Joe Biden’s election, China already showing strength as it avoided contraction in 2020 and promise of an economic rebound that admittedly is dependent on the success of the Covid-19 vaccines.
The MSCI all markets indexes are designed to represent the performance of the broad equity universe of individual countries and it has been strengthening the last three months: up 12.2% in November, 4.5% in December and 3.6% so far in January, after slumping in September and October.
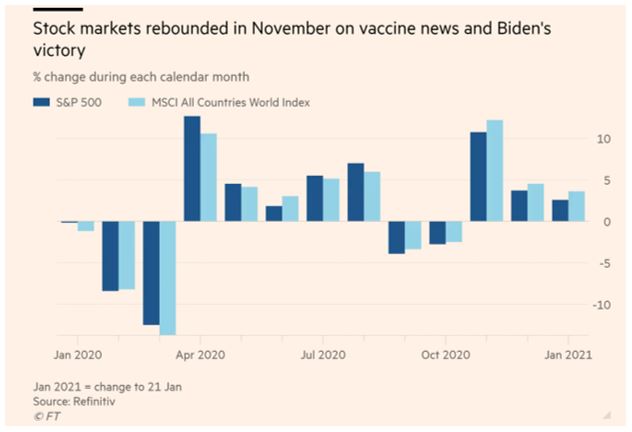
Equity strength does not always translate to economic well-being but with central banks in accord on an easy monetary policy, and with the new administration committed to “act big” on stimulus spending investors are encouraged that deficit spending can be accommodated at these low rates. The infusion of cash is needed, and Congress will agree on legislation even with Republicans resuming a sense of fiscal conservatism.
The “act big” was part of Janet Yellen’s remarks at her Senate Finance Committee confirmation hearing and identifies the Administration’s desire to provide as much aid as possible to avoid a protracted economic downturn.
More Good News (?)
Even with more than 25 million domestic cases of coronavirus having been reported, The Atlantic reports that the week ended January 21 saw:
- Reported tests reach a new weekly high
- New cases for the seven-day period were down 20%
- After sixteen-weeks of increases average weekly hospitalizations dropped 4%
Modest gains perhaps, but the Biden administration has pledged to overhaul how vaccines are distributed to states to accelerate vaccinations and protect more people more quickly. With more variants threatening to reduce these recent gains the need to complete this phase is heightened, as we mark the one-year anniversary of Wuhan, China being locked down because of the virus.
Reports
It was a light week for reports:
- Jobless claims were down slightly at 900,000 but remain elevated
- US Home Sales registered a December increase of 0.7% and at 6.76 million were up 22% y/y and the strongest in 14 years
A year-end meeting for the Eagle team, coordinated by Steve Van Order with the program’s underwriters indicate:
- The economic recovery and inflation will roll on
- New fiscal expansion will complement the easy monetary policy
- The yield curve should continue to steepen with the ten-year benchmark reaching 1.5% by year-end
- Rate and equity volatility will remain
- Institutional investors will need leverage to generate returns
The Week Ahead
Fed speak is confined to Chairman Powell’s Wednesday press conference at the conclusion of the two-day FOMC meeting; an active week for Treasury issuance; and economic reports conclude Friday with the Fed’s preferred inflation indicator.
Monday – Treasury sells $105 billion 13 and 26-week Bills and $60 billion two-year Notes.
Tuesday – FOMC meeting opens and Treasury sells $34 billion 52 week Bills and $61 billion five-year Notes.
Wednesday – Durable Goods expected to be +1%; Treasury sells $28 billion two-year Floating Rate Notes; FOMC policy announcement and Powell press conference at 2:30.
Thursday – 4QGDP expected to be +4.2%; Treasury sells $62 billion seven-year Notes.
Friday – Personal Income & Outlays forecast to show PI flat and core Outlays at 0.2% and 1.3% y/y.
January 19, 2021
$1.9 Trillion More, For Now
In a week that saw little market movement the headlines focused on infringement of First Amendment rights as tech companies cancelled President Trump’s accounts and President-elect Biden announced his stimulus plan. Initially, Twitter suspended the President’s account “to prevent him from posting more statements that might provoke violence like what took place at the Capitol on January 6th.” A day later his account was cancelled, prohibiting his access to 88 million (!!!) followers and Facebook followed suit. These actions were criticized for exhibiting political bias and will bring fresh scrutiny to the tech industry’s control over public discourse. One ironic development in this matter, according to a NY Times article, is the Chinese internet siding with the President, claiming these actions confirm nobody in the world enjoys free speech.
While Mr. Biden’s speech was free it does come with a significant cost and he was quoted as saying he was not concerned about funding it with debt as this is no time to be concerned about the budget deficit. At $1.9 trillion it follows the $900 billion package approved in December and the $2 trillion plan last March. By way of comparison the financial aid package from the financial crisis in 2009, the American Recovery and Reinvestment Act, cost $800 billion. This plan has two objectives – accelerate the battle with the virus and approach the income inequality it has imposed on people. $160 billion is targeted for a national vaccination program while supplemental unemployment benefits would be increased and extended to September, and individuals would receive another $1400 to compliment the $600 payment received last month.
With fiscal stimulus for infrastructure spending another issue to be considered, plus state aid to offset revenues lost to imposed lockdowns, more aid is expected to be on the new administration’s agenda and Janet Yellen will affirm that in her Senate confirmation hearing today. Concerning a budget deficit (100.1%) that already exceeds economic output she appreciates the debt burden “But right now, with interest rates at historic lows, the smartest thing we can do is act big.”
Mixed Economic Reports
- Unemployment claims rose sharply – 965,000 workers filed initial claims as the resurgent virus dramatically affected the service industry.
- In a speech following that release Fed Chairman Powell stated, “the economy is far from our goals,” confirming no change in policy should be expected.
- CPI and PPI came in as expected with ex-food & energy Y/Y totals of 1.6% and 1.1%.
- Retail Sales posted its third consecutive negative reading at -0.7% with November revised lower at -1.4%.
- Industrial Production was a bright spot at +1.6%, with strength in utilities and manufacturing output. Capacity Utilization increased to 74.5.
- China’s 4QGDP rose at 6.5%, with the full year expansion at 2.3%; one of the few economies to show growth y/y.
The Week Ahead
No Fed speak ahead of the 1/26-27 FOMC meeting, light Treasury supply, the Inauguration, and no major economic reports.
Monday – Martin Luther King federal holiday
Tuesday – Treasury sells $105 billion 13 and 26-week Bills
Wednesday – Treasury sells $24 billion 20-year Bonds, the Inauguration
Thursday – Treasury sells $15 billion 10-year TIPS
January 11, 2021
Rates Move Slightly Higher
A tumultuous week for protests and civics lessons as President-elect Biden was confirmed by the Senate after that legislative body was forced into recess when their chambers were invaded by rioters. Ultimately, Vice-President Pence submitted the results of the Electoral College vote and protocol was maintained. Surprisingly, that disruption had little effect on markets that led up to Thursday’s pricing of the 504 program’s debt. As mentioned later on in the commentary, long-term rates have continued to rise and that impacted this month’s sales, but the end result was debenture rates only modestly higher m/m as investor demand for our product remains robust. The benchmark ten-year Note was higher this month by 11 bps yet the 20 and 25-year debenture rates were set just 7 bps higher. That performance, as confirmed by Steve Van Order, reflects both the value of DCPC’s as well as the amount of cash available for investment. Additionally, the program’s two Underwriters, BAML and Credit Suisse continue to introduce new investors to the product, resulting in strong subscriptions. This chart identifies how the long-term rates of 1.18% and 1.28% resulted in ongoing effective rates for small business borrows of 2.66% and 2.70%, both significantly lower than the Prime Rate, and even lower when guarantee and servicing fees are waived.
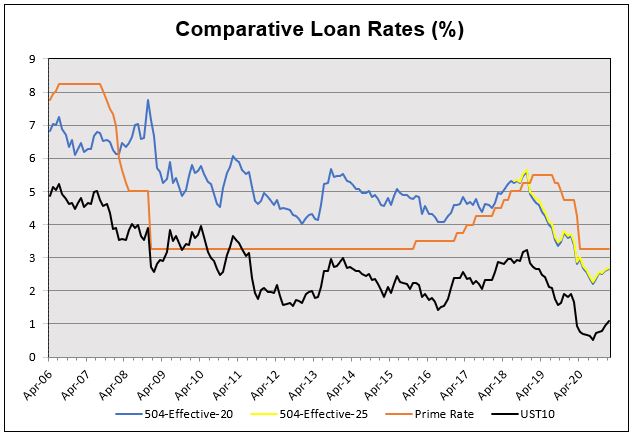
Reflation
Confirmation of the Blue Wave has lent support to a trade that has been developing for several months – a curve steepener, whereby traders buy shorter dated Treasuries and sell short, longer maturities in expectation of increased inflation. This Financial Times chart shows the spread relationship between the 5-year Note and 30-year Bond has doubled in one year. With more Democratic led stimulus and state aid to be authorized, inflation is expected to rise as will the amount debt to be issued by the Treasury.
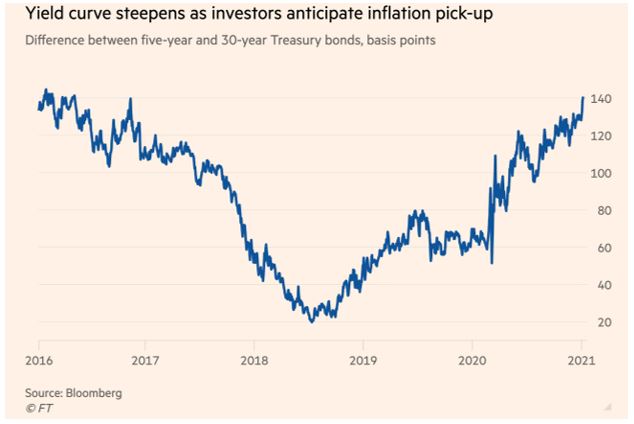
Lending support to the concept of this trade is the increase in the break-even rate, the difference between the ordinary yield on Treasuries and the real yield as expressed by Treasury Inflation Protected Securities (TIPS). Last week the ten-year break-even rate rose above 2% for the first time since 2018 as the ten-year Note closed at 1.12% and ten-year TIPS were -0.98%.
One market not experiencing higher rates is mortgage finance. With reduced housing inventory and surging property values 30-year mortgages remain near 2.70% and industry analysts state they have room to fall because of the gap between that rate and the yield on government-insured mortgage backed securities that are used to fund mortgages.
Reports Last Week
Last week’s most challenging release was the update on increased infections and deaths resulting from the coronavirus, plus the increased exposure from its more transmissible variant that has been detected in 45 countries and at least eight American cities. Delays in vaccine distribution and inoculations are causing concern about staying ahead of increased caseloads to protect people ahead of mutations affecting the vaccines’ effectiveness.
December’s 140,000 jobs drop was the first since April and the annual total of 9.37 million jobs lost for 2020 exceeded the financial market collapse of 5.05 million reported in 2009 and was the worst since 1939. Domestic indices paid the report no attention as they closed the week at record levels, preferring to look past political turmoil and economic weakness to focus on expected stimulus measures.
Minutes of the December FOMC meeting contained no surprises as the meeting took place before the 2021 Consolidated Appropriations Act was passed, but the Committee did express concern about the strength of the economy and does not plan on increasing its monthly $120 billion of bond purchases. It did forecast the economy to grow at 5.1% in 2021 with the unemployment rate to decline to 5%.
The Week Ahead
Fed speak, an active Treasury calendar ($225 billion), and several reports.
Monday – Treasury sells $105 billion 13 and 26-week Bills and $58 billion 3-year Notes
Tuesday – Treasury sells $38 billion ten-year Notes
Wednesday – CPI forecast at +0.4%; Treasury sells $24 billion 30-year Bonds; SBA 504 program funds its January sales
Friday – Industrial Production expected to be +0.6%; PPI forecast is +0.3%; Retail Sales consensus is -0.1% after a -1.1% decline in November
January 4, 2021
New Year – Same Fear
Welcome back to what we hope will be a healthier year that also can build on some of the faltering economic growth that needs to be sustained. Even with the development of at least two FDA approved vaccines distribution has not met expectations as COVID-19 related infections and deaths are surging. Add to that a more contagious strain and it feels as if we are no better off than in March. As much as authorities beseech people to wear masks, wash frequently and abide by social distancing it is clear that pandemic fatigue weighs heavily for people to follow that advice.
Politics
The election is over, right? Last month the Electoral College voted to confirm Joe Biden’s election victory and that vote moves to the Senate for affirmation on Wednesday even as a number of Republicans seek to reject that victory. Additionally, the runoff election for both Senate seats in Georgia is to be held the previous day and that result holds significant consequences for the balance of power in the Senate and the feasibility of the proposed Biden agenda.
The 2021 Consolidated Appropriations Act has extended some benefits originally contained in the Cares Act and added some provisions that will enhance the utility of the 504 program. NADCO has estimated as much as $9 billion may be available for SBA to use.
Looking back
This WSJ chart shows how the benchmark ten-year Treasury yield declined 87 bps on the year, pausing after the Fed reversed course and resumed its zero interest rate policy in March.
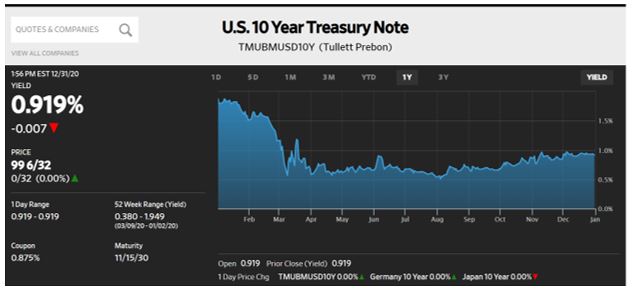
That change in policy was in response to the pandemic and the Fed has indicated it will remain in place until inflation averages more than 2% or employment and economic strength exceed forecasts. In addition to Cares Act initiatives helping small business borrowers the SBA 504 loan program was aided by strong investor demand that saw its 25-year pricing spread to Treasuries tighten by almost 30 bps. Lower rates and tighter spreads resulted in a 25-year debenture rate as low as 1.01% in August with a calendar year record of 6,355 loans totaling $5.1 billion.
Looking Ahead
While the Fed intends to keep short-term rates low the reality of supply and demand will have a stronger impact further out the curve. This Financial Times chart states Treasury will “flood the market with long-term debt,” meaning maturities longer than one-year. The key phrase in the chart is “Net of Treasuries excluding Fed purchases” as the bank has affirmed its plan to continue purchasing $80 billion Treasuries each month, plus $40 billion mortgage-backed securities.
Just as borrowers who have adjustable rate loans might look to refinance into a fixed-rate loan Treasury is shifting its funding to longer-term debt and while they have begun to buy more longer maturities their issuance will exceed their purchases. With $1.8 trillion falling into this category Treasury may be forced to deal with higher rates to attract investors.
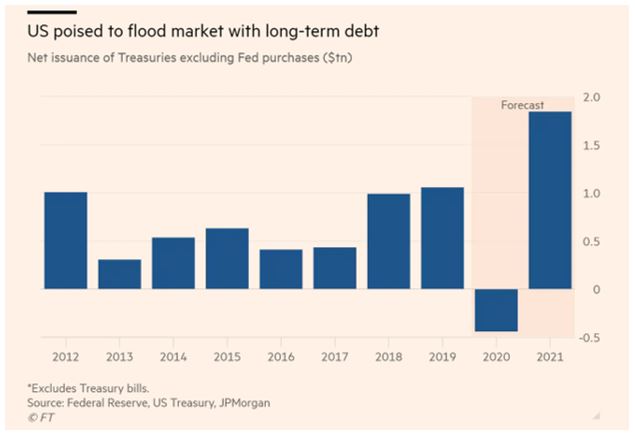
The WSJ chart of the ten-year Treasury shows how its rate has risen since the summer as this possible demand gap surfaced. Adding to the challenge of attracting investors is the steady decline of foreign buying that has slid to a 20-year low. Ten years ago, foreign investors held 55% of outstanding Treasury debt and that figure is now 35%. Some countries like Japan can be expected to add to inventory but China has continued to shrink its holdings, a trend that will put more pressure on domestic investors.
Last year’s “everything rally” seems poised to continue as the S&P 500 index reached its 33rd record of 2020 last week while Bitcoin ended the week at $30,000, representing a 200% gain y/y.
The Week Ahead
SBA 504 program prices its 10, 20, and 25 year debentures; some Fed speak, a light week for Treasury sales and the jobs report is the biggest on the economic calendar.
Monday – Treasury sells $105 billion 13 and 26 week Bills
Tuesday – Institute for Supply Management manufacturing report to show a slight decline
Wednesday – Minutes of the December 16 FOMC meeting are released; an undetermined amount of 4 and 8-week Bills to be auctioned
Thursday – 504 program to price its January debenture sales with the benchmark Treasury basically unchanged from December
Friday – Non-Farm Payroll expected to be +100,000
December 21, 2020

Covid-19 Remains the Year’s Story
The above statements are polar opposites as we approach year-end - good wishes to celebrate what we can be grateful for and vivid recollections of a virus infused year. In the tenth month of this pandemic even the approval and initial injections of vaccines are overshadowed by news the UK imposed fresh lockdowns “to curb a new strain that appears to be significantly more contagious than earlier versions of the pathogen.” The new restrictions are focused in the London area, but similar, more aggressive steps are being taken throughout Europe and some countries have banned flights involving the UK. Add to that the “extra mile” that EU and UK negotiators are going to prevent a hard Brexit at year-end and things become very unsettled.
Starts and Stops
The markets and the economy have been buffeted by weakening economic reports, increasing numbers of jobless claims, erratic stimulus discussions and stop-gap measures to avoid a government shutdown. Adding to these factors is the increased infection rate that is forcing cities to scale back business operations, affecting a disproportionate number of small businesses. A Bureau of Labor Statistics report cites employment losses at small businesses have been twice as large as at large businesses though BLS does not know how many of those losses will be permanent.
As Congress negotiates the details of the next stimulus bill the Federal Reserve Bank made its feelings known again on Wednesday as Chairman Powell urged more stimulus to compliment the monetary policies already in place with the Fed. Additionally, as the header for this WSJ chart indicates the bank sees an economic rebound next year as they clarified their plans to support the economy for longer than they have in prior downturns. That means a zero interest rate policy for longer, with continued purchases of Treasury and Mortgage backed securities.

Reports
Retail Sales was the most significant report and it disappointed, coming in at -1.1% more than three times larger than forecast; plus, October sales were revised down to -0.1% from +0.3%. The report suggests the recovery is slowing after a burst of growth over the summer has been affected by a surge of virus infections. Industrial Production was as expected at +0.4%.
Markets
The bond market marked time with the ten-year benchmark moving up to 0.94% as the market believes the $900 billion stimulus package will be approved, meaning more debt to finance. Equities showed some gains with the tech heavy Nasdaq again leading the way, up 3% on the week and almost 40% for the year. Yearly gains for the other major indices are more muted with the S&P 500 up 15% and the DJIA positive by just 5%.
For risk takers the biggest return YTD is Bitcoin which is starting to gain acceptance as an asset class with institutional capital now involved. At week’s end, the currency sat at $23,861, a gain of 300% on the year.
Looking Ahead
No one could have predicted a crisis that would result in 315,000 deaths with travel restrictions and much of the service sector shut down and have the stock market rally as previously mentioned. Much of that move was driven by technology as workers adapted to working from home while traditional providers (think DJIA) flattened out or were victims of that change. While the Fed has committed to a zero interest rate policy into 2022 that does not mean rates will not rise, especially in longer-term maturities. Additionally, industries like travel, leisure and retail malls could recover with the aid of virus vaccinations and adherence to social distancing, at least in a modified way. It is hoped that such a combination will contribute to an economic recovery as forecast by the Fed.
Everyone associated with Eagle Compliance wishes you a Merry Christmas and a Happier New Year! Next commentary will be posted January 4, 2021.
The Week Ahead
No Fed speak, the Fed’s favorite inflation gauge, and Treasury auctions $168 billion of debt.
Monday – Treasury sells $105 billion 13 and 26-week Bills and $24 billion 20-year Bonds
Tuesday – Treasury sells $15 billion 5-year TIPS; 3QGDP expected to be 33.1%
Wednesday – Treasury sells $24 billion 2-year Floating Rate Notes, Personal Income & Outlays
Friday – Markets closed for Christmas
December 14, 2020
SBA 504 DCPC’s Outperform Treasuries
In a month where the benchmark ten-year Treasury rate increased 16.6 bps the 20-year DCPC priced last Thursday rose by just 6 bps as investor demand for the product is robust. December marked the eighth consecutive month that pricing spreads have tightened and the program’s Selling Agent, Steve Van Order, reported this month’s tightening was achieved by over-subscription interest of as much 4X issue size. Such was the demand that the pricing spreads were reduced by 8 and 7 bps respectively for the 20 and 25-year debentures.
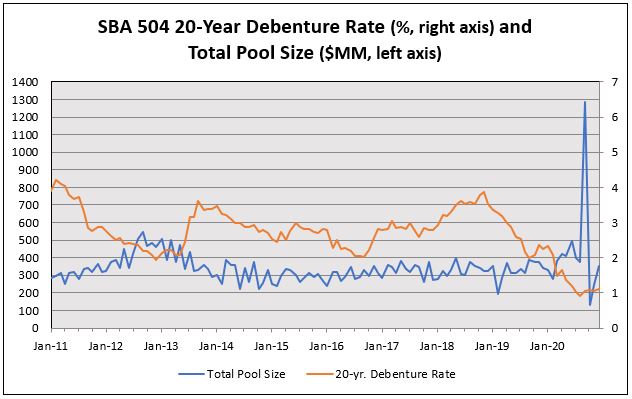
After recovering from the hangover effect of the September sale’s record issuance December’s sale of $354,092,000 was almost equal to that of the previous two-months combined and approximated the monthly average leading up to September. That is an encouraging sign for the program’s growth, along with approved loan data through November that is equal to the year-ago period which was 30% greater than its previous period.
The Week in Review
The rates market accommodated the Treasury supply well, with the ten-year benchmark declining 7 bps to end the week at 0.90%.
- Globally, more countries like Italy (really) joined Germany and France with longer-term negative rates, as their seven-year debt now trades at -0.02%. That illustrates the search for yield that has propelled equities to record levels though they marked time last week because of stalled stimulus talks.
- IPO’s are a different story as recent offers like Airbnb doubled in price and Door Dash gained 86% in its first day of trading.
- Hospitalizations continue to increase as cities expand lockdown rules and daily deaths exceeded the previous record levels set in the Spring
- Inoculations have begun in the UK as No-Deal Brexit looms but with both the UK and EU saying they are committed “to go the extra mile” to reach an agreement
- FDA approval of Pfizer’s vaccine has been granted with shipments ready to start this week. You might think the company’s stock would be a big winner with this development, but it is up just 12% ytd
- Jobless claims unexpectedly rose to 853,000
- The Senate passed a stop-gap measure to fund the government for one-week to avert a shutdown
Dates to Note
Monday – December 14 – the Electoral College votes
Wednesday – January 6 – Congress votes to certify the Electoral College vote
Wednesday – January 20 – the Inauguration
The Week Ahead
Treasury is scheduled to sell just $105 billion 13 and 26-week Bills, FOMC meeting begins Tuesday with the Fed expected to subtly change continuance of its $120 billion per month bond buying program until the recovery meets certain conditions, instead of “continuing at their current pace over the coming months;” and the 504 program funds its December sale, concluding its largest calendar year issuance with over $5.1 billion sold.
Monday – Treasury sells 13 and 26-week Bills
Tuesday – FOMC meeting begins; Industrial Production consensus is 0.3%
Wednesday – 504 debenture sales fund, FOMC announcement and Jay Powell press conference; Retail Sales forecast is -0.3% due to drop off in fiscal stimulus and mixed signals for Black Friday sales
December 7, 2020
Ongoing Rally
Shrugging off increased hospitalizations caused by the corona virus the major US stock indices climbed to record highs on the same day for the first time in almost three years, aided by hopes of renewed stimulus negotiations along with developments for vaccines. The end of week gains ignored the weaker than expected jobs report that came in at 245,000, almost half of what was expected. Though registering its seventh consecutive month of gains the November report continued a declining trend. Even the positive decline in the unemployment rate to 6.7% was influenced by “discouraged workers,” meaning those Americans who have stopped looking for work. Limited job opportunities and increased childcare responsibilities are identified as causes as the labor force participation rate of 61.5% is at the lows from the 1970’s.
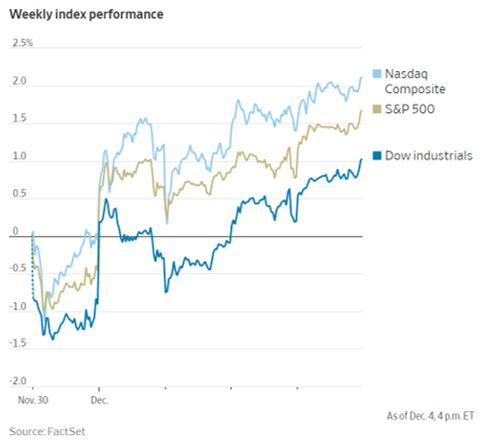
The decline from last month’s total of 610,000 suggests the economy is slowing as only 12 million of the 22 million jobs lost to the pandemic have been recovered and at this pace it could be two to three years before employment can return to pre pandemic levels.
Reflation?
While stocks continue to defy expectations, bonds are starting to show concern for the increased issuance that will result if the proposed $908 billion stimulus package is passed. The benchmark ten-year Note rose 13 bps on the week as the market expects more supply in the back-end of the curve and senses a hint of inflation. That sense derives from the ten-year “break-even” rate (current ten-year yield minus ten-year TIPS rate) that traders track as it hit 1.92% Friday, its highest point in 1 1/2 years.
As the 504 program prepares to price its December debentures the benchmark Treasury finds itself at the upper end of the pandemic period range that it has tested several times recently and confirmation of more stimulus could move it higher.
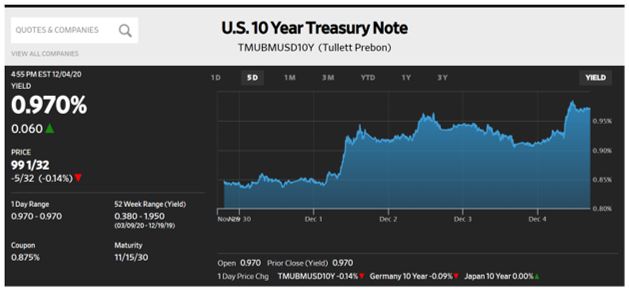
Other Items
Another asset losing its safe-haven luster is the US$ which has weakened for the third consecutive week and is down 6% ytd. A factor in this move is the prospect for an improved global economy as vaccines become available and local markets and currencies attract more investment.
Coming Due
While certain elements of the Cares Act were very beneficial to small business borrowers, moratoriums in other sectors of the economy are coming to an end December 31st. A NY Times article reports as many as 30 million Americans are at risk of losing their homes and it seems no government at any level is prepared for the consequences. Similar to the financial market collapse private equity firms will look to buy foreclosures, but before that can happen we can expect more requests for federal aid to avert such a disaster. Since the proposed $908 billion stimulus bill is yet to be written it is uncertain if it would contain any help for these renters and homeowners, but such aid can be expected to be proposed and that will add to the government’s debt burden.
The Week Ahead
No Fed speak during the blackout period ahead of the December 15-16 FOMC meeting, Treasury conducts its quarterly refunding, and another light week for economic reports.
Monday – Treasury sells $105 billion 13 and 16-week Bills
Tuesday – Treasury sells $56 billion three-year Notes
Wednesday – Treasury sells $38 billion ten-year Notes
Thursday – Treasury sells $24 billion thirty-year Bonds: SBA 504 program prices its December debentures
Friday – Final demand core PPI expected to be 0.2% and 1.3% y/y
November 30, 2020
Coronavirus Surge
Covid-19 infections have exceeded 100,000 per day for the last 27 days, averaging more than 166,000 each day last week. Hospitalizations and deaths are also on the rise as some hope is provided by the imminence of vaccines with distribution details and priority for vaccinations to be determined. United Airlines announced plans for distributing Pfizer’s vaccine, pending FDA approval, yet even with this advance restrictions are expected to remain in place for several more months.
The Week in Review
- Durable Goods orders were above consensus at +1.3%
- 2nd estimate of 3QGDP was confirmed at 33.1%
- Personal Income was sharply lower than forecast at -0.7%, probably an indication of federal stimulus payments having ended
- Personal Consumption Expenditures was flat as expected, with its y/y rate of +1.4% unchanged
- Even after a second consecutive rise in jobless claims analysts are calling reduced market volatility in the US as beneficial for continued equity strength as the DJIA is poised to end its best month in 33 years. Prospects in the UK are not as attractive as its GDP is expected to decline 11.3%, its largest fall ever with its Chancellor warning “the economic emergency has just begun.” Adding to this gloom is Britain’s inability to strike a post-Brexit agreement with the European Union as its mid-January transition period is coming to an end. Reflecting this trade and policy uncertainty is YTD its FTSE 100 index is down almost 20%.
One cautionary note on the domestic equity performance is the increased amount of money piling into leveraged ETF’s where the funds use leverage to double or triple returns. $16.3 billion has found its way into these funds this year and is on track to surpass the record amount set in 2008, an ominous comparison.
Alternative Investment
In a week where President Trump came close to conceding the election the Treasury market absorbed heavy issuance with the benchmark ten-year Note holding at 0.84%, the S&P 500 and Nasdaq indices setting new records, and investors who sought diversification in crypto currencies saw Bitcoin hit a record high of $19,510 last week, only to decline 14% before its close on Friday. This volatile and highly criticized commodity is up 300% from its March low and its advocates view this strength as a sign of new support from institutional investors, or possibly work from home traders. Leading hedge fund managers have endorsed it and even PayPal has begun accepting payments in the currency.
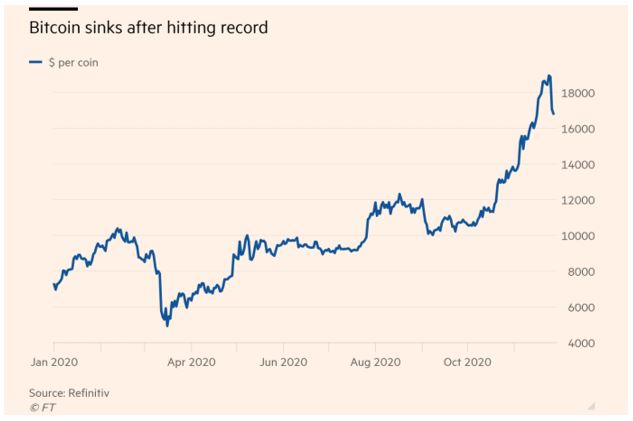
Of some concern is the unregulated status of bitcoin as no central bank supports it and it does have an unstable history by trading as high as $19,000 in 2017 before cratering to as low as $3,000 in late 2018. Market entry by professional asset managers other than hedge funds is probably needed for bitcoin to sustain this growth, with or without central bank recognition.
The Week Ahead
A light week for Treasury issuance and economic reports while Fed speak will focus on Fed Chairman Powell making his semi-annual Congressional testimony along with Treasury Secretary Mnuchin.
Monday – Treasury sells $105 billion 13 and 26-week Bills
Tuesday – Treasury sells $34 billion 52-week Bills; Powell and Mnuchin speak to Congress
Wednesday – Second day of testimony
Thursday – Institute of Supply Management forecast to shoe an increase in the services sector, but at a slower rate
Friday – Non-Farm Payroll expected to be 435,000, notably slower than 638,000 last month
November 23, 2020
Investment Dilemma
Treasuries once again proved to be resilient even as demands for more stimulus requiring increased funding continue to be made. The benchmark ten-year Note closed the week 8 bps lower at 0.82% as:
- The Presidential pursuit of election fraud continued
- Equities stagnated as the S&P 500 index paused after a 5.6% gain since the November 3 election
- Investors look to riskier assets for yield
This WSJ chart identifies why the rate for the lowest rated corporate credit set a recent all-time low of 4.8% as focus is directed to “real yield,” the interest rate on a bond after compensating for inflation. At 0.82% the benchmark ten-year Note actually costs an investor almost a dollar after inflation for every $100 they own. The security of a full-faith & credit bond and its liquidity are reassuring but they don’t do much for income.
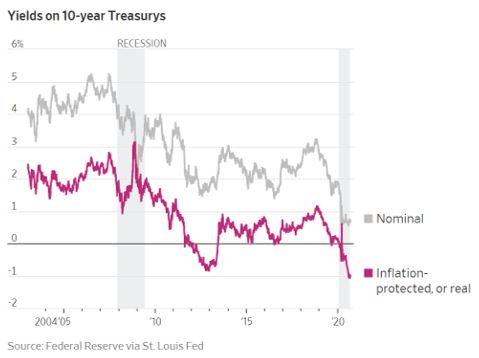
The zero interest rate policy that has been in effect for much of the last decade has sponsored equity investment as an alternative to low bond rates and it is questionable if this asset class can maintain its strong performance. A Financial Times article referenced how a plain vanilla 60/40 portfolio of global equities and US bonds is now projected to provide an annual return of just 4.2% over the next 10 to 15 years compared to a 5.4% return last year and 10.2% on such a portfolio since 1980.
The Week in Review
Adding to investor uncertainty was the announcement by Treasury Secretary Mnuchin to wind down several emergency credit facilities that have allowed the Federal Reserve Bank to buy corporate and municipal debt, extend loans to medium-sized businesses and support asset-backed securities. The announcement was contained in a letter to Fed Chairman Powell who stated the bank would prefer to keep “the full suite of tools as a backstop for our still strained and vulnerable economy,” but the bank will abide by the directive and give back the remaining funds from the expiring facilities. Not affected by that mandate is the Fed’s continued purchase of Treasury debt, something that has served as an offset to the increased Treasury issuance. As much as the bank would prefer to retain the authorizations their existence alone helped restore market confidence, without much of the money being spent.
In economic reports Retail Sales was slightly below consensus at 0.3% and Industrial Production was on target at 1.1%.
The Week Ahead
Fed speak, a heavy Treasury calendar and economic reports including the Fed’s preferred inflation gauge.
Monday – $105 billion13 & 26-week Bills, $56 billion 2-year Notes and $57 billion 5-year Notes
Tuesday – $24 billion 2-year Floating Rate Notes and $56 billion 7-year Notes
Wednesday – Durable Goods expected to be +0.5%, 2Q GDP at +33.1%, and Personal Income & Outlays with PCE expected to decline slightly; release of Minutes from the November 5 FOMC meeting
Thursday – We hope you enjoy whatever pandemic affected gathering you can achieve for Thanksgiving!
November 16, 2020
Conflicted, possibly Schizophrenic
Those are the words that might describe not just market activity but most people’s perception of life in the ninth month of the Covid-19 pandemic. Here are some of the issues that we face:
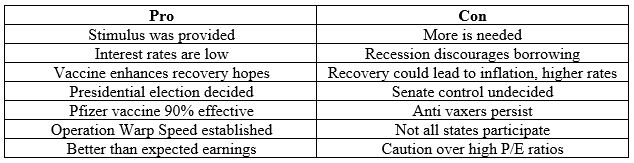
The surge in new corona virus cases that led up to the election has since accelerated as more than one in every four hundred people tested positive last week. With President Trump yet to concede and his administration’s approach to the virus in conflict with that of President-elect Biden the result is uncertainty, yet another conflict. Even with a vaccine whose availability is uncertain, and to whom it will be made available is undecided, some additional amount of time will be needed before people return to office buildings and resume business and recreational travel. That reality leaves us more hopeful than confident about short-term prospects as this NY Times chart shows the recent spike in infections.
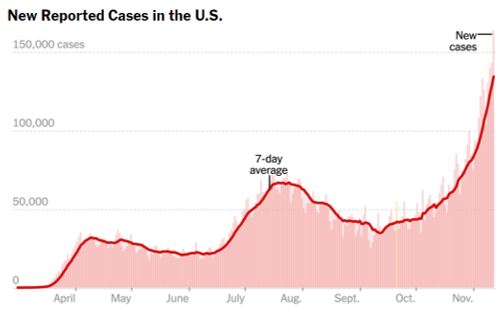
Market Activity
Vaccine optimism helped the S&P 500 index close at a new high, up 2% on the week while the DJIA was +4%. One market that was not buoyed by the news was the Nasdaq which had previously outperformed, but which has given way recently to more value oriented stocks. The rates market initially reacted as expected in the face of good prospects for the economy with the benchmark ten-year Note rising as high as 0.97% before Veterans Day only to see renewed buying interest at that level.
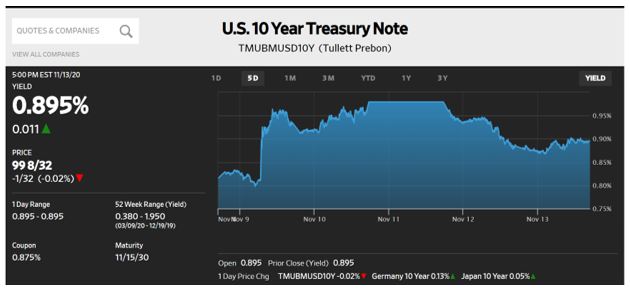
Economic reports last week focused on inflation and both CPI and PPI were below forecast at y/y levels of 1.6% and 1.1%, respectively (ex food & energy).
The Week Ahead
Fed speak, a light economic calendar, and relatively light Treasury issuance.
Monday – Treasury sells $105 billion 13 & 26-week Bills
Tuesday – Industrial Production expected to rebound to +0.9% after declining 0.6% in September
Wednesday – Treasury sells $27 billion 20-year Bonds
Thursday – Treasury sells $12 billion 10-year TIPS
November 9, 2020
A Purple Wave, Maybe
Former Vice-President Joe Biden has been elected the 46th President of the United States though a concession from President Trump remains pending. As for market reaction to the potentially split Congress stocks marked time on Monday and then moved sharply higher as expected spending from a Blue Wave victory faded, but the outcome did provide more certainty than feared. Domestic indices had their best week since April as the S&P 500 and Nasdaq closed within 2% of their September highs.
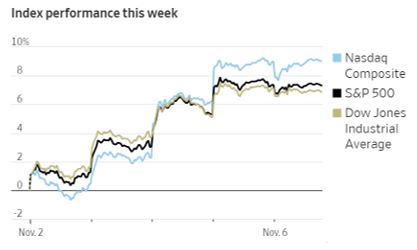
Less conviction was on display in the rates market as Treasuries rallied into the 504 debenture pricing on Thursday after spiking higher on election day as trade activity indicated fear of a Democratic sweep. That fear was based on concern over increased funding needs to support lost revenue to states as well as increased support for depleted pensions and other proposed initiatives. The benchmark ten-year Note closed the week at 0.82%, about 5 bps above where the DCPC’s were priced as more concern surfaced about Senate races remaining in play. Both races in Georgia are headed to a January runoff as neither victor could claim the necessary 50% majority and if the Democrats win both seats the Senate would be split 50/50. In that scenario Vice President Harris would have the deciding vote increasing the chances for a progressive agenda. That development would increase funding needs, creating an environment where the Fed would need to increase its already significant amount of purchases to avoid increased supply pressures on the market. So, even with resolution of the Presidential race uncertainty will be in play until 15-days before the January 20 inauguration.
SBA 504 Program
The November sales for the 504 program were again well received with strong investor demand that resulted in tighter pricing spreads to benchmark Treasuries. The below chat shows the continued low rate for 20-year debentures while graphically showing the surge in funding size for the last eligible month of Section 1112 debt forgiveness in September and the resulting decline to below average levels the last two-months. That drop in volume is 50% vs. the same period last year, but is expected to reverse itself with the help of low interest rates and approved loans from FY2020 that were up 18% y/y.
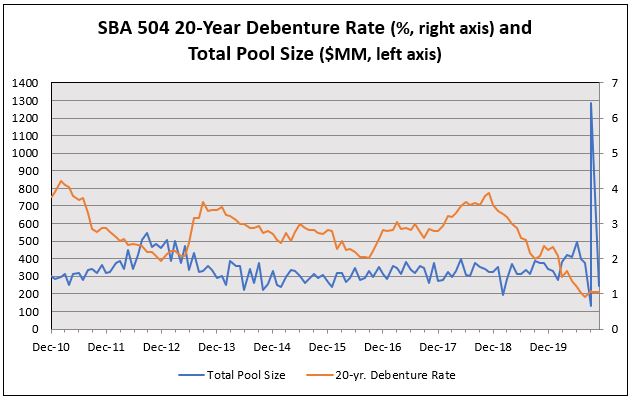
The Week in Review
The election and stock market performance were center stage but Fed comments seeking more fiscal stimulus were the key take away from last week’s FOMC meeting. Chairman Powell asserted policy would be held steady until full employment is achieved, and inflation averages 2% over a period of time. What the Committee seeks is the type of monetary and fiscal coordination expressed by the UK as its government announced 80% pay for furloughed workers would be provided through March as the country renters an economic lockdown.
The key economic report was Non-Farm Payroll, and it came in above consensus. Job gains were 638,000, the unemployment rate declined to 6.9%, and 12.1 million of the 22 million jobs lost during the pandemic have been regained. Analysts now describe this recovery as K shaped – some worker layoffs and industries are advancing while others face a worsening situation. This leaves those unemployed with the task of finding new jobs as industries where they had been employed are recovering more slowly.
The Week Ahead
Fed speak resumes, Treasury conducts its quarterly refunding, and some inflation data.
Monday – Treasury sells $105 billion 13 and 26-week Bills and $54 billion 3-year Notes
Tuesday – SBA 504 program funds its November debentures, Treasury sells $41 billion 10-year Notes
Wednesday – Veterans Day
Thursday – Treasury sells $23 billion 30-year Bonds; CPI expected to be +0.2%
Friday – PPI forecast as +0.2%
November 2, 2020
No Stimulus, More Covid-19
In last week’s commentary Steve Van Order touched on several topics that only became more prominent as Covid-19 infections continue to spike, eliminating the “maybe it will go away” hope that is just that. It was the worst week so far with more than 500,000 cases reported with 1200 counties (one-third of the country) qualifying as hot spots. This surge of infections in the US and Europe is having a strong influence on economies, markets, and the upcoming presidential election. On Saturday, the UK joined France, Germany, Belgium, and Ireland by locking down activity in the country for a month, something that can only worsen the pending impact of Brexit.
As the week played out:
- The three major US indices all suffered weekly losses greater than 5%
- For the month, the losses were 2%, their second consecutive negative performance
- Safe-haven trades didn’t provide any comfort either as gold weakened and Treasuries failed to hold their mid-week gains with the benchmark 10-year Note rising 17 bps for the month.
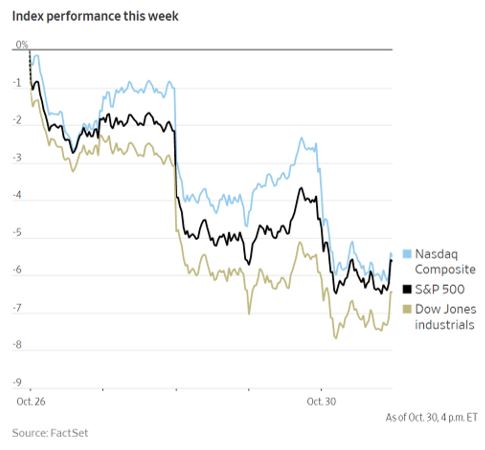
Blue Wave
The intent of the Federal Reserve Bank to maintain its zero-interest rate policy until after inflation reaches its 2% target is being challenged by the market as the potential Democratic sweep of Congress and the White House is raising expectations of increased government spending. The Treasury will continue to sell trillions of dollars of debt to fund tax cuts and economic relief packages and more of it can be expected in longer-term maturities. As rates increased last month the steepness of the Treasury curve, as measured by the spread between the two-year and ten-year Notes, also increased, matching the 17 bps rise in rate as investors will seek more yield for absorbing that increased supply. Of most importance to small business borrowers in the SBA 504 program is the closing level on CT-10 was just 10 bps above where the October debentures were priced.
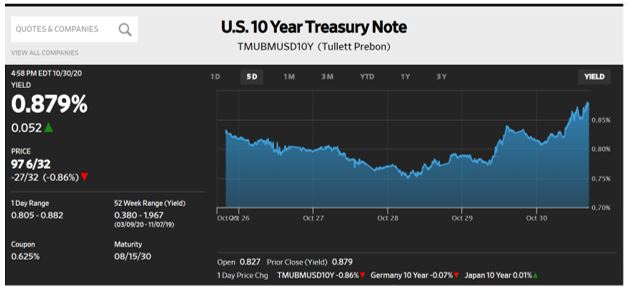
One sector that is showing strength is the housing market as prices are up 5.7% as existing home sales topped 6.5 million through September. Another benefit of the Fed’s zero interest rate policy is mortgage rates under 3%, making debt service more manageable than in the housing bubble twelve-years ago and providing sustainability for the market.
Economic Reports
A strong week for reports that like robust quarterly reports from tech companies like Amazon and Facebook failed to improve performance:
- Durable Goods gained 1.9%, far above consensus of 0.4%
- GDP also was above consensus at 33.1%, reversing the previous reading of -31.4%
- Personal Income was 0.9% vs. a forecast of 0.3%, partially offsetting August’s reading of -2.5%
- Personal Consumption Expenditures was as expected at 0.2% and y/y core declined to 1.5%
The Week Ahead
All eyes on the election, a light Treasury calendar, the FOMC meets, and the SBA 504 program prices its November debentures.
Monday – 13 and 26 week Bill auctions; Institute of Supply Management expected to be steady
Tuesday – Election Day; 52-week Bill auction
Wednesday – FOMC meeting begins a day later than usual due to Election day
Thursday – SBA 504 program prices 10, 20 and 25 year debentures; FOMC meeting ends with policy announcement and Jay Powell press conference
Friday – Non-Farm Payroll projects a gain of 600,000 jobs but with the unemployment rate remaining elevated
October 26, 2020
Last week the 10-year T-note yield decisively broke above recent highs and hit 0.87%. That level looks back to early June when markets had been lulled into a sense of maybe it will go away as the U.S. Covid-19 case trend flattened out.
This week we clip in our marked-up chart (below) showing key events and levels in 2020 to-date for the S&P500 index (SPX, blue line) and the 10-year T-note yield (TNX, black O/H/L/C bars). We can see that late spring “go away” hope in the chart below (written in blue ink). The hope was dashed by mid-June, notice the sharp decline in the SPX and TNX levels by then.
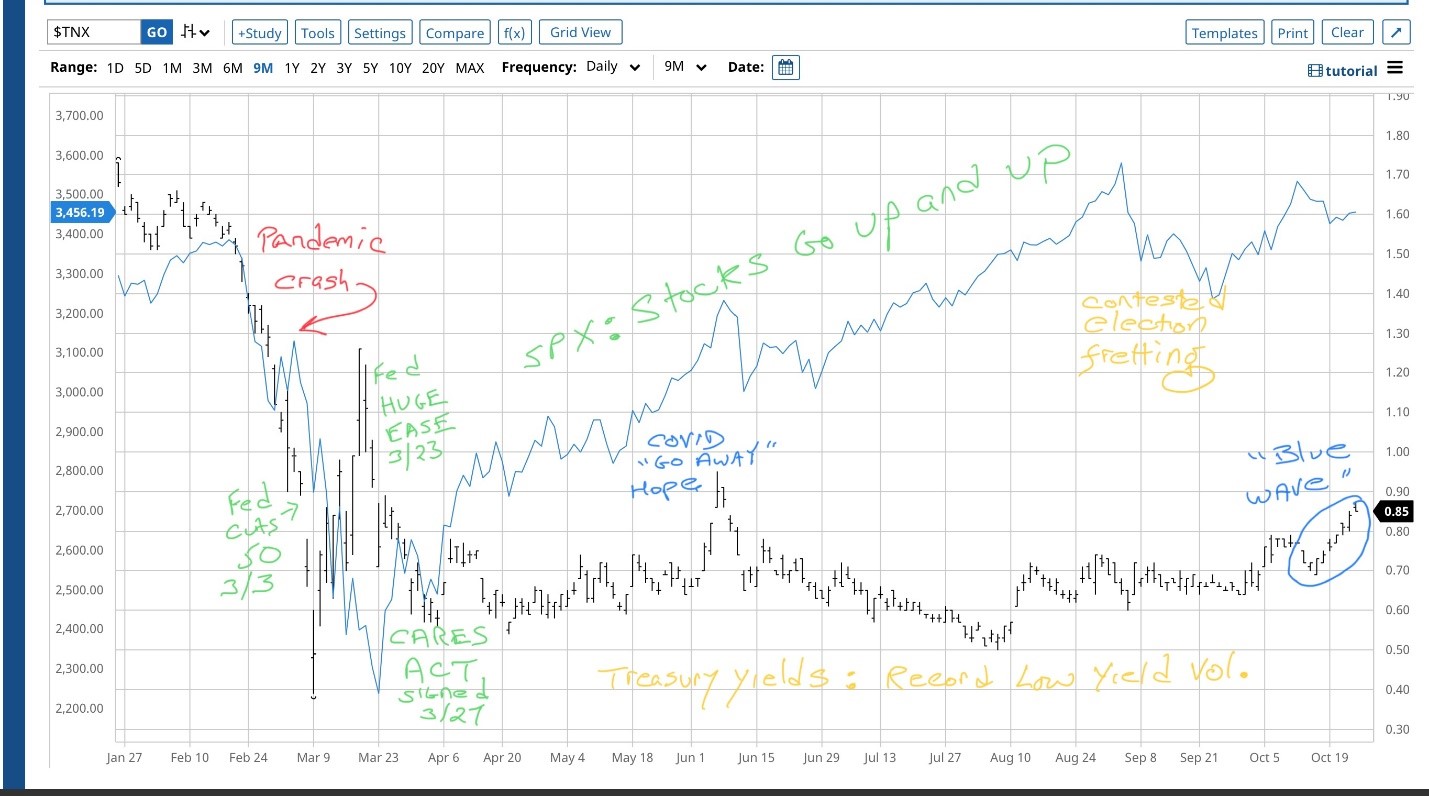
This chart also reminds us of how hard stocks crashed in February and March with just a brief pause when the Fed cut 50 bps on March 3. That was followed by the Fed’s bazooka ease of March 23 and the CARES Act signing on March 27. Those two events set up the bottom in stocks and stalled the downward push in the T-note yield. From there, except for the end of the “go away” hope in June, stocks rose pretty steadily, while the T-note yield stayed very low and historically stable (as measured by options market expected yield volatility).
Once we got into September, fretting over a contested election (yellow ink) and the return to school Covid-19 case rise got into stock picker heads as did realization that there were profits to take before November. Into October, bond traders calculated rising odds of a Democrat sweep, a “blue wave.” This calculation was driven by a number of adverse developments for the Trump re-election campaign including a material upswing in Covid-19 cases, and the President’s strange behavior during the first debate and during his Covid-19 illness.
As a result, bond traders pushed T-note yields higher on the shortened odds for a “blue wave” (circled in blue ink). The “blue wave” would mean a very big stimulus package passing early next year, a figure well over $2 trillion based on the bill the House already passed. This would 1) provide more support for GDP growth but 2) need be funded by even more Treasury issuance. They are both reasons to demand more yield to buy Treasuries. The Treasury market has to absorb massive supply every week even with supporting Fed purchases. As well, Treasury smartly has been boosting longer-maturity issuance to lock in low interest rates, but this pumps more duration (i.e., interest rate risk) in the bond market. But this all is requiring higher yields for the auctions to comfortably clear the market.
Last Week’s Reports
Housing Starts, Existing Home Sales and Markit Services PMI were better than expected. Housing Permits and Markit Manufacturing PMI were about as expected. There was lots of Fed-speak but nothing earth-changing.
This Week
It will be a busy week for reports and Treasury auctions. Of interest, the median forecast for the advanced Q3 GDP growth rate (SAAR) is approximately +31% which, if correct, would about cover the minus 31.4% rate from Q2.
Monday: T-bills and New Home Sales
Tuesday: 2-year T-note, Durables, Consumer Confidence
Wednesday: 5-year T-note
Thursday: More T-bills and 7-year T-note, Adv. GDP for Q3, Jobless Claims
Friday: Personal Income and Consumption, Employment Cost Index, Chicago PMI, U-Michigan Sentiment Survey
October 19, 2020
Asset Bubbles
In a week that saw little movement in stocks and bonds a Financial Times article identifies central bank concern over increasingly risky investments due to global monetary policy that is keeping interest rates near zero. Neal Kashkari, the President of the Minneapolis Fed and a Treasury official during the financial crisis was quoted as saying: “I don’t know what the best policy decision is, but I do know we can’t keep doing what we have been doing. As soon as there is a risk that hits everyone flees and the Federal Reserve has to step in and bail out the market and that’s crazy.”
With the central bank seemingly committed to low interest rates through 2022 one concern is they may be forced to raise rates before scheduled if financial sector risks are not kept under control. A move like that would be counter to the bank’s preferred method of operation and could create increased volatility. This is all speculation but does highlight a bond market that offers negative real yields and stocks that are trading at very high multiples.
This WSJ chart shows stocks had started the week well only to be disappointed by no additional stimulus package and a national surge in virus cases that is resulting in increased lockdowns.
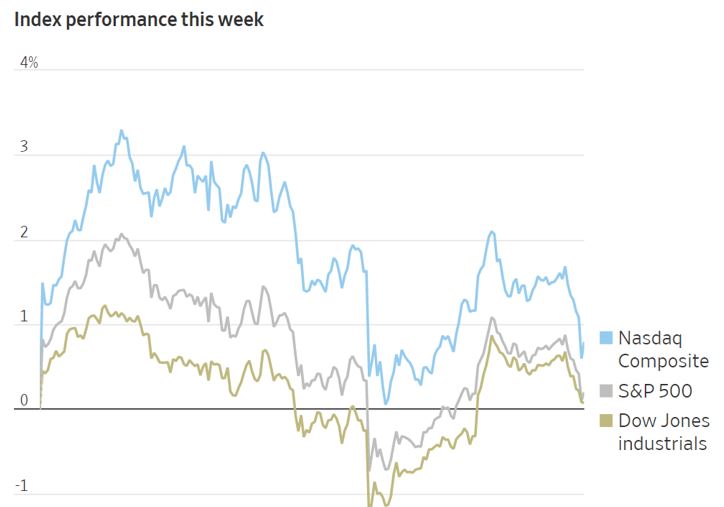
Benchmark Treasury rates marked time with the ten-year note closing at 0.75%, just about 2 bps lower than when the 504 program priced its October debentures. Markets are a bit on edge waiting for news on more stimulus and the election results.
Reports
- The budget gap tripled to a record $3.1 trillion in FY2020 as spending to combat the effects of the pandemic soared by 47%. As a share of economic output, the budget gap hit 16.1%, its highest percentage since 1945 when the country was funding its war effort
- CPI ex food & energy was as expected at +0.2% and +1.7% y/y
- PPI ex food & energy was as forecast at +0.4% and +1.2% y/y
- Retail Sales soared to +1.9% as consumers continue to spend; this is the fifth consecutive monthly increase
- Industrial Production declined 0.6% vs. its forecast of +0.6%
Brexit
This is a topic that has received little notice recently but after simmering for several months and approaching yet another deadline British Prime Minister Boris Johnson broke off trade talks with the European Union Friday, adopting a “fundamental change of approach” in which he commands the EU to respect Britain as an independent country. This puts ending the transition period on January 1 with a trade deal at risk and could result in excessive tariffs that would penalize British trade, in addition to the damage caused by the pandemic.
Stimulus Update
Democrats hold firm with a $2.2 trillion package and Speaker Pelosi has set a Tuesday deadline for agreement, President Trump endorses $2 trillion in aid while Senate Republicans prepare to vote on a scaled down package one-quarter that size. This $500 billion proposal sponsored by Senator McConnell focuses on aid to small businesses, school funding, and expanded liability protections for businesses affected by the coronavirus.
The Week Ahead
A light week for reports, a lot of Fed speak including Chairman Powell, and Treasury to sell $144 billion in Bills, Treasury Inflation Protected Securities, and bonds.
Monday – Treasury auctions $105 billion 13 and 26-week Bills; Jay Powell speaks
Wednesday – Treasury sells $22 billion 20-year Bonds
Thursday – Treasury sells $17 billion 5-year TIPS; and final Presidential debate
October 13, 2020
Continued Low Rates
Even with an increase in benchmark rates, interest rate swap spreads, and comparable product spreads in the Agency CMBS market the 504 program priced its October debenture sales essentially at its September levels, plus the 25-year rate tightened +9 bps to the 20-year issue, its tightest spread ever. As attractive as those rates are this chart shows the impact of the September expiration of P&I forgiveness under Section 1112 of the Cares Act as total volume declined to $130.5M, far below the previous 12-month average of $455MM and September’s record amount of $1.284B.
Investor demand for the product remains strong and with approved loan totals for FY2020 showing an 18% increase a return to increased sale size is expected.
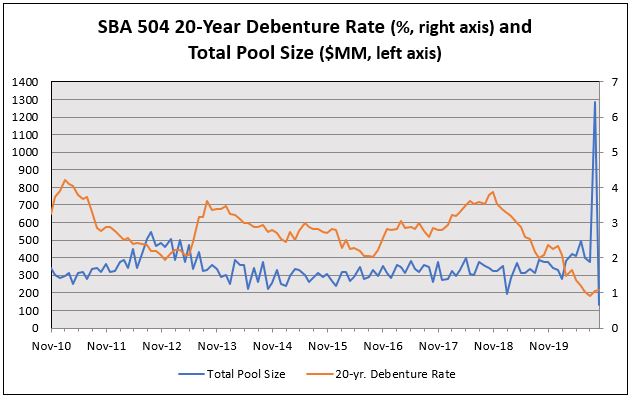
Blue Wave Election
This is the term that was applied to the backup in rates last week as the market set itself up to absorb the increased long-term Treasury supply that will be a constant as the increasing budget deficit needs to be funded. The phrase refers to the poll based likelihood of a Democratic sweep in November and that funding need will be enlarged by the prospects of the resumed stimulus talks after Republicans raised their threshold to $1.8 trillion. Taken together it is noted that the ten-year benchmark is trading at its highest rate (0.77%) since June 9 with the 2/10 curve steepening to +61.7 bps as increased supply in longer-term maturities seems to be weighing on the market.
Early in the week Chairman Powell spoke about the need to provide fiscal stimulus as quickly as possible to avoid bankruptcies and high unemployment, and the need to create jobs again was echoed by a WSJ survey of economists that showed 43% of respondents don’t see the labor market recovering until 2023. This chart shows how the recovery has slowed, with 11 million fewer workers employed as of September than in February, with 4 million of that total representing the hard hit leisure and hospitality sector.
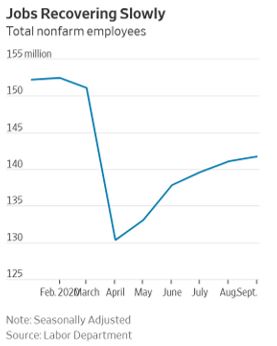
Reports
It was a light week for economic data, but equities had their best week in three months and analysts again pointed to poll results indicating more certainty about the election and reduced uncertainty that had existed about an undecided result. For the year, the DJIA is now in positive territory while the tech heavy NASDAQ market has gained 29.6%.
The Week Ahead
Another light week for reports, Treasury issues just Bills, plus Fed speak.
Tuesday – Treasury sells $105 billion 13 and 26-week Bills
Wednesday – CPI expected to be +0.2%
Thursday – PPI expected to be +0.2%
Friday – Industrial Production expected to be +0.5% and Retail Sales +0.7%
October 5, 2020
Uncertainty
Markets, like most of us, dislike that word yet as we advance towards a contentious presidential election we are faced with these realities:
- More than 40,000 coronavirus cases were reported for the third consecutive day on Friday and President Trump was one of them, putting in-person campaigning on hold and possibly participation in the next scheduled debate
- Additional members of his staff are also infected as are senior members of the Judiciary Committee that expects to hold hearings soon on the Supreme Court nominee
- House passage of a $2.2 trillion stimulus package will not be advanced in the Senate and stimulus negotiations remain stalled
- Tech shares slumped badly Friday after the President’s condition was announced, leading the major indices lower but with 1.5% gains for the week
- Surprisingly, US Treasuries did not rally on the disruptive news, something they generally due in such a situation
The benchmark ten-year Note remains in its recent vacuum and also weakened on Friday, ending the week just 1 bps lower than when the SBA 504 program priced its record breaking September sale.
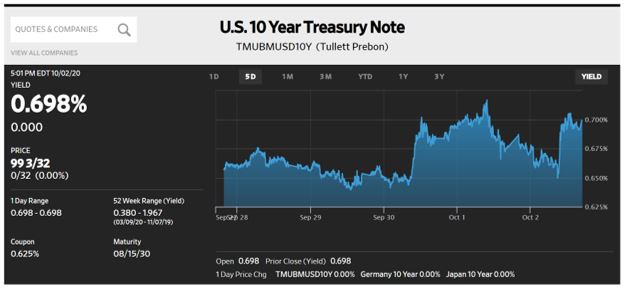
Reports
Adding to the uncertainty was Friday’s jobs report that came in below consensus at 661,000, the first time since April the gain was less than one million, but it did help reduce the unemployment rate to 7.9%. Job gains do support economic growth though at a slower pace than desired and this report does not account for layoffs recently announced by Disney, two major airlines and Allstate that will be a drag on the October report. Speaker Pelosi has encouraged the airlines to pause the announced layoffs and that is problematic without more aid.
This WSJ chart shows the sharply slower pace of job gains and though the 7.9% (U-3) rate for unemployment is an improvement, the broader measurement (U6) includes unemployed workers who have given up looking for work plus under employed parttime workers and that rate could be twice as high. This gap between the measurements has always existed but widens during any crisis and has been worsened by recent trends like trade globalization and reduced union membership.
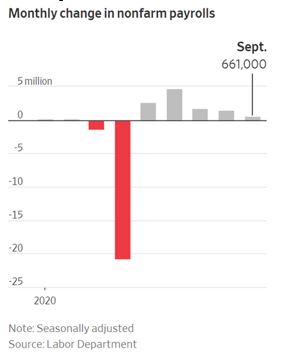
Personal Consumption Expenditures, the Fed’s preferred inflation gauge came in on target at +0.3% and its core reading y/y increased to +1.6% which was above consensus.
Personal Income fell 2.7% as increased federal aid has expired and consumption totals for the month were reduced.
On a positive note the Institute of Supply Management reported its purchasing managers survey increased to 55.4, its fourth consecutive increase. A reading above 50 indicates that activity is increasing yet Factory Orders were below consensus at +0.7%, down from +1% in July.
The Week Ahead
Fed speak, heavy Treasury issuance ($249 billion), SBA 504 debenture sale, and few reports.
Monday – Treasury sells $105 billion 13 and 26-week Bills
Tuesday – Treasury sells $34 billion 52-week Bills and $52 billion three-year Notes
Wednesday – Treasury sells $35 billion ten-year Notes; Minutes of the September 16 FOMC meeting are released
Thursday – Treasury sells $23 billion thirty-year Bonds and SBA prices its 20 and 25-year debentures for September
September 28, 2020
Static Rates and Weak Stocks
The rates market continues to mark time with the ten-year benchmark closing the week at 0.66% while the S&P 500 index declined for the fourth consecutive week as hopes for more fiscal stimulus continue to fade. Even Chairman Powell’s continued testimony identifying the lack of additional aid the central bank can provide and his repeated calls for fiscal support did little to inspire stocks with the tech heavy Nasdaq leading the selloff, down 2.3% on the week.
While demand for US Treasuries, high-grade Corporates and Agency CMBS securities remains strong the high yield (junk bond) sector saw its worst week since the beginning of the pandemic in March as $4.6 billion was withdrawn from funds in the week ended September 23. The selling has pushed the average yield for junk bonds higher by 50 bps to 5.83%.
Concern for the health of the economy, lack of fiscal stimulus, and fear of a contentious presidential election are cited as reasons for investors seeking to reduce risk in this sector and also can be applied to stocks.
Fed’s Target is 2% Inflation
In its recent release the FOMC conceded that we are years away from its PCE indicator of inflation being at its 2% target but a WSJ article displaying this chart indicates inflation exceeds that level for everyday items that consumers are buying during this crisis.
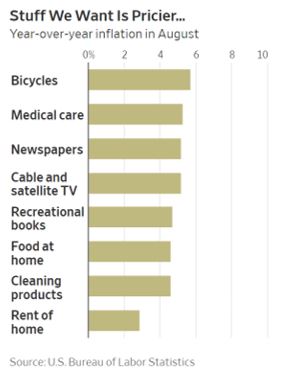
Where the cost of goods is declining, and holding back the overall rate, is for items most affected by social distancing and working from home – airline fares -22%, men’s suits and women’s dresses -17%, and hotel rates -12%. Thanks to federal stimulus and generous unemployment pay household incomes have actually risen during this recession, an unusual occurrence as the stimulus measures supported demand which can wane without more stimulus or an independent recovery. Should job losses and corporate cutbacks increase any inflationary pressure that is building will quickly become a deflationary drag and that simply identifies how difficult a task the Fed faces and explains why Chairman Powell is so vocal about the need for fiscal stimulus.
Necessity and Opportunity
Hundreds of thousands of small businesses have closed during the pandemic yet applications for employer identification numbers are rising at the fastest rate since 2007. Excluding the group that might include laid off workers starting a business in the gig economy, applications for business owners who tend to employ other workers reached 1.1 million through mid-September, a 12% increase over the same period last year. The total number of applications is 3.2 million vs. the year ago amount of 2.7 million. This increase is taking place even as many small businesses are earning less than before the pandemic but reflects adaptation to market conditions for many people who have not been rehired.
Reports
The only report of note last week was Durable Goods, a fourth consecutive increase of 0.4% that was below consensus but with an upward revision of 0.5% for July.
The Week Ahead
A light week for Treasury supply, 2Q2020 GDP revision, Fed speak, the Fed’s preferred inflation gauge, and Non-Farm Payroll.
Monday – Treasury sells $105 billion 13 and 26-week Bills
Wednesday – Third revision of 2Q2020 GDP expected to be -32%; layoffs for tens of thousands of airline workers expected to begin as time limit for federal loans is reached
Thursday – Personal Consumption Expenditures and Personal Income; July numbers were +0.4% for PI and +0.3% for PCE
Friday – August NFP report was +1.4 million with Unemployment at 8.4%, and Factory Orders were +6.4% in July, their third consecutive gain
September 21, 2020
Doubly Disappointed
Not only have markets been left waiting for additional fiscal stimulus but Wednesday’s FOMC announcement did not include any plans for the Fed to promise more specific monetary actions as Chairman Powell demurred on additional plans. In its announcement the Committee stated it expects rates to stay low for several years with all 17 members who participated expecting rates to stay at zero through next year and 13 of them expecting them to stay there into 2023. Those are strong words but lacking in any additional action from the bank. Its dual mandate remains – maximum sustainable job levels with inflation modestly overshooting 2%, a level we have not seen in years and which the Committee does not project until 2023.
One Fed official who is more optimistic on growth and inflation is FRB St. Louis President James Bullard who believes 3Q growth can jump to 30% from the depths of 2Q levels with unemployment declining by year-end to 6.5% from 8.4% today. Without citing anything specific this non-voting member of the Committee also expects inflation to pick up very soon.
Market Reaction
Muted is one word that is appropriate:
- The ten-year benchmark rose 3 bps on the week to close at 0.70%, almost unchanged from when the 504 debentures were priced on September 10
- Stocks closed the week lower after being up going into Wednesday’s FOMC announcement, but they too were disappointed the Fed offered nothing more specific. The S&P 500 index is now down 5.6% over the last three weeks while the NASDAQ has declined 7.7% over that period. Low interest rate policies of central banks have spurred demand for risk assets and what is coming clearer is the realization that the more the Fed drives real yields down and valuations in risk assets up, the more they will need to buy to keep them there.
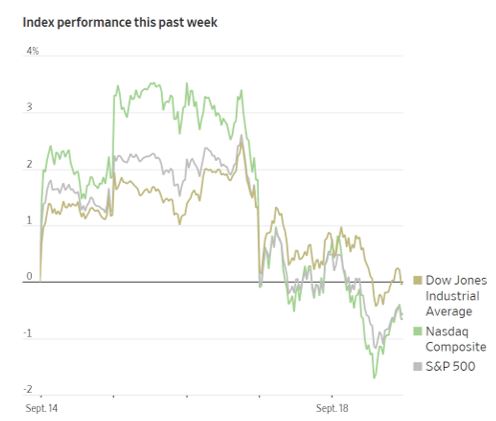
The tech sector that led this year’s outsized gains has been the recent drag on the markets, but one IPO last week captured investor’s attention. Snowflake Inc’s shares skyrocketed Wednesday giving the tech IPO a market value of $70.4 billion, more than five times greater than its $12.4 billion valuation in a private offering earlier this year. Priced at $120 per share it soared as high as $317 before settling down to close the week at $240. Like many tech startups Snowflake is not yet profitable but with Berkshire Hathaway an early investor the company had immediate credibility.
Economic Reports
It was a light week for reports, and both came in below consensus. Industrial Production was +0.4% but with an upward revision to July, while Retail Sales was +0.6% with July revised down by 0.3%, perhaps showing fatigue for consumer spending.
The Week Ahead
Treasury calendar is Bills and intermediate term Notes, Fed speak resumes including Chairman Powell appearing before Congress for three days regarding the Cares Act, some housing data, and Durable Goods.
Monday – Treasury auctions $105 billion 13 and 26 week Bills
Tuesday – Treasury sells $52 billion two-year Notes
Wednesday – Treasury sells $22 billion 2-year FRN’s and $53 billion five-year Notes
Thursday – Treasury sells $50 billion seven-year Notes
Friday – Advanced Durable Goods orders forecast as +1.8% after July’s increase of 11.4%
September 14, 2020
Record Size
Helped by the Covid-19 deferment offered by SBA and Section 1112 of the Cares Act this Wednesday the SBA 504 program will settle the largest sale in its 34-year history - $1,284,274,000 debentures, more than double the previous record set in August 2012 when Debt Refinance was first introduced. The significance of its size can be seen in how the left axis of this chart needed to be increased to reflect the monthly sale volume. An indication of how the 504 program has grown is it took 5-years, until October 1991 for it to fund more loans than it is about to do this month.
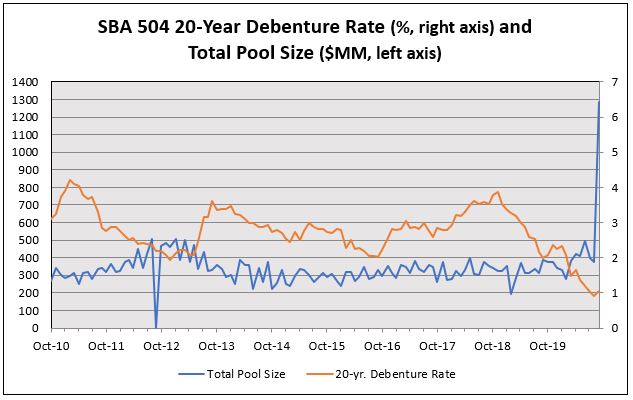
Record Pricing Spread
Once again confirming the advantage of a 25-year option for small business borrowers 2020-25I at $900,950,000 was almost $1 billion in size itself and was priced at its tightest ever spread to Treasuries, +43.7 bps. All three classes were over-subscribed, allowing 2020-20I to be priced at a tighter spread than comparable product, the market’s benchmark Freddie K-2. Steve Van Order reports that 25-I saw increased demand from buyers utilizing the Term Asset-backed Securities Loan Facility (TALF) whereby the Federal Reserve Bank issues loans to banks using asset-backed securities (like DCPC’s) as collateral.
As important as the volume and the near record debenture rates are, the low ongoing Effective Rates for small business borrowers remain impressive.
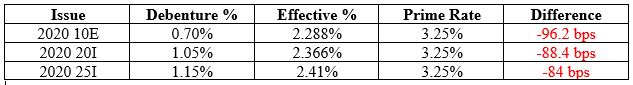
This figure will decrease somewhat once BNY Mellon reports prepayment activity on October 1st but once the September debentures close on Wednesday the Outstanding Principal Balance for the 504 program will be $28,016,029,519, surpassing the previous high of $27,403,796,197 set in October 2014. The expected October 1 decrease of approximately $141 million should be offset with the October debenture sale, returning OPB above $28 billion.
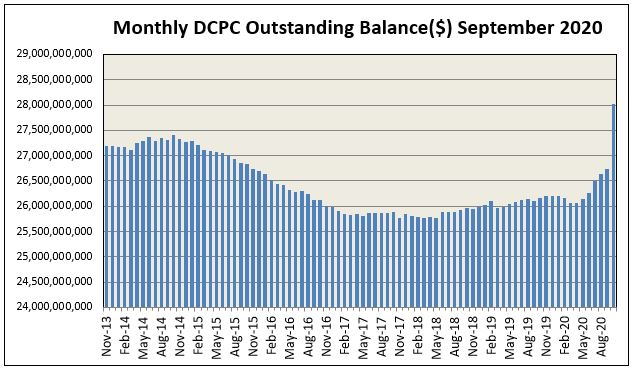
Markets
Treasuries saw a slight uptick in rates midweek as the market digested Treasury’s long dated debt and a heavy Agency CMBS supply but closed out the week in better fashion as investors were reminded that stocks go down, too. After seeing some tech stocks triple in value this year (Tesla), the tech sector led again, but on the downside with NASDAQ declining 10% from its all-time high of the previous week and 4% last week alone. Pessimism about further federal stimulus was confirmed Thursday when Democrats voted to block passage of legislation advanced by Senate Republicans. It is generally agreed such a measure is needed to support a sustained recovery though any help seems unlikely ahead of November.
After a hiatus due to the pandemic Brexit is back in the news as Prime Minister Johnson advanced a modification of a previous agreement regarding Northern Ireland’s border, a key component of previous negotiations. This uncertainty immediately resulted in sterling weakening against both the $US and the Euro.
Both inflation reports came in above consensus with core PPI at +0.4%, +0.6% y/y and PPI also at +0.4% and 1.7% y/y.
The Week Ahead
The FOMC meeting is not expected to vary much from previous statements, perhaps offering some clarity on their 2% average for inflation, Treasury calendar is just Bills and a 20-year sale, and economic reports are light.
Monday – Treasury sells $105 billion 13 and 26-week Bills
Tuesday – FOMC meeting begins, and Treasury auctions $22 billion 20-year Bonds; Industrial Production forecast as +1%
Wednesday – FOMC announcement and Chairman’s press conference; Retail Sales forecast at 1%
September 8, 2020
Take the Stairs Up, and the Elevator Down
That market axiom certainly pertained to last Thursday’s performance for equities as the NASDAQ, which outperformed all other indices ytd, also led the way sharply down, ending the week with a loss of 3.3% after declining as much as 6% at one-point Thursday.
This WSJ chart shows the market’s mid-week reversal and blame for the selloff has been attributed to a Japanese conglomerate, Softbank, that has been investing heavily in outright purchases of tech sector stocks like Tesla, Apple, Alphabet, and Google as well as call options on the same. This combination of trades, representing billions of dollars had resulted in outsized trading volume and gains for many of those stocks and has left the market in a vulnerable position. That vulnerability includes Softbank itself as its shares lost 7.2% ($8.9 billion) on Monday in Asia trading after publication of a Sunday Financial Times article identifying the activity “helped crystallize the perception the bank’s behavior increasingly resembled that of a hedge fund.”
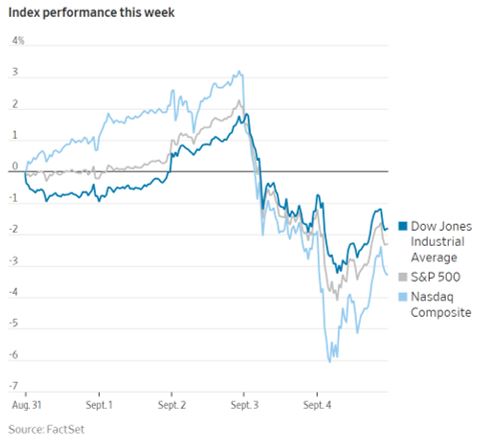
Other Markets
Another axiom calls for Treasuries to rally when stocks weaken but that did not hold true as the benchmark ten-year Note reversed course and closed the week unchanged at 0.72%, 10 bps higher than when stocks began to sell off and 21 bps above where the SBA 504 program priced its August debentures.
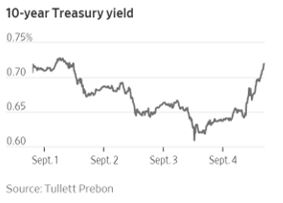
Part of that move might be explained by a heavy Treasury calendar this week, similar to sales in early August when longer-term maturities were increased in size. Additionally, the Agency CMBS market, where the SBA 504 program’s DCPC’s are traded, will see increased issuance, especially from Freddie Mac. Benefiting to this sector is strong investor demand that has resulted in improved pricing spreads especially with a backup in benchmark rates. Of particular interest will be this month’s 504 debenture sales as the three maturities will represent the final month of loans benefitting from P&I forgiveness under Section 1112 of the Cares Act.
Updates
Friday’s jobs report came in as expected at 1.4 million with the Unemployment rate declining to 8.4%. As positive as that is 11.5 million jobs are still lost from the initial shutdown in February through April. Market reaction was muted somewhat by 238,000 of those jobs being temporary government hires for the census.
In a Friday interview with NPR radio Chairman Jay Powell agreed the report was very good while stating that more government spending was needed along with low interest rates for years to come.
Roland Cook – The Loss of a Master
Barbara Vohryzek had a special bond with someone that dates back as long as she was involved with the 504 program and posted me Saturday that he had died. Roland Cook is that person, a name that many people currently involved with the SBA 504 program might not be familiar with, but in addition to being an architect for the program back in 1986 he was also a mentor to me when I was trading the product at Merrill Lynch and would occasionally forget which week of the month the sale was scheduled. Roland also served as a resource to Steve Van Order during his first tenure with the program and we both maintained a relationship and visits with him.
Prior to becoming the first Fiscal Agent for the 504 program Roland had a distinguished career at the Treasury and then Fannie Mae. His expertise in government bonds and mortgage-backed passthrough securities (then considered still a bit exotic) uniquely prepared him to design the securitization process for the 504 program. That process has stood the test of time, especially through crisis after crisis since 1986.
In 1983 while at Fannie Mae, Roland interviewed a quite young Steve-VO for an entry-level position. On his sparse resume Steve indicated he played the electric bass. An avid fisherman with a sharp sense of humor, Roland flustered Steve by asking him “Just what is an electric bass?” “Bass” of course was pronounced like the fish. Steve still remembers the little smile on Roland’s face as he asked the question. Much sputtering ensued. Somehow, Steve got the job and proceeded to learn a lot from Roland about how to study bonds and how to conduct oneself in the market.
Roland brought to market the program’s first and smallest issue of $7,087,000 in November 1986 and passed away as the program is about to launch its largest sale ever of nearly $1.3 billion. He was principled, intelligent, and always a presence – he will be missed.
Visiting With the 504 Patrone – Steve Van Order and Frank Keane with Roland Cook

The Week Ahead
No Fed speak during the blackout period ahead of the 9/15-16 FOMC meeting, heavy Treasury and ACMBS issuance, the September sale for the 504 program, and some more inflation reports.
Tuesday – Treasury to sell $139 billion in 13, 26 and 52 week Bills and $30 billion three-year Notes
Wednesday – Treasury to sell $35 billion ten-year Notes
Thursday – SBA 504 program prices its 10, 20 & 25-year September debentures; Treasury to sell $23 billion thirty-year Bonds; PPI expected to +0.2%
Friday – CPI expected to be +0.3%
August 31, 2020
Low Rates Forever
That was the overstated WSJ headline interpreting Fed Chairman Powell’s Thursday speech redefining Fed policy concerning inflation. The FOMC mission is twofold – support maximum employment and stable prices for the goods purchased by consumers. This long awaited policy statement is thought to postpone a tighter monetary policy as unemployment declines while keeping rates low in hopes of promoting inflation. The Committee’s stated goal has long been 2% inflation which has been elusive, now they will pursue an “average” of 2% over a yet to be stated period of time.
Market reaction was as expected:
- $US slid further as long-term Treasury rates rose, declining 0.8% on Friday alone and is now -4.1% ytd
- Longer-term UST rates rose, steepening the 2/10 Treasury curve 11 bps w/w because leaving interest rates lower for longer will eventually increase the potential for inflation, something bond holders do not like as it devalues their fixed-rate investment. Short-term rates are anchored with the current dovish monetary policy and were unchanged on the week.
- Stocks continue their euphoria with the three major indices up about 3% on the week buoyed by anticipation of a looser monetary policy with expectations of investors continuing to seek riskier assets.
This Financial Times chart shows the increased expectations for inflation going forward and affirms the more cautious demand for longer term debt. That is not to say that long term rates can’t decline while the Fed holds policy firm, it simply identifies investor caution when you combine Fed policy, an increasing budget deficit that will require more debt issuance, and Treasury’s recent shift to increase the auction size of its longer term maturities. With inflation benign and rates low the breakeven rate, an important measure of market expectations over the next decade has reached 1.78% and could increase further should an economic rebound prove to be robust.
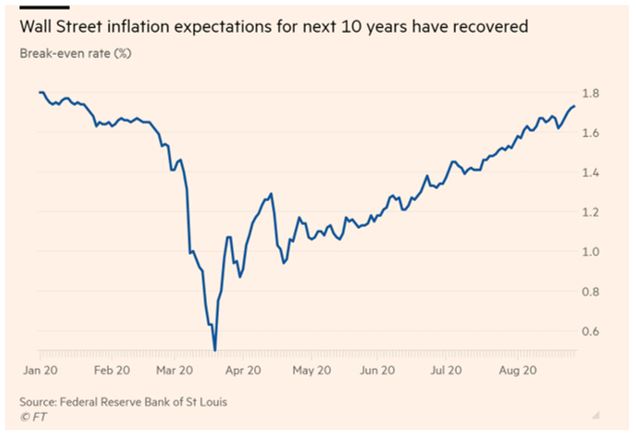
Some Recovery
This WSJ chart shows how the benchmark ten-year Note improved in price on Friday after a sharp rise in yield after Thursday’s speech. At 0.72% it is 21 bps higher than when the SBA 504 program priced its August debentures but 120 bps lower than where it ended last year.
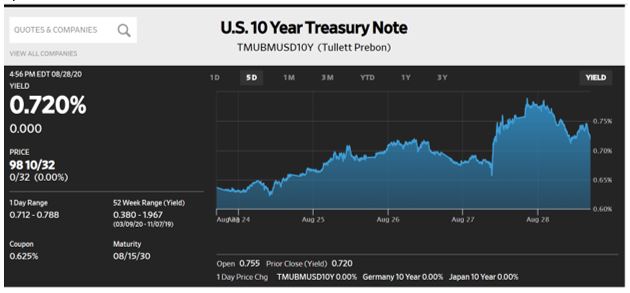
Economic Reports
Personal Income came in above consensus at +0.4%, and Personal Consumption Expenditures were unchanged at +0.3%. Y/Y they remain unchanged at +1.3%.
Second revision for 2Q20 GDP was basically unchanged at -31.7% while Durable Goods was much stronger than forecast at +11.2%.
New Home Sales continued to show strength in the housing sector with a gain 901,000 as 30-year mortgage rates now average 2.93%.
As markets await additional stimulus from Congress, Fannie Mae and Freddie Mac extended single family foreclosure and eviction relief to the end of the year while allowing their loan servicers to provide up to 12-months forbearance and to waive assessments of penalties and late fees for homeowners affected by Covid-19.
The Week Ahead
Fed speak, a light Treasury calendar and the jobs report for August
Monday – Treasury sells $105 billion 13 and 26-week Bills
Tuesday – ISM Manufacturing
Wednesday – Factory Orders
Friday – Non-Farm Payroll
August 24, 2020
Mixed Recovery
That was the headline for a WSJ story reflecting different levels of activity across the manufacturing and service sectors of global economies. The UK and US activity continued to improve in July even with increased virus reports, while the Eurozone declined, and Japan was static.
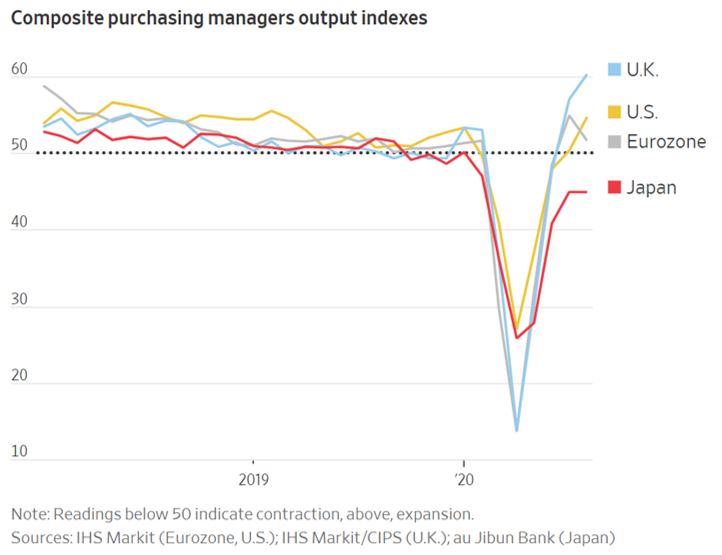
This data from IHS Markit shows the US economy at an 18-month high of 54.7 with large increases in both categories. A reading above 50 is a sign of expansion while a reading below that is a sign of contraction and while the pandemic makes it more difficult than usual to affirm a long-term trend from a monthly report this is a positive sign. With an annualized decline in GDP of 32.9% in the second quarter the economy does have a lot of ground to cover and certainly would benefit from more federal stimulus.
Adding more optimism and benefitting from historically low mortgage rates, Existing Home Sales surged 24.7% in July to a seasonally adjusted annual rate of 5.86 million homes, the strongest monthly gain ever recorded, going back to 1968. The strong demand and short supply pushed the median price of home sales higher by 8.5% to $304,100, a record high nominally and adjusted for inflation, according to the National Association of Realtors.
Market Response
Clearly, both stocks and bonds like low interest rate policies and federal stimulus. Stocks ranged from a flat performance by the DJIA to a 2.7% NASDAQ gain with the S&P 500 showing a slight gain of about 0.7% but registering a record high and ending with its fourth consecutive weekly gain. Much of this strength is attributed to the unattractiveness of yields in fixed income with the real yield on ten year Treasuries at -0.99%.
The Treasury market showed improvement as a lighter funding calendar eased pressure on rates with the ten-year benchmark improving 6 bps to a level that is still 13 bps higher than when the SBA 504 program priced its August debentures.
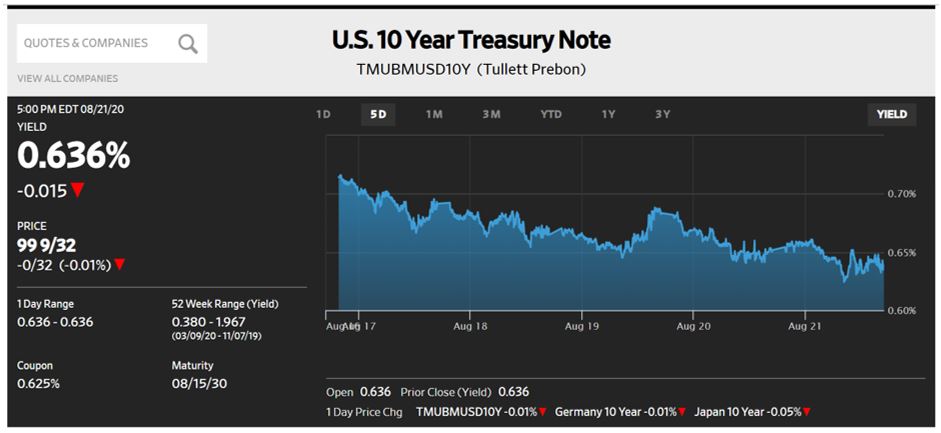
Other developments included the release of the minutes from the July 29 FOMC meeting that identified a need for continued stimulus and identified the bank is closer to an agreement reviewing changes to the its policy framework but was light on details. It does plan to continue buying up to $120 billion Treasuries and mortgage backed securities each month.
Stimulus
The House of Representatives reconvened Saturday in a session specifically called to fund the US Postal Service so that it is more able to support the vote by mail initiative favored by Democrats. Such laser focused stimulus would do little for the economy and is unlikely to advance through the Senate. The Senate plans to announce its stimulus proposal later this week and on Sunday President Trump announced FDA is fast tracking the use of plasma from recovered victims to be used in treating Covid-19 patients and that has helped stock futures rise again in pre-market trading.
The Week Ahead
Fed speak including Chairman Powell on Thursday, more housing data, 2Q2020 GDP revision, the Fed’s preferred inflation gauge Friday, while Treasury has a more robust funding calendar.
Monday – Treasury auctions $105 billion 13 and 26-week Bills
Tuesday – Treasury sells $50 billion 2-year Notes, Consumer Confidence Index
Wednesday – Treasury sells $22 billion 2-year Floating Rate Notes and $51 billion 5-year Notes; Durable Goods expected to show continued gains at +4%
Thursday – Treasury sells $47 billion 7-year Notes; Cut-Off date for September SBA 504 debenture applications; Chairman Powell speech; second revision for 2Q2020 GDP expected to remain -32.9%
Friday – Personal Income & Outlays with Personal Income expected to recover to just -0.2% from -1.1% in June, while core Personal Consumption Expenditures forecast at 0.5% and 1.3% y/y
August 17, 2020
No Deal
With most everyone in agreement that additional stimulus is needed to support individuals out of work and small businesses, Congress opted to begin its summer vacation without the compromise that had been hoped for. Being at least $1 trillion apart in their respective proposals this puts off any initiative until after Labor Day, meaning relief is not to be expected this month.
Deadlines have been a common concern and they now have been reached:
- The $600 weekly unemployment supplement ended two-weeks ago, severely reducing benefits
- Forbearance of rent and mortgage payments has been modified and even if extended they are bills that will come due for renters and homeowners
- Section 1112 of the Cares Act’s forgiveness of principal and interest payments for small business borrowers in the SBA 504 program is scheduled to end with the August 27 Cut-Off date for the September debenture sales
Additionally, working parents face the need for tutors and/or child care help as schools are scheduled to reopen online in most states. Single parents in particular have fewer options and these conflicts affect the overall economy as they mean there is less money to spend, invest and save. Fed officials, like Boston Fed President Eric Rosengren, have stated the economic rebound will continue to suffer and the unemployment rate of 10.2% will be slow to decline, confirming that more stimulus is needed.
A Rate Rise
In a week that saw Treasury increase the size of its longer-term maturities the ten-year benchmark rose 14 bps putting it 20 bps above its level when the 504 program priced its August debentures eleven days ago. Because of ongoing global demand for this safe-haven asset it is not expected to rise significantly but should remain within its recent range. Last week’s commentary cited the strength of another safe-haven asset, gold, and that too sold off last week, down 4%.
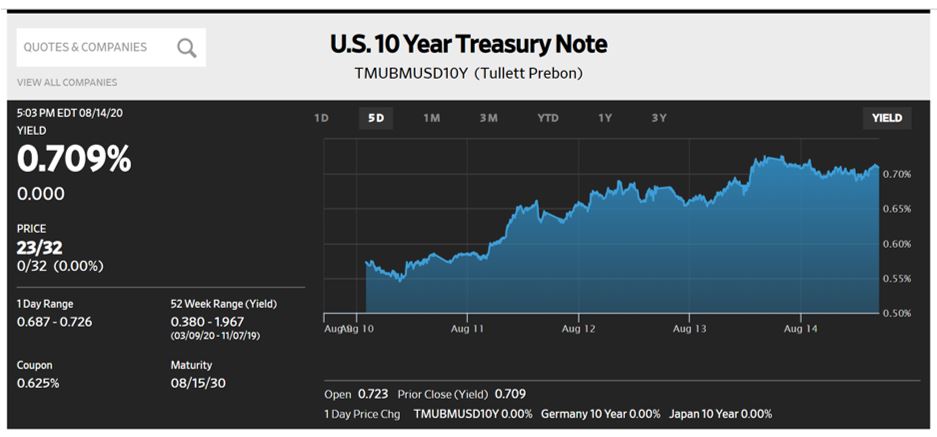
The stock market rally from its March nadir seems stalled as it too is dependent on increased government stimulus that is not forthcoming.
Economic Reports
Blame, or credit could be given to Wednesday’s strong CPI report of +0.6% (double consensus) for influencing the weakness in Treasuries but a Financial Times article points out the economy is too weak for inflation to return. Recent shocks to the supply chain may have resulted in some price increases but it is increased wages that must also rise to increase inflation and with high unemployment and elevated jobless claims the labor force is not being pinched. The article does point out huge debt burdens like economies are now assuming do carry inflation risks, but it is deflation that is of concern now. Central banks monitor inflation risk and if unimpeded by political forces can be expected to tighten policy if necessary.
Other reports also showed positive numbers, as forecast:
- PPI was +0.3%
- Retail Sales was +1.2%, down from June’s 8.2% bounce
- Industrial Production came in +3% and June was revised up to +5.7%
The Week Ahead
Light on economic reports and Fed speak; Treasury issues some off-cycle long maturities.
Monday – Treasury sells $105 billion 13 and 26-week Bills
Wednesday – Treasury auctions $25 billion 20-year Bonds; Minutes of the July 29 FOMC meeting are released
Thursday – Treasury auctions $7 billion 30-year TIPS (Treasury Inflation Protected Securities), currently yielding -0.26%
August 10, 2020
Record Low Rates – Again
At 2.21% and 2.27% the ongoing Effective Rates for small business borrowers are lower than the APR for residential home buyers and substantially lower than the Prime Rate. On Thursday, the SBA 504 program priced its 20 and 25-year debentures at record low nominal rates of 0.90% and 1.01%, just as Steve Van Order alluded to in last week’s commentary. The debenture rates not only tracked the benchmark Treasury rate lower but have also tightened their pricing spreads vs. Interest Rate Swaps as investor demand for the product remains robust.
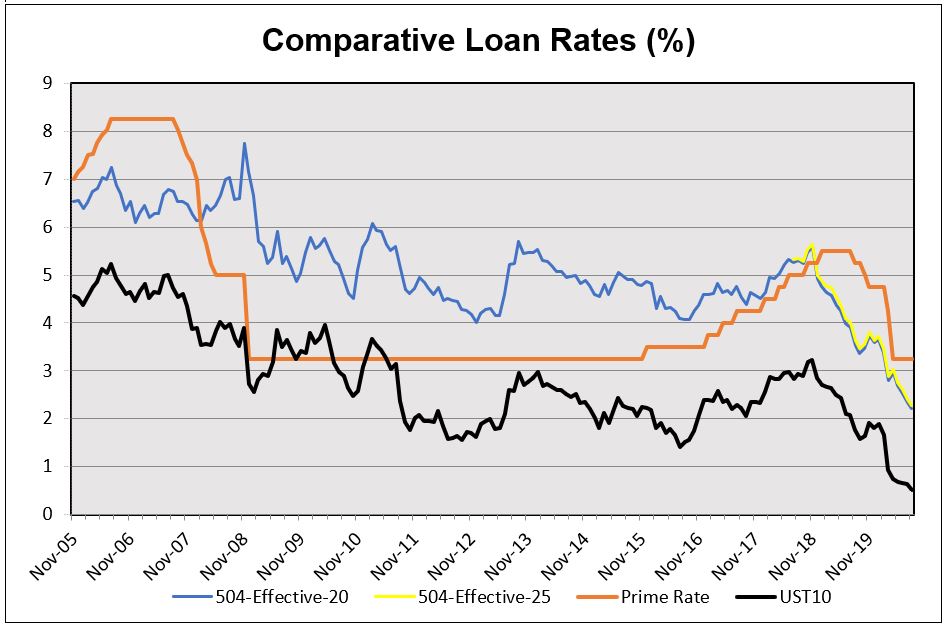
An indication of that demand can be seen here with the y/y improvement in Effective Rates vs. the benchmark ten-year Note.
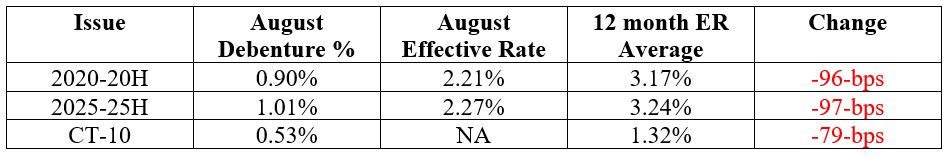
In keeping with global trade tensions and Fed comments about higher rates not being anticipated until the end of 2021 the market is resigned to these low rates. Increased Treasury funding to address the current deficit were addressed as Treasury announced it would increase the sizes of their intermediate and long-term maturities by $132 billion this quarter, shifting away from the short-term maturities to access the historically low rates in the back end of the curve. With an additional stimulus package expected eventually it would not surprise for the Fed to increase their purchases of Treasury debt that have decreased recently. At the height of the pandemic Fed purchases averaged $78 billion daily and have dropped to as little as $80 billion monthly as the markets have settled down.
With Congress unable to strike an agreement the President on Saturday issued executive orders to partially restore the supplemental $600 unemployment benefit and defer the Social Security tax for the final three months of the year. Additional measures like cutting interest rates on student loans and forbearance on rents and mortgage payments are also included, but like the payroll tax those payments are not forgiven just deferred. The constitutionality of these measures is certain to be challenged and it is hoped that will lead to an actual bill, but, for now, the group most likely to benefit is lawyers.
A Good Week for Stocks
Even though their performance after a better than expected jobs report on Friday was muted, all three major indices gained at least 2.5% for the week with the DJIA outperforming the others at +3.8%. Increased Presidential criticism of select Chinese companies, in addition to a requirement for listed Chinese companies to conform to domestic accounting standards by 2022 added to existing trade tensions that paused the up trade on Friday.
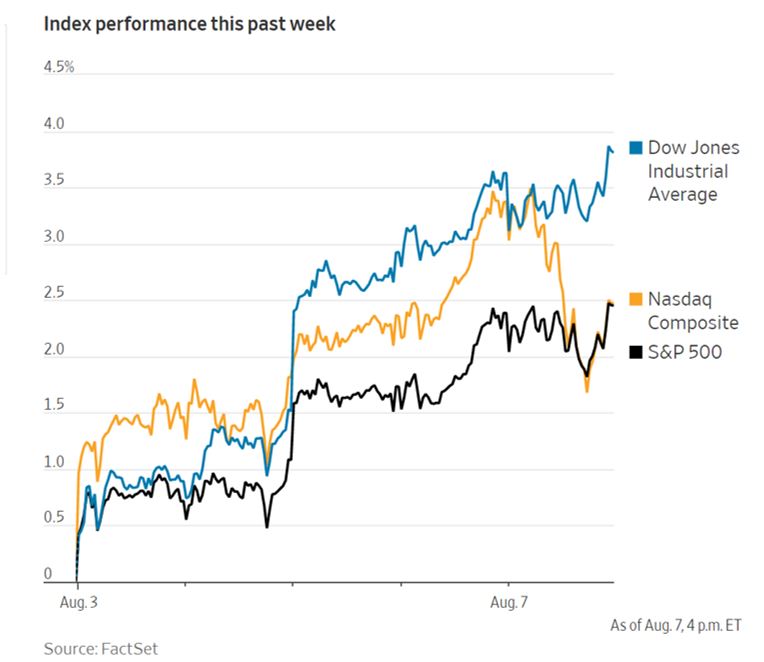
The jobs report did surprise with 1,763 million added in July as the Unemployment rate declined to 10.2%. The bulk of the gains were in hospitality and retail services as expected, but the economy still employs 13 million fewer workers than in February when the unemployment rate was at a 50-year low of 3.5%.
And for Gold
This alternative safe-haven investment continues to find buyers, closing the week at $2,046 an ounce, up 36% ytd and a partial cause is attributed to one buyer taking physical delivery of the metal. An exchange traded fund managed by State Street (GLD) now holds 1,258 tons of gold in HSBC’s London vaults, a value of $80 billion. Most other funds that trade this commodity do so with commodity futures, so this trading strategy is actually creating some scarcity.
The Week Ahead
Treasury begins its increased issuance in Notes and Bonds, plus $139 billion 13, 26, and 52-week Bills; Fed speak continues and several economic reports.
Monday – 13 and 26-week Bill auctions totaling $105 billion
Tuesday – Treasury auctions $34 billion 52-week Bills and $48 billion 3-year Notes; PPI forecast as +0.3%
Wednesday – CPI expected to be +0.3%; Treasury sells $38 billion 10-yar Notes; SBA 504 debentures fund
Thursday – Jobless claims; Treasury sells $26 billion 30-year Bonds
August 3, 2020
Last week, benchmark Treasury yields continued a gentle decline that had been in place for all of July. Supporting lower interest rates was economic data suggesting that the US economic recovery is slowing in the face of the one of the worst COVID-19 experiences in the world. Some higher frequency data showed a decline in the recovery in figures such as job postings, the number of small businesses open, and time spent outside the home. The truncated baseball season barely got started before problems with infections came up. The sports that are choosing to operate in a bubble environment such as the NBA, WNBA and NHL probably have a better chance of completing their shortened seasons. But despite the litany of bad news, it wasn't all bad news, as there were more reports of success on multiple fronts in COVID-19 vaccine testing.
The attention-grabbing headlines in economic news were the approximately 10% declines q/q in Q2 US and German GDP. Not helping matters was floundering by political leadership in coming together on a new economic relief package as emergency support in unemployment compensation expired. The US’s continued stumble though the pandemic era was reflected in the largest monthly decline in the dollar since 2010.
In this environment the Fed chose to extend the expiration date for its seven emergency facilities from the end of September to the end of the year. This means that an important facility supporting SBA 504 debenture pools, the Term Asset-backed Lending Facility (TALF) will be open longer than expected. The Fed also made clear that the balance of economic risks was even a little more to the downside. While the Fed made no change in policy interest rates or direct asset purchase plans, in September the central bank may offer “forward guidance” to further cement expectations that policy interest rates will remain near zero for a long time. In fact, the market already prices in the expectation of a near 0% policy rate into 2023.
Setting Up for the August Debenture Sale. Let's take a look at where interest rates are as we get ready to announce the August SBA 504 debenture sale. We can see in the chart below the trading range activity in the 10-year Treasury yield since the beginning of February. Following the data, we can see that in March, at the peak of the market turmoil, the 10-year note made an intraday low of 0.4%. There was then a sharp bounce up in yield on the announcement of Fed support facilities as the stock market started to rally back. Since late March, the effective trading range on the 10-year note interest yield had been tight, with most of trading taking place roughly between 0.6% and 0.7%. As we moved through July, there was a gentle downtrend of some persistence that eventually took out the lower yields with the 10-year yield last Friday at 0.54%. That compared to 0.64% on July 9, at the pricing of the last debentures.
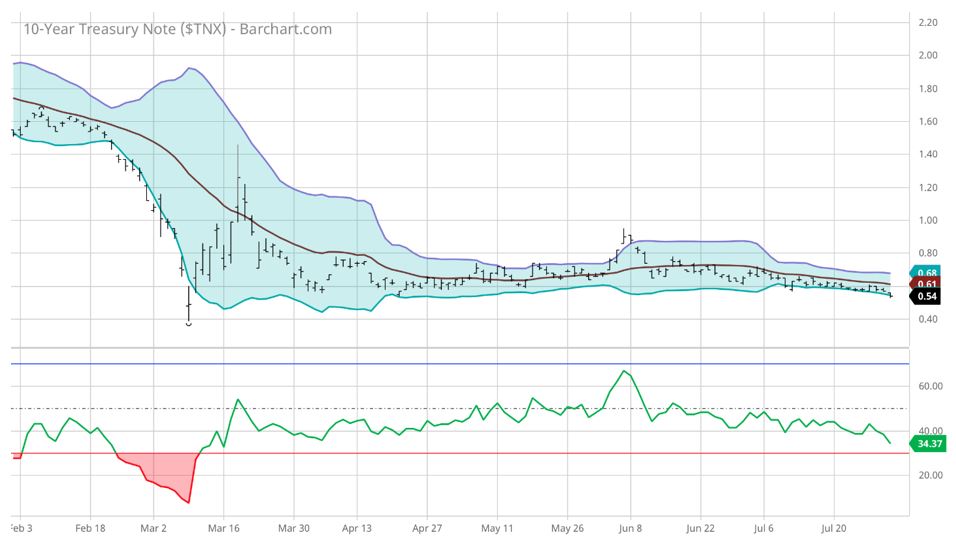
We can also see in the chart that the bottom of the volatility band has been under some pressure with the market wanting to move lower in yield. The July gentle momentum lower in yield received support from the various developments that we recapped above. Below the yield chart, we see a momentum indicator known as the relative strength index (RSI). This indicator suggests that the market has gotten overextended in the direction of lower yield. So we have a situation where the market persistently traded lower in yield, is overextended, and so could be due for a correction. But taking out the bottom end of the trading range suggests the possibility, depending on developments in the news and economic data, of yet lower yields.
So, the T-note yield, that primary determinant of the 504 debenture interest rate is quite friendly at the moment. Another primary determinant is the interest rate swap spread which is also friendly, in the neighborhood of zero basis points over Treasury. The last determinant of 504 debenture rate is the 504 spread over the interest rate swap rate and that also is friendly. Over the last few months, that spread has contracted notably. The 25-year spread was 95 bps in April and 54 bps in July. That July spread was the tightest since inception in July 2018.
Why has the 504 spread to swap contracted so much? The deal sizes have not been especially large yet there has been exceptional demand with the usual buyer base actively engaged and now joined by investors in the Fed TALF program. This combination of modest supply and very strong demand has resulted in some of the largest demand to supply coverage ratios in history and has really driven in the spread to swap in the last few months. We believe most of that spread movement is behind us but we expect the spread to remain at a relatively tight level.
In summary, as we look ahead this week to setting the debenture rates on Thursday, barring a burst of volatility in the market, there's a decent possibility for a sub-1% twenty-year debenture rate and the 25-year debenture rate just north of 1%. We offer these projections with a needed grain of salt.
The Week Ahead
Monday – Purchasing Managers and ISM indices.
Tuesday – SBA announces approximately $375MM in 20- and 25-year debentures.
Wednesday – ADP employment report and ISM services indices.
Thursday – Jobless claims. SBA prices debentures.
Friday – July Employment Situation release.
July 27, 2020
Continuing Trend
In a week where tension between the two largest global economies increased, equities snapped their three-week win streak and safe-haven Treasuries pursued their relentless trend lower as the ten-year benchmark ended the week at 0.59%, 5 bps lower than when the 504 program priced its July debentures 18 days ago.
This WSJ chart shows its YTD movement with the Note revisiting territory it previously touched in March after the 150 bps rate cuts by the Fed.
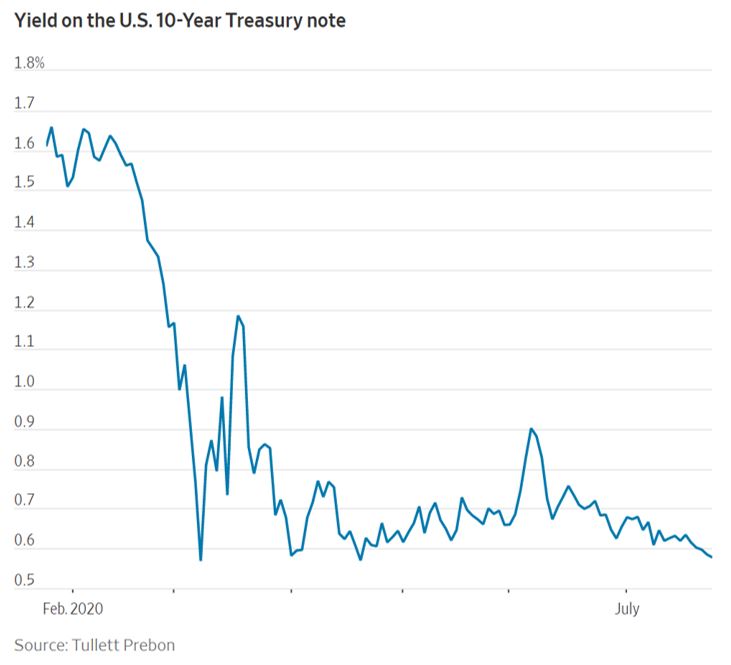
Increased jobless claims of 1.42 million helped support this move but it is questioned how much lower rates can go in an environment of record Treasury issuance to fund a deficit partially offset by increased Fed purchases of debt. As mentioned last week, TIPS (Treasury Inflation Protected Securities) are outperforming nominal yields as Treasury sold $14 billion ten-year TIPS last week at -0.93%, the lowest yield ever in an auction as investors increase their inflation expectations.
Conflicts
In a week that continued to focus on increased cases of Covid-19 some emphasis shifted on Wednesday when the US ordered the closing of China’s Houston consulate, resulting in China reciprocating by closing the US consulate in Chengdu. Markets reacted as expected with Treasuries improving and equities giving up their early in the week gains to decline over the last two trading days. A second incident occurred later in the week when a Chinese official was detained for having lied on her visa application when entering the country.
Another conflict took place in Congress as the Senate was unable to agree on its proposed $1 trillion stimulus package after the House had approved its $2 trillion version. Extension of the soon to expire (July 31) $600 supplement to unemployment insurance is being debated and added to the expiration of forbearance for rent and mortgage payments in an economy with high unemployment many people are desperate for more assistance. Senator Marco Rubio is proposing the Paycheck Protection Program be continued with more than half of the proposed $200 billion coming from funds already appropriated for the program, but more importantly for the SBA 504 program and small business borrowers, Section 1112 of the Cares Act expires for any funding after September 27th. Deadlines are approaching and today’s is a planned 4:30 announcement by Senate Majority Leader McConnell with the Republican’s plan for more stimulus.
Last week the EU took steps to borrow as much as €750 billion that will be targeted for economically weakened member states.
Collapse of the US Labor Market
As mentioned in the header for this WSJ chart the US labor market is in its fifth-month of decline and now claims can be expected to remain elevated with several states restricting businesses that had previously reopened.
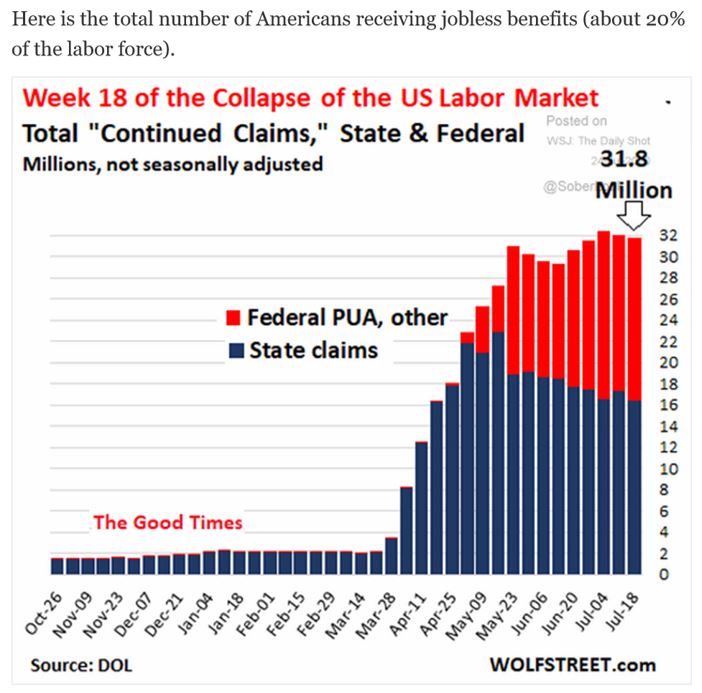
Other Reports
- Economic reports were scarce but both Existing (+20.7%) and New (+13.8%) Home Sales rebounded sharply as buyers are able to access low mortgage rates
- Reflecting less demand for emergency credit as market conditions have improved the Fed bought Zero of its announced amount of $250 million Agency CMBS
- Oil industry increases layoffs as demand falls
- Gold reaches $1900 a troy ounce as geopolitical tensions keep it on its longest winning streak since 2011 and is 77% higher from its low point in December 2015
The Week Ahead
The FOMC meets Tuesday and Wednesday with no policy change expected, Treasury sells $165 billion of Notes in addition to $101billion in 13 and 26-week Bills, 2Q2020 GDP estimate, and the Fed’s preferred inflation gauge on Friday.
Monday – Durable Goods expected to be +5.4%; Treasury auctions $101 billion 13 and 26-week Bills, $48 billion two-year Notes, and $49 billion five-year Notes
Tuesday – FOMC meeting opens; Treasury sells $24 billion two-year Floating Rate Notes and $44 billion seven-year Notes
Wednesday – FOMC announcement and Chairman Powell press conference
Thursday – 2Q2020 GDP estimate forecast to be -35% vs. -5% in 1Q2020
Friday – PI&O – Personal Income expected to be -1% while core PCE forecast to be +0.2% m/m and +1.0% y/y, far below the Fed’s 2.0% target
July 20, 2020
Headlines to Choose From
S&P Edges Up, Ends Week with Modest Gains
Stocks End Lower as Economic Concerns Flare Up
US Stocks Finish Higher After Promising Vaccine Study
US Stocks Extend Gains as Banks Kickoff Earnings Season
Tech Stock Rally Not Out of Juice Yet, Analysts Say
Whichever headline of the WSJ you choose you had a possible reason for daily price action that left equities relatively unchanged on the week with DJIA +2.3%, the S&P 500 +1.5%, and Nasdaq -1.1%, for a change. From a social perspective the most poignant headline deals with a promising vaccine study that would permit leaders to better identify a timetable for resuming activities that would be as close to normal as possible. Moderna’s coronavirus vaccine triggered immune responses across three varying doses in a Phase 1 study and the stock surged higher by 35% w/w. With the federal government challenging states over mask wearing and business reopening plans, plus certain state’s challenging some of their cities over the same issues it seems likely that development of a viable vaccine is our hope going forward.
Since investing in stocks is a capitalist endeavor the banks earning season is of particular note and results were strong as the five major US banks reported combined trading revenues of $33.4 billion in the second quarter, their best performance in ten-years. Volatile market activity and the significant central bank intervention are identified as the catalysts for this performance, yet caution was offered to not expect such a performance in this quarter. Optimism was tempered with the banks’ announcement of $20 billion being set aside for loan loss reserves as defaults and bankruptcies are expected.
The Financial Times identifies the fixed rate markets as being the best performers, beneficiaries of both the 150 bps rate cut in March and the simulative buying programs initiated by the Fed. As much as fixed rates trading was a driving force in Q2 Treasuries remain in a vacuum with the ten-year benchmark ending the week at 0.63%, just 1 bps lower than when the 504 program priced its monthly sales on July 9.
Speaking of Rates
For the first time in history 30-year residential mortgage rates dropped below 3% at 2.98%, 74 bps lower than where the year started. As attractive as this is for homeowners it also confirms we are still in a crisis. Fixed rate mortgage rates tend to fall in line with ten year Treasury yields and at a spread of +235 bps the 2.98% level remains high, indicating that mortgage rates have more room to fall once brokers clear the backlog of applications, mostly for refinancing. Not benefiting from these low rates is Existing Home Sales which were down 9.7% in May after a 17.8% decline in April. Pandemic caused employment concern and light inventory resulting in elevated prices, are given as reasons for this stagnancy and we get the June report on Wednesday.
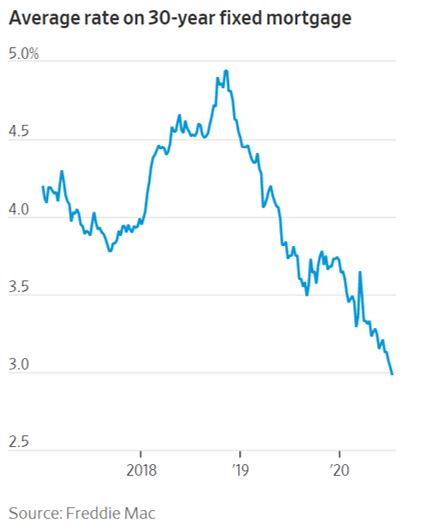
Another issue regarding rates that might explain the demand for riskier assets like stocks, is the breakeven inflation rate - the difference between the nominal yield of ten-year Treasuries and the inflation protected ten-year Treasury, now trading at -0.85%. This spread was last seen in 2012 and indicates investors have increased inflation expectations and little concern about a rise in short-term rates as they seek investments better than bonds that yield less than the inflation rate.
Other Reports
The weekly economic reports all were positive though like bank caution about losses analysts fear that a roll back of business resumptions will negatively impact future resorts.
- Industrial Production was +5.4% following its 1.4% gain in May
- CPI rose sharply to +0.6% after three consecutive monthly declines
- Jobless claims were lower, only slightly, to 1.288 million
- Retail Sales were +7.5% after a 17.7% surge in May
- Housing Starts showed a second month of recovery from March’s sharp decline
The Week Ahead
No Fed speak ahead of the July 28-29 FOMC meeting, and a light economic calendar. Treasury to sell 13 and 26 week Bills, 20-year Bonds, and ten-year TIPS
Monday – 13 and 26 week Bill auctions
Wednesday – Existing Home Sales; 20-year Bond auction
Thursday – Jobless claims; 10-year TIPS auction
Friday – Purchasing Managers Index Composite Flash; New Home Sales
July 13, 2020
Record Low Rates, Again!
In a sale that forebodes the right axis of this chart possibly needing to be revised the SBA 504 program last week priced its July debentures at record low rates, with the 10-year issue below 1% and the 20-year maturity barely above it, at 1.03%. Completing the sale, the 25-year debenture was priced at 1.15%, matching its tightest spread to the twenty-year issue.
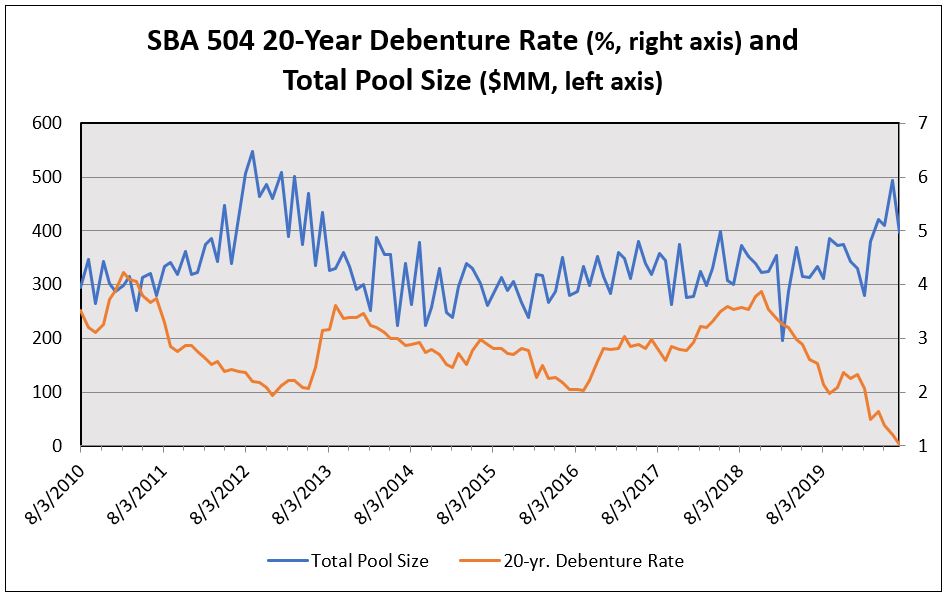
It is dramatic to see how far twenty-year debenture rates have fallen since 2018-20K was priced at 3.87% while the Fed was still raising rates. Of interest is the market began easing for the Fed before the central bank capitulated and made its first of five rate cuts in July 2019, at which time 2019-20G was priced at 2.53%. So, since November 2018 the Federal Funds rate has been cut 225 bps and 504 twenty-year debenture rates have declined 284 bps. That performance is more than rates just trending down as Steve Van Order, Selling Agent for the 504 program, reports investor demand for the product is robust with increased distribution to investors that has seen the twenty-year pricing spread to benchmark Treasuries tighten by 50 bps since the market turmoil in March. Two things stand out from recent sales – the dominance of the twenty-five series (representing 65% of the July sale) and the benefit of the Term Asset-Backed Securities Loan Facility (TALF), a program that supports the issuance of Asset Backed Securities like DCPC’s that can be sold by investors to the Federal Reserve Bank for three-years, thereby freeing up capital for lending and other investments.
As significant as those debenture rates, are the ongoing Effective Rate to small business borrowers is more impressive with all maturities posting fixed-rate costs below 2.50%.
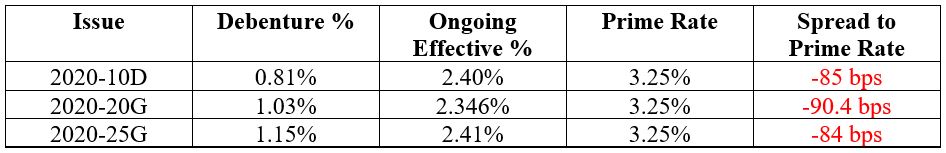
Other Items in Review
On Friday, the US reported another daily outbreak of more than 60,000 COVID-19 cases with the daily death toll exceeding 800 for the fourth consecutive day. Sunbelt states in particular have been hard hit with many continuing to roll back planned phases of operation.
What has become routine is the stock market shrugging off this news that is slowing the economic recovery as stocks edged higher with the Nasdaq market again setting the pace with a 4% weekly gain. The benchmark Treasury rate closed the week where it was for Thursday’s debenture sale, at 0.64%, and the Fed purchased zero of the announced amount of $250 million GNR PL’s that it had authorized. Significant developments in names other than the surging FAANG’s were:
- United Airlines announced it my lay off as many as 36,000 people, one-half its US work force
- Harley Davidson continues to see sales decline and will cut 13% of its work force
- Walgreen’s announced a $1.7 billion quarterly loss as fewer doctor visits resulted in fewer prescriptions and reduced in store consumer spending; also, will cut staff in its UK operations
- Brooks Brothers announced a bankruptcy filing
- And US companies slashed dividends by $42.5 billion in Q2, the fastest pace of decline in more than a decade
In a light week for economic reports jobless claims edged lower to 1.3 million and the core reading for PPI was -0.3% for June and +0.1% Y/Y.
The Week Ahead
A light week for Treasury issuance; the blackout period for Fed speak begins ahead of the July meeting; the SBA 504 program funds its July debenture sales.
Monday – Treasury sells $105 billion 13 and 26-week Bills
Tuesday – Treasury sells $34 billion 52-week Bills; CPI expected to be +0.5%
Wednesday – Industrial Production forecast as +4.1%; SBA 504 program funds $397,271,000 July debentures
Thursday – Jobless claims; Retail Sales expected to be +5% after a 17.7% surge in May
Friday – University of Michigan Consumer Sentiment survey
July 6, 2020
Positive Signs, But…
A second consecutive gain in non-farm payrolls and a decline in the unemployment rate are both positive signs for an economic rebound but enthusiasm has been dampened by a surge in coronavirus infections that has reversed the reopening plans for many states. Through Friday Johns Hopkins University reports the US has recorded 2.84 million cases and nearly 130,000 deaths.
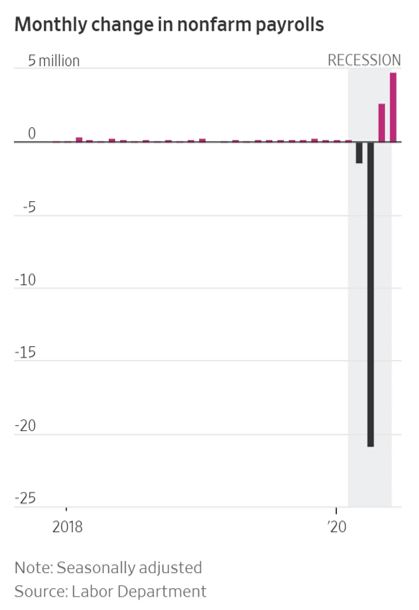
The US economy gained 4.8 million jobs in June after a 2.7 million increase in May as the unemployment rate dropped to 11.1%. Restaurants and bars, part of the leisure and hospitality group, accounted for 40% of the job gains and with the increased infection rate being attributed to this type of social activity these workers are particularly vulnerable to layoffs which could negatively affect next month’s reports.
In another positive jobs related report, the applications for jobless benefits, a proxy for layoffs, fell by 55,000 last week to 1.43 million while those receiving unemployment benefits increased by 59,000 to 19.3 million. All of these numbers point to how precarious this recovery is and how management of this pandemic is so crucial to sustained economic growth.
Other Reports
Similar to the jobs data other reports were also positive:
- Pending Home Sales increased 44.3%, 4X stronger than expected
- ISM Manufacturing was 52.6, also above consensus
- Factory Order were +8%, rebounding from a 13.5% decline in May
- The remaining $130 billion of Paycheck Protection Program funds were kept available by extending the program to August 8th
Fed Activity and Comments
The Fed has already bought $9.2 billion Agency CMBS product and in recent weeks has not bought the maximum amount planned for, an example of how the activity has calmed that market and returned its pricing spreads to pre-pandemic levels. An indication of that normalcy is they purchased zero of the planned amount of ≤$500 million FNM DUS and plan to purchase just ≤$250 million GNM PL’s this week.
The release of minutes from the Fed’s June meeting carried no real surprises – an emphasis on the Committee’s concern for additional waves of the virus and its impact on unemployment and the overall economic recovery.
Market Activity
Treasury rates softened with the ten-year benchmark higher by 2 bps at 0.67% while equities ignored the increased outbreak and held small gains, led by the tech heavy Nasdaq that was better by 3% on the week. Oil continues to appreciate, up 6% on the week as production cuts have helped, along with a strong jobs report.
At 0.67% the benchmark Treasury is unchanged m/m as the SBA 504 program prepares to market its July debentures.
The Week Ahead
The SBA 504 program prices its July debentures and Treasury to sell $106 billion 13 and 26-week Bills and $94 billion Notes & Bonds in their quarterly refunding. A light calendar for reports and Fed speak.
Monday – Treasury auctions 13 and 26-week Bills; ISM Non-Manufacturing index
Tuesday – 3-year Note auction of $46 billion
Wednesday – 10-year Note auction of $29 billion
Thursday – 504 program prices 10, 20 and 25-year July debentures; 30-year auction of $19 billion
Friday – PPI expected to +0.3%
June 29, 2020
Virus Surge Halts Reopenings
Reports of a surge in Covid-19 infections have delayed or reversed an economic reopening in many southern and western states. Its impact has weakened the equity rally and moved safe-haven Treasury yields lower. North Carolina delayed its move to Phase 3 and now requires face masks to be worn in all public places while Texas and Florida limited access to bars and restaurants due to a spike in infections, especially among younger adults. Criticism abounds over how officials did not recognize the potential spread of the virus through symptomless transmission so measures like this will further delay the hoped for economic rebound. While attendance at these venues will be limited the pandemic has hurt the retail sector less as consumer spending showed an 8.2% increase even as unemployment is at an historically high level. The increase reflects only a partial recovery from recent lows, and it is uncertain if gains can be sustained as personal income was reported to be -4.2% and consumer sentiment remains depressed. Another part of this release showed the Fed’s preferred inflation gauge to be +0.1% in May and +1.0% YoY, well below its 2.0% target. As mentioned in the Committee’s most recent forecast they expect this rate to remain subdued through next year.
This WSJ chart shows how the ten-year benchmark rate has reached a level 2 bps lower than when the SBA 504 program’s June debentures were priced, and 7 bps lower than its three-month average rate since the Fed cut rates in March.
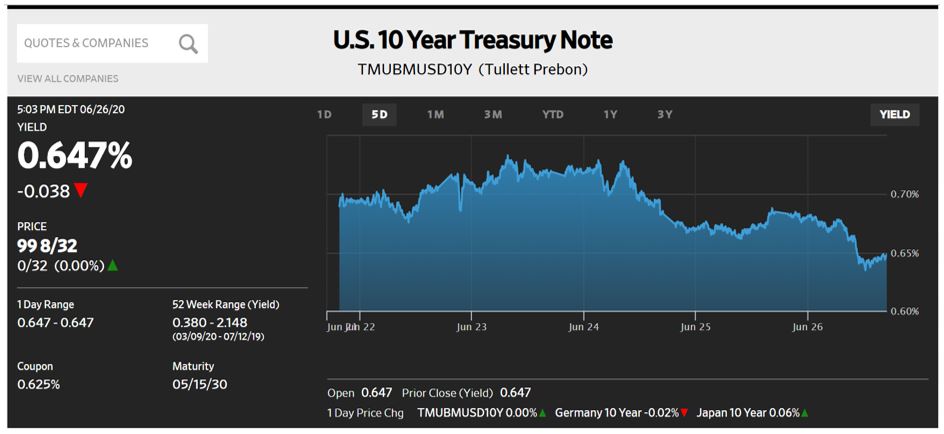
Other Items of Interest, or Concern
- The IMF predicts the global recession will be much worse this year with GDP at -4.9%
- From cbsnews.com - “as many as 653,000 small businesses that were given forgivable 1% loans through the Paycheck Protection Program could begin cutting employees as early as next month as funding begins to run out. What’s more, 70,000 of those businesses are expected to lay off as many as 10 workers each.” These findings come from a survey conducted by the National Federation of Independent Businesses
- Demand for sovereign debt remains strong as Austria sells €2 billion Century bonds maturing July 2120 at 0.88%. An indication of that demand is a total of €17 billion orders were submitted
- Jobless claims declined slightly but remain elevated at 1.480 million, the 14th consecutive week above 1 million
- The third estimate of 1Q2020 GDP is unchanged at -5.0%
- Financial stocks sold off sharply Friday (as much as 7%) after the Fed revealed its stress tests show banks have been “a source of strength during this crisis” but directed them to preserve capital by suspending share repurchases and capping dividend payments by basing them on recent income
- Fed bought just $33 million GNM PL’s of the proposed amount of $500 million; only $347 million were offered
The Week Ahead
Due to a shortened trading week ahead of the Independence Day holiday we will see the jobs report released a day earlier than usual on Thursday, along with jobless claims. A light week for Treasury issuance at just $105 billion 13 and 26-week Bills.
Monday – Treasury auctions 13 and 26-week Bills
Tuesday – Paycheck Protection Program ends; Consumer Confidence report; Chairman Powell appears before Congress
Wednesday – ISM Manufacturing Report; FOMC minutes of the June meeting are released
Thursday – Non-Farm payroll, Jobless claims, and Factory orders
June 22, 2020
Covid-19 Rally
That is how the continued improvement in equities is described as the DJIA pushed higher thanks to Tuesday’s report of a 17.7% gain in Retail Sales, helping to offset the April decline of -14.4% and some of March’s -8.7% number. This improvement was significantly above forecast and the largest increase in its record gathering dating to 1992. The one-time stimulus checks of $1200 plus the additional $600 federal boost to states’ unemployment benefits have been drivers of the surge. The biggest drivers were gains of 188% in clothing sales, 89.7% for furniture and a 44.1% rise in spending on motor vehicles.
For the week, the DJIA was +3.4% and while not yet back to January 2 levels it has recovered 28% from the depths of March 23rd, as seen in this WSJ chart. Its recovery (like the NASDAQ which is actually positive on the year) has been relentless as even the report of renewed Covid-19 cases could not dampen demand for this asset class that is on track for its best quarterly performance in a decade.
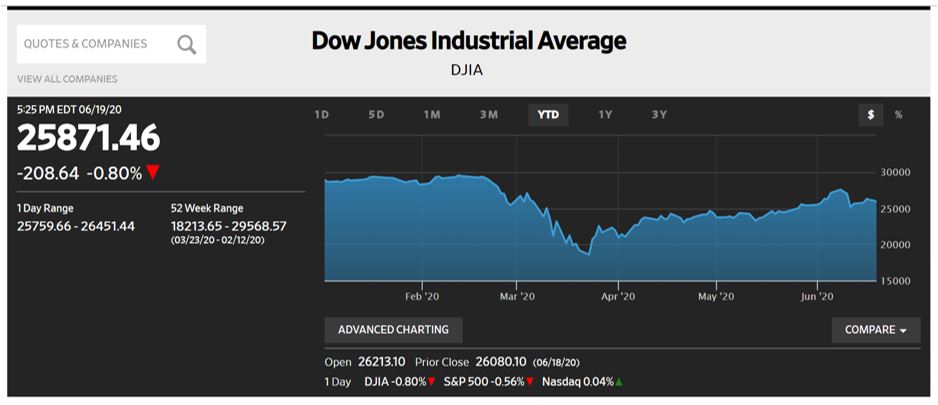
In other markets:
- Treasuries marked time with the ten-year benchmark closing unchanged on the week at 0.70% but lower by 118 bps YTD
- Oil continues to improve thanks to some increased demand, aided by production cuts that actually were cut. WTI crude oil gained 10% on the week to close at $39.43 a barrel but lower by almost 40% YTD as the US faces its lowest production since 2018
- US$ continues to weaken as the “avalanche of cheap money” has pushed stocks higher, making US equities the significant driver of the dollar’s value. As domestic equities have risen the dollar has fallen, creating an unusual divergence. Ordinarily economic fundamentals like the outlook for economic growth and interest rates will support a currency yet Australia and the UK, faced with high unemployment and dim prospects for growth, have both seen their currencies strengthen recently
Other Reports
Jobless claims dropped slightly to 1.5 million and in his Congressional testimony Chairman Powell noted there are some signs of improvement in the economy but stressed that unemployment as well as output remain below pre-pandemic levels. Continued use of all the bank’s tools was stressed as was the need for fiscal stimulus. Also highlighted by this crisis is the range of “troubling inequities” present in our society.
The mere presence of the Fed’s support continues to be sufficient in supporting markets like Agency CMBS where they bought just $29 million of the announced amount of $500 million GNM PL’s, with $864 million securities offered to them. This sector is where the 504 program’s DCPC’s trade and its credit spreads continue to improve.
The Week Ahead
Fed speak, some housing data, the third estimate of 1Q20 GDP and the Fed’s preferred inflation gauge; plus, Treasury auctions $265 billion in Bills, Notes and FRN’s.
Monday – 13 and 26-week Bill auctions
Tuesday – 2-year Note auction
Wednesday – 5-year Note and 2-year Floating Rate Note auctions
Thursday – Durable Goods report, GDP expected to be -5%, 7-year Note auction
Friday – Personal Income and Outlays expected to be negative
June 15, 2020
Best Rates in Program History
Small business owners who utilize the SBA 504 program continue to benefit from this easy monetary policy by locking in long-term fixed rate funding at historically low rates. This chart identifies the two recent trends that confirm increased issuance and lower rates. At $493,674,000 the June sales were 27% larger than the previous 12-months average and at 1.21% the 20-year debenture is the lowest in history and translates to a 2.53% ongoing effective rate. The 25-year maturity at 1.34% (also the lowest ever) represents an effective rate of just 2.60%, both significantly below the prime rate. A further indication of how popular the 25-year maturity is for borrowers is it represented 67% of the sales total size.
With the 90-day deferment coupled with six months debt forgiveness provided by SBA on loans funded before September 27 it is expected the 504 sales will see increased volume for the next three sales.
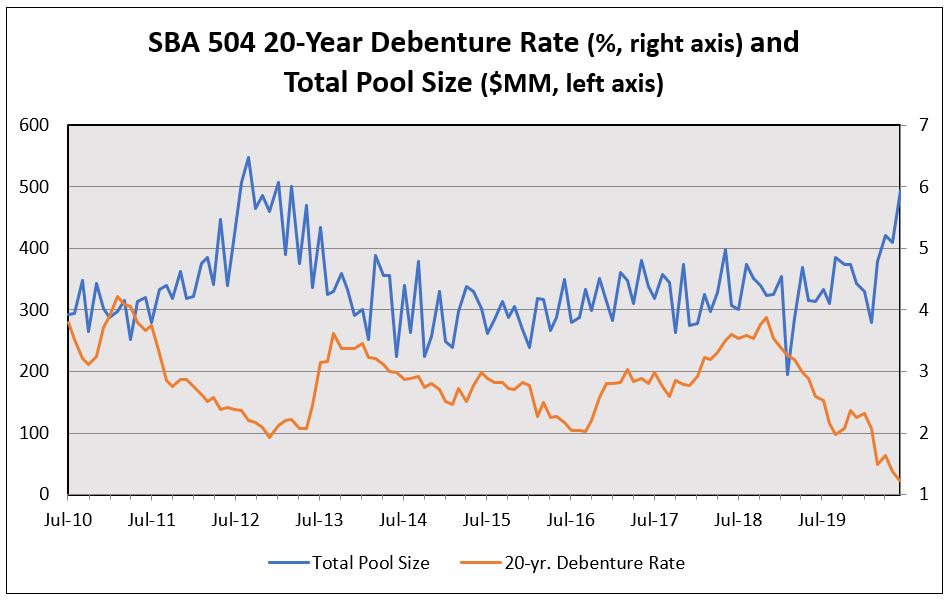
Previous commentaries have noted how effectively the Fed has stabilized markets as they continue to buy far fewer Agency CMBS product than planned for and last week was no exception, buying just $54 million of a planned amount up to $500 million FNMA DUS. Reflecting investor demand for that sector the two June debentures were priced 16 bps lower than in May while the ten-year Treasury benchmark had declined by just 2 bps, the best non-crisis spread tightening in history.
Dovish Fed
After initiating an unprecedented array of financial stimulus platforms, the Fed last week basically said “they’re not even thinking about thinking of raising rates” anytime soon. In their policy statement released after last week’s FOMC meeting officials projected they will keep rates at zero through the end of 2022. Expectations are for unemployment to drop to 9.3% by year-end and as low as 6.5% in 2021. The possible misclassification for being either unemployed or out of the labor force challenged the accuracy of May’s 13.3% rate as having been misstated in previous months. Challenging Chairman Powell’s statement that “it could be some years before we get back to those people finding jobs” President Trump criticized the Committee’s report and predicted a faster recovery.
Other projections from the Committee were for economic growth to contract between 4% and 10% this year, recovering in 2021 to a rate somewhere between -1% and +7% and this WSJ chart shows their numbers trend similarly with those of ING, a financial analytics firm, with modest differences. Such dovish, easy money policy that we are experiencing is expected to finally increase inflation, but the Fed report forecasts is below target over the next two-years. One change in Wednesday’s announcement is the Fed expects to continue to increase its monthly purchases of Treasuries and Agency CMBS.
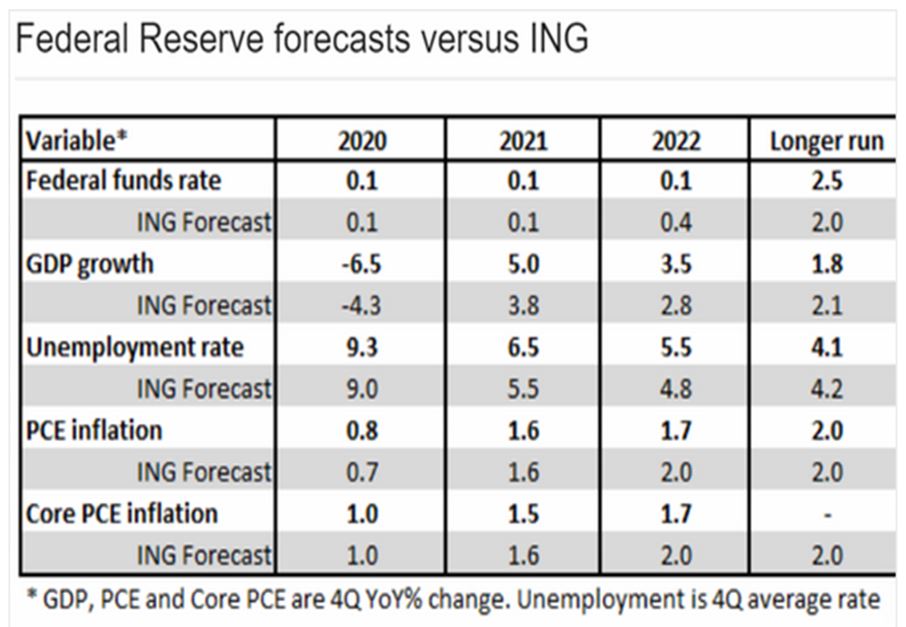
Other Reports
- Both CPI and PPI came in at -0.1% at the core level and jobless claims were 1.5 million
- National Bureau of Economic Research confirmed the end of the economy’s 128-month expansion, the longest on record
- It took a day to digest the Fed statement but the sharp Thursday selloff in stocks propelled the DJIA down 6.8% on the week. It has been a bumpy ride for stocks this year and volatility, once just a metric for the asset, now seems to be a trading discipline
- Treasury rates declined with the ten-year benchmark down 19 bps on the week yet 4 bps higher (at 0.70%) than when the June debentures were priced on Thursday
The Week Ahead
Fed speak resumes with Chairman Powell speaking before Congress Tuesday and Wednesday, a light economic report calendar with just Industrial Production expected to be +2.6%, and Retail Sales expected to show some improvement. Treasury sells $180 billion in Bills, 5-yesr TIPS, and the reintroduced 20-year Bond.
June 8, 2020
Clouded Forecast – Flawed Report
Estimates for Friday’s non-farm payroll report for a loss of 7 million jobs with unemployment rising as high as 19% were grossly inaccurate. Coming in with a gain of 2.5 million jobs and unemployment declining to 13.3% the report was heralded as a sign the economy may quickly rebound. Stocks certainly agreed as the DJIA gained 3.5% on the day and 6.8% on the week. Because of low yields in fixed income product it appeared stocks had been rallying because investors believed there was no alternative for investment; now, even with very high P/E ratios stocks have cost short sellers dearly and may attract additional buyers. Caution has been voiced by Federal Reserve officials who have warned a full recovery may not occur until the end of next year and the question must be asked – at what point can markets stand-alone without Fed stimulus? Tainting the report was news that the last two-month’s reports misstated furloughed workers as employed thereby lowering the unemployment by as much as 3%. It was the hardest hit industries that began rehiring - leisure and hospitality, construction, and health care while government hiring shrunk by 595,000 as cash strapped municipalities had to cut payroll.
Inevitable
It doesn’t take a financial analyst to understand why the back end of the Treasury curve has steepened recently. With interest rates historically low and the budget deficit at a record high there has been a chorus of advocates for Treasury to move its increased funding needs out of the curve, like it did with the reintroduction of the 20-year debenture three-weeks ago. A recent weakening of US$ has added to this mix, accelerating a move to higher rates. The relationship between 5-year and 30-year yields has spiked from a recent low of +66 bps on January 1 to +120 bps last week. Of more relevance to the SBA 504 program is the ten-year rate, as displayed in this WSJ chart, which closed 26 bps higher on the week and 21 bps above where the May debentures were priced.
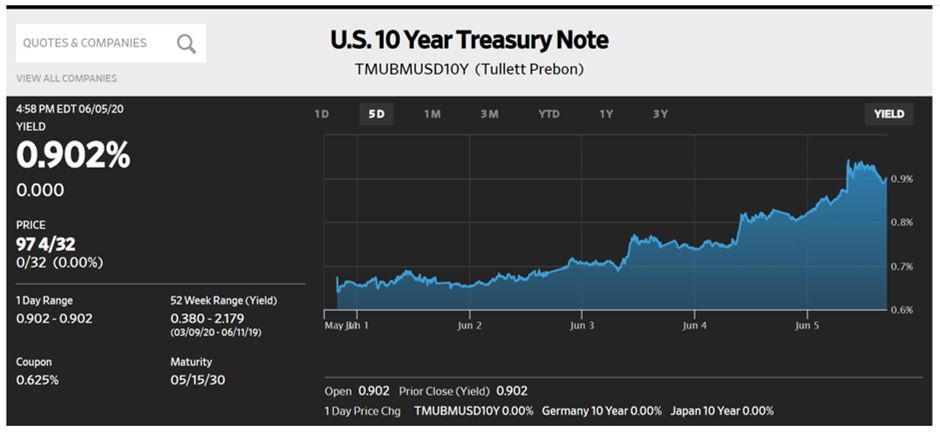
With all the purchases it has made and facilities it has created the Fed has discussed an even more bold approach – capping yields on Treasury securities. To do so would require the bank to buy unlimited amounts of debt as Australia did in March when it set 0.25% as the cap for its three-year debenture. Evaluation of this approach will continue but no discussion of it is expected to be part of Wednesday’s announcement.
Program Growth
Helped by an effective cost of long-term funds well below 3% on recent issues, and a reduced amount of voluntary prepayments in June, the OPB of debentures for the 504 program reached its highest level this month since July 2016. June prepayments of $141.7M were $55 million below the previous 12-months average and with recent incentives like 6-months debt forgiveness for loans funded before September 27, the program is poised to see increased issuance for at least the next four-months.
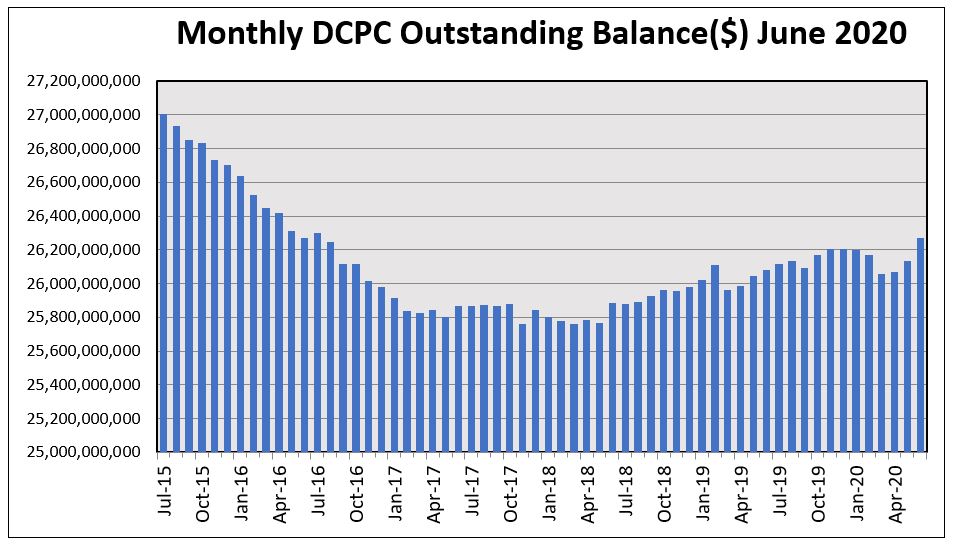
Other Developments
- Both the ISM Manufacturing and Non-Manufacturing reports came in stronger than forecast while Factory Orders came in -13%, as expected.
- The ECB expanded its Pandemic Emergency Purchase Program by €600 billion to a total of €1,350 trillion through June 2021 with plans to reinvest proceeds until 2022 year-end.
- Bond funds saw $22.5 billion added through last Wednesday with much of that amount directed to Corporate debt. An indication of how strong demand is for that credit was Amazon’s ability to sell $10 billion of debt at low rates, including a 3-year issue at just 0.40%.
- In yet another indication of how effectively the Fed has calmed capital markets is that they purchased zero Agency CMBS of their planned purchase amount of $500M FRE K debt. Just $234M of that name had been offered, an indication of diminished dealer inventory and investor demand. This is of particular interest to the 504 program as its DCPC debt trades in that Agency CMBS market which is well bid by investors.
The Week Ahead
The SBA 504 program prices its 20 and 25-year June debentures on Thursday; Treasury conducts its June refunding sales totaling $209 billion in Bills, Notes, and Bonds; FOMC meets Tuesday and Wednesday with its economics projections released Wednesday afternoon with a Jay Powell press conference at 2:30. CPI and PP are released mid-week. Fed plans to purchase $20 billion Treasuries and as much as $500MM FNM DUS.
June 1, 2020
Higher and Higher
The DJIA and S&P 500 indices both gained almost 4% last week, outpacing the Nasdaq exchange for the first time in recent history as all three shrugged off continuing weak reports. Their performance was bolstered by the prospect of reopened businesses as many states eased restrictions. As bleak as these markets were in March the Nasdaq is now +5.8% YTD while DJIA is -11% and the S&P 500 index is -5.8%.
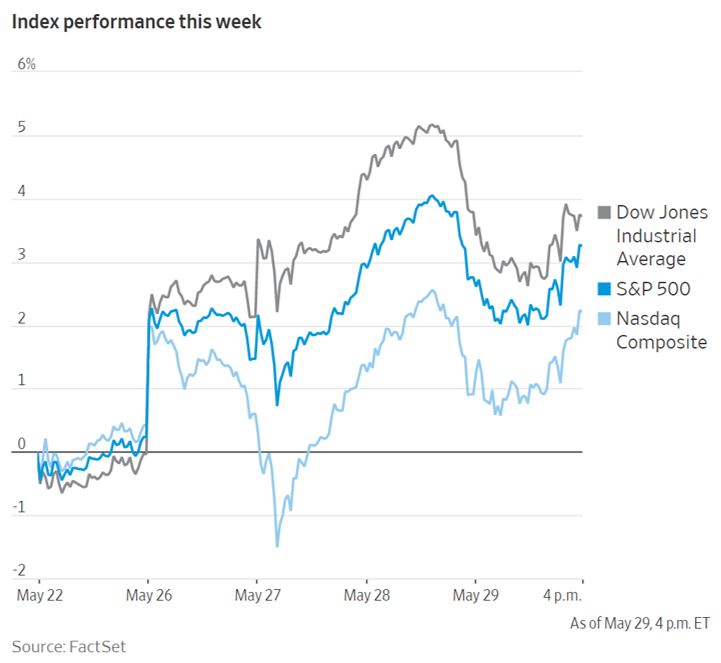
In other capital markets activity, the benchmark ten-year Treasury continues to trade in a vacuum, closing at 0.66%, just 3 bps lower than when the SBA 504 program priced its last debenture sale on May 7th.
The Fed continues to use its many facilities and proof that its support has calmed markets is it bought just $1 billion of Corporate debt in the week and just $207 million of its announced total of $500 million Agency CMBS, with $1,171 billion securities made on offer to them.
Regarding the Fed, Chairman Powell spoke on Friday affirming the Committee is strongly committed to helping the US economy, a more emphatic pledge that they will take additional action and this too helped stocks close the week on a high note.
Waived Fees
With the Fed’s base rate range at zero to 0.25% money market funds offer yields as low as 0.06% so to avoid a negative yield to investors some have waived their fees while most have sharply reduced them. The prospect of such a low yield represents safety as much as anything else as these funds now total $4.8 trillion, up $1 trillion since early March. This official rate range existed from 2009 to 2015 without funds going to negative yields but that is a concern for the sector now if the Fed should pursue a negative interest rate policy, something the Fed Chairman has said the Committee would not pursue but is a concern that overhangs the market.
Reports
- Certain reports like Durable Goods at -17.2% were to be expected but a 10.5% gain in Personal Income was unexpected, possibly impacted by federal economic recovery payments. That income did not translate to consumer spending which declined 13.6% in April resulting in an increase in savings
- The Personal Consumption Expenditure decline of 0.4% was expected, lowering its YoY core inflation number to 1%, further away from the Fed’s 2% target
- 2nd estimate of 1QGDP came in as expected at -5%
- Jobless claims were 2.1 million bringing the ten-week total to 40 million
- Globally, the IMF predicts GDP to be -3% and the World Bank forecasts the highest poverty levels since 1998. Taken together it is even more impressive that stocks continue to rally.
The Week Ahead
ISM Manufacturing and Non-manufacturing reports plus weekly jobless claims and Friday brings the jobs report. Blackout period on Fed speak begins and Treasury to sell just $127 billion 13 and 26-week Bills, plus an undetermined amount of 4 and 8-week Bills. On the buy side, the Fed will purchase just $22.5 billion Treasuries and up to $500 million FRE K-2.
May 26, 2020
Flat
Both the rates market and equity indices ended the week unchanged as oil continued its rehabilitation, up 10% on the week and 69% since April 21. The Fed continues to dominate attention, both in action and policy intent. An indication of its success in supporting the Agency CMBS market is its reduced purchase of GNR PT securities last week, buying just $48 million of an announced amount of $250 million with $656 million having been offered. This week they increased its purchase amount to $500 million FNM DUS and just $20 billion US Treasuries.
In other rates market activity Treasury saw strong demand for its 20-year auction, selling at a rate of 1.22% and over-subscribed at 2.5X.
Talk of negative interest rates and central bank policy centered on the UK as it sold £3.75 billion 3-year Gilts at -0.003% and indicated it may have to examine a negative rate policy as it announced inflation had dropped to 0.8%.
One silver lining concerning rates is federal student loan rate has dropped to 2.75% from 4.53% a year ago, its lowest level in 15-years.
Concerning Fed policy Jerome Powell confirmed the bank is prepared to take more aggressive action if necessary but is not planning anything new for its June 9-10 meeting.
Bad News Continues
Related to the dramatic 90% decline in air travel Hertz, which depends on airport rentals for two-thirds of its revenue, filed for bankruptcy after it missed an already deferred payment date on a portion of its $19 billion debt.
In a light week for economic reports both Housing starts, and Existing home sales declined, the former because of work stoppages and the latter due to that plus light available inventory. Jobless claims continued to soar, now totaling 38.6 million over nine weeks.
Adding to US-China trade tension was Friday’s announcement that Beijing looks to impose a heightened National Security law on Hong Kong, prompting a strong rebuke from Washington. A Bank of America research piece predicts -40% GDP in Q2 and -8% YoY, with 2021 recovering to +4%. Unemployment could reach 20% before declining once the economy reopens but may be stuck around 10% for a while. It is pointed out that core PCE (mentioned below) could fall to 0.6% for the year, bolstering disinflation while moving further away from the Fed’s 2% target.
Phase Two
With some states progressing from stay-at-home to safer-at-home, several have allowed non-essential businesses to reopen with restrictions and another restriction will be people’s willingness to resume activity even if store and restaurant capacity is held to 50%. In a local survey the Charlotte Observer canvassed 6,500 people about resuming dining-in at restaurants and 65% replied they did not intend to do so in the near future, including the Mayor. This Observer cartoon by Kevin Siers captures that hesitancy while also identifying the need for consumers, both those working and those receiving extended unemployment benefits, to actively support reopened businesses even as they adapt to changing work schedules.
More companies are permanently shifting to work-at-home disciplines for many employees and the impact of that will be felt in commercial real estate, residential housing, and retail businesses located in urban and residential areas as the country acclimates to those changes. Of course, nothing moves forward if Covid-19 is not under control and states’ progression to eased conditions will be crucial to reach that goal.
The Week Ahead
Jerome Powell speaks again Friday. Treasury to auction $117 billion 13 and 26-week Bills and $127 billion 2, 5, and 7-year Notes plus $20 billion 2-year Floating Rate Notes; Second estimate for 1Q GDP on Thursday expected to be down 5%, along with jobless claims again expected to reach 2 million.
Further distancing itself from the Fed’s 2% inflation target the Committee’s preferred gauge is forecast to show Personal Consumption Expenditures down 0.3% and declining to 1% YoY, with Personal Income down 6%.
On a positive note, Wednesday will see NASA launch a Space-X rocket to link with the International Space Station, marking the first American launch in nine-years and the first not using the space shuttle.
May 18, 2020
Static
Static is an apt description of both price action and noise about inflation, concern for economic strength, and more trade tension with China. As for price action, Treasury rates closed slightly lower at 0.65% for the ten-year benchmark while domestic stock indices declined 1.5% while showing resilience in response to more historically weak reports. Commodities like oil and gold continue to show strength with oil up 25% WoW. The reports were:
- CPI at -0.8% and 0.3% YoY
- PPI at -1.3% and -1.2% YoY
- Retail Sales declining 16.4%
- Industrial Production down 11.2%
It is clear that inflation is not a problem for now and will continue to be elusive for central banks to hit their 2% target anytime soon. However, with debt soaring and central banks monetizing markets, the eventual economic recovery should lead to a reversal.
Retail sales showed the biggest decline since record keeping began in 1990 and a broad reading for factory output showed the largest drop in a century, making April the cruelest month. An additional 2.98 million people filed jobless claims pushing that total to 36 million over the last eight weeks and it is hoped that the many programs initiated by the CARES Act offering a bridge to small businesses and unemployed individuals will be just that, allowing the economy to reopen shortly and let many people return to a new work environment.
Due to the enormity of claims in the early weeks of the shutdown, this WSJ chart identifies a declining trend in jobless claims that have wiped out the previous decade’s gains. 24% of Americans who were employed in February have applied for unemployment benefits since March 20.
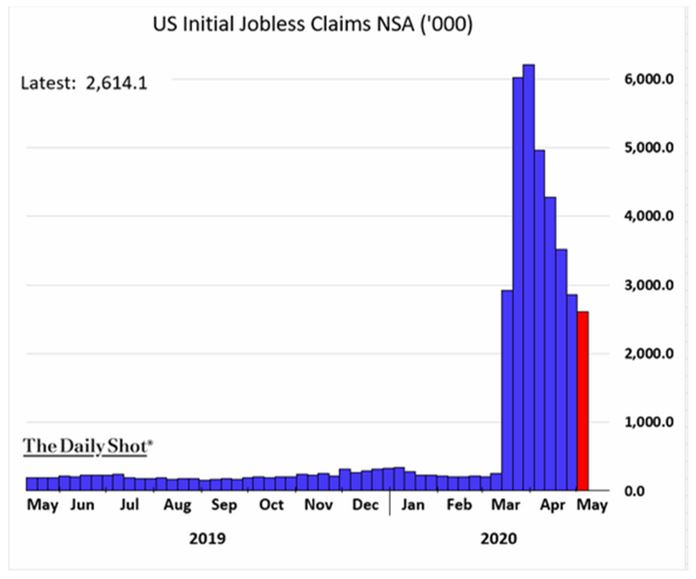
Fiscal Stimulus
In a speech on Wednesday, Chairman Jay Powell, designated the MIP (Most Improved Player) by President Trump, addressed the growing sense that the recovery may come more slowly than the Committee would like and stressed additional fiscal support (not just monetary stimulus) would be worth the cost if it could help avoid long term damage. He also reiterated there is no plan to cut the benchmark rate below zero and in an interview aired on 60 Minutes stated there is more the Fed can do.
Stabilization of the capital markets has been achieved by the bank’s purchases of more than $2 trillion of debt and they continue to buy less than their announced amounts of Agency CMBS product, purchasing just $259 million FRE K’s of an announced amount of $500 million. An indication of that market’s stability was evidenced by the historically low debenture rates for the SBA 504 sales that closed last week.
More Tension
Another news item that temporarily affected stocks Friday morning was the President’s call to restrict access for certain products to the Chinese conglomerate Huawei. The restrictions force foreign semi-conductor manufacturers whose operations use American technology and software to first get a license from US officials before making any shipments to the company. Such a limit on a country that is also suffering weak retail sales and high unemployment may force that government to provide fiscal stimulus as a way to rebound from the pandemic, something that has been missing so far. As significant as China is to the global economy, there is uncertainty as to how strongly it may recover from this crisis and if it will surpass the US as the largest economy as has been forecast. As for the current leader, an indication of just how strong the US economy had grown before Covid-19 can be seen in this chart which may explain why there is so much emphasis on reopening businesses.
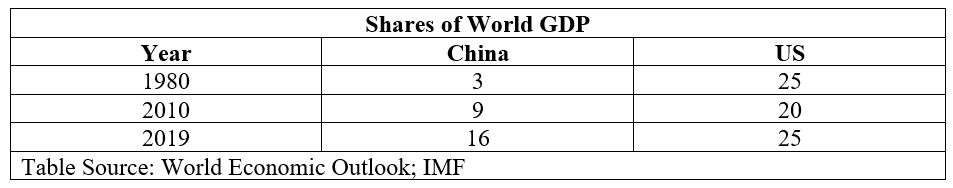
Adding to this tension was the Administration’s directive to a federal pension fund (Federal Retirement Thrift Investment Board) to not invest in certain Chinese stocks. The fund manages $594 billion for 5.8 million workers and had previously announced its intent to make such investments.
More Relief
Maybe. On Friday, the House passed a massive $3 trillion relief bill that is unlikely to become the fifth piece of legislation to fight the pandemic but does serve as a prelim to what seems inevitable.
The Week Ahead
A light week for economic reports; Treasury to auction $148 billion 13, 26 and 52-week Bills, $12 billion ten-year TIPS and $20 billion of the renewed 20-year Bond. The FRB will buy $50 billion Treasuries and just $250 million GNR PT’s, one-half of last week’s maximum amount. Fed speak is light, but Jay Powell speaks again on Tuesday.
May 11, 2020
Even More Perplexing
Subsequent to a record number of job losses, a historically high unemployment rate of 14.7%, and household names in the retail sector filing for bankruptcy, stock markets continued to rise. Even worse, if discouraged workers were included in this mix, the unemployment rate is even higher, at 22.8%. This category includes people capable of working who are currently unemployed and have not sought work the last four-weeks; in this current environment that is because most companies that haven’t furloughed workers have initiated a hiring freeze.
The S&P 500 index closed the week higher by 3.5% and the tech heavy NASDAQ improved by 6%, putting it in positive territory YTD as the other indices remain off by about 10%. Friday’s jobs report showed a decline of 20.5 million jobs after an additional 3.2 million people filed for unemployment benefits the previous week, bringing that seven-week total to 33 million. But that didn’t seem to matter.
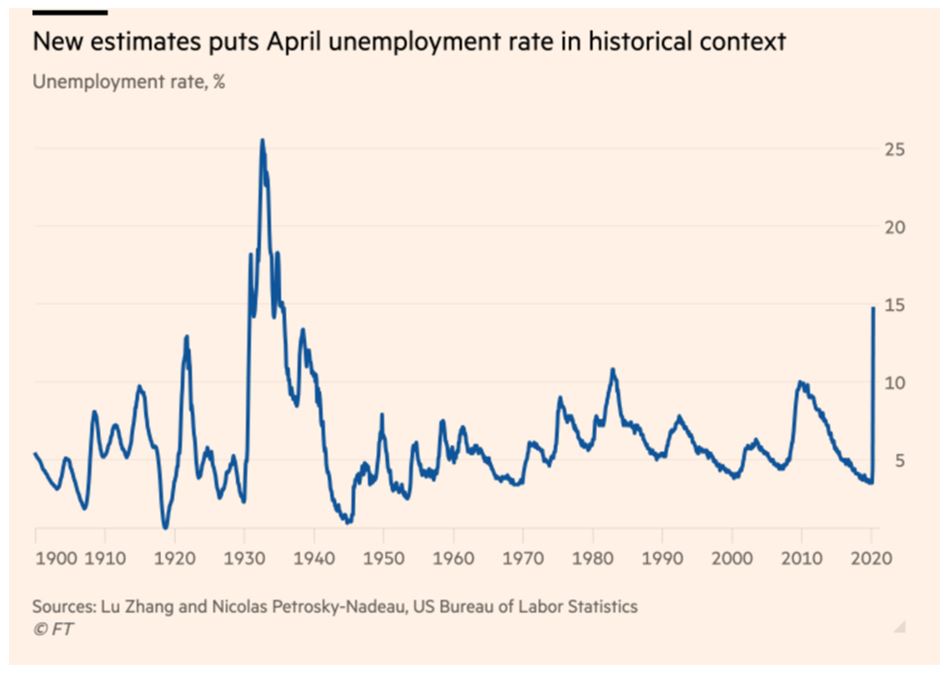
It is commonly accepted that stocks are forward looking, and this is confirmed by their decoupling from the economy as reports continue to reflect a recession with the recent unemployment rate surpassed only in 1933 during the Depression. Perhaps it is FOMO (fear of missing out) if hopes for a V-shaped recovery ensue, or better yet, it could be acknowledgement that decisive action taken by the Federal Reserve Bank is the driving force. From a zero-interest rate policy to buying high yield debt, the bank has calmed debt markets and provided a balm for equities.
Evidence of that calming effect is the reduced amount of Treasury and A CMBS purchases that it is making. For this week only $35 billion Treasuries and $500 million FRE K-2 are on the schedule, both down from as much as $450 billion and $1.5 billion, respectively.
Supply
To account for provisions in the CARES Act, Treasury will need to raise a significant amount of money and that starts now. For this current quarter alone, Treasury announced it would fund $3 trillion of debt versus $1.28 trillion funded in FY2019. To better distribute the issuance throughout the curve, it is re-introducing a 20-year maturity last seen 34-years ago when it was dropped due to insufficient demand. Tapping that maturity range with more supply should steepen the Treasury curve (2/30 curve +16 bps WoW and +48 bps YTD) as 2-year and 5-year rates moved to historic low levels. Additionally, the dreaded topic of negative US interest rates was broached as Fed Funds futures contracts imply short-term interest rates of between 0.015% and 0.03% for late 2020.
It has been shown in Japan and now Europe that negative interest rates do not spur economic growth and Jay Powell has stated a negative interest rate policy is not appropriate for the US. Another product that has faced unique supply problems of late is oil, but having seen futures contracts trade at negative prices just two-weeks ago it has reversed course and enjoyed a substantial 35% weekly gain through Friday’s close.
Record Low Rates
The SBA 504 loan program continues to fund at all-time low rates, enabling small businesses to lock in ongoing effective rates as low as 2.76% for 25-years, as indicated below.
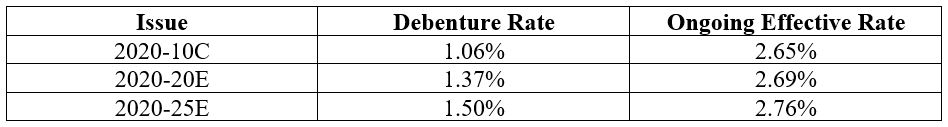
This chart shows the dramatic 250 bps decline in 20-year debenture rates from when the Fed was raising rates in late 2018. The blue line reflects the recent rise in total pool size issuance since February with the last two sales exceeding $400 million, and the program is poised to continue that trend as approved loans through March show a 35% increase Y/Y. Coupled with the CARES Act provision of 6-months debt forgiveness on loans funded before September 27, there is a great incentive for small businesses to lock in these favorable fixed-rates.
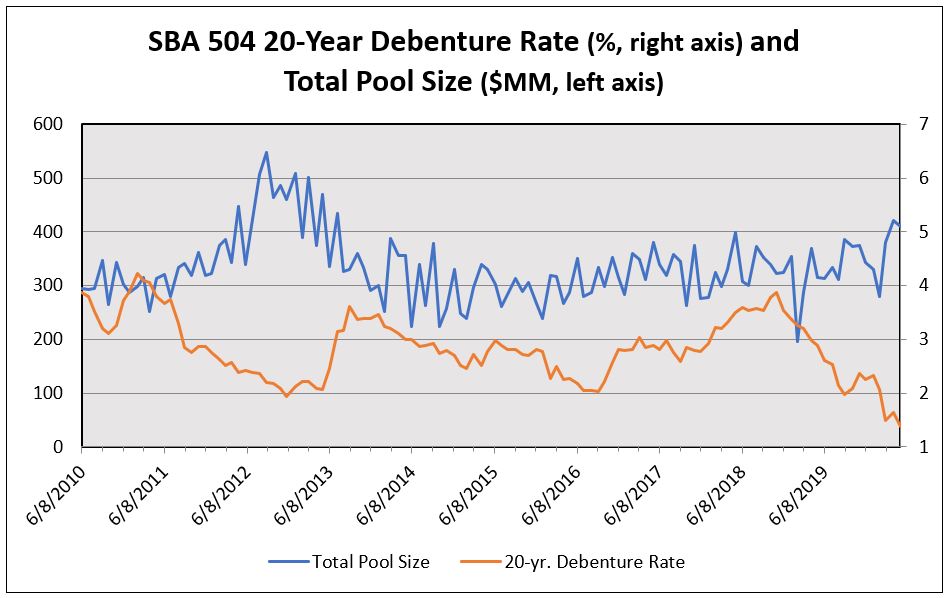
The Week Ahead
Fed speak, Treasury to issue $117 billion T Bills and $96 billion in 3, 10 and 30-year Notes. Reports are for inflation, weekly jobless claims, and Industrial Production
May 4, 2020
The Week Ended with a Thud!
What had been a relatively good week for stocks ended Friday with domestic indexes down about 3% as the market reacted to reports like Amazon declaring it expects to spend upwards of $4 billion in 2Q profits on increased delivery costs, wages, and protective equipment for employees. Similarly, Apple reported a profit decline and also opted to provide no guidance for second-quarter results. Contributing to this negative mood was a Presidential announcement criticizing China for its handling of the coronavirus and threatening it with more tariffs.
Economic reports continue to include numbers last seen in the financial market collapse and last week’s report on 1Q2020 GDP was no exception, coming in at -4.8% with analysts predicting a greater multiple of that for Q2.
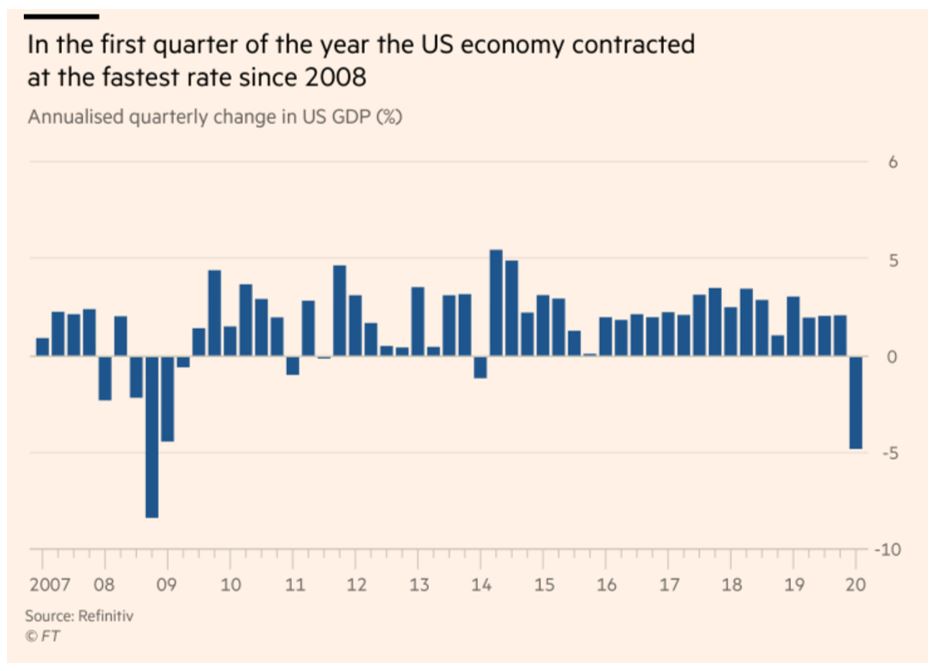
That forecast focuses on the lockdown and business cuts having only taken effect in mid-March, late in the reporting period. A 7.6% decline in personal consumption was the largest in 40 years and may reflect the future of some retail activity as more teleworking becomes the norm and businesses will resume only partial activity in phases. Ironically, health care was 40% of the Q1 decline as hospitals have cut staff due to lack of Personal Protective Equipment for many workers plus the elimination of elective surgery.
On Friday, the Institute of Supply Management manufacturing report showed its sharpest decline since 2008 at 41.5%, down from 49.1% in March. Readings below 50 for this report indicate business contraction, as will the non-manufacturing report scheduled for release this week.
Market Activity
The rates market marked time with the benchmark ten-year Treasury relatively flat at 0.62% (13 bps lower than when the 504 program priced its April debentures) as the Federal Reserve Bank continued its purchases of Treasury and Agency CMBS debt. Reflecting recent market stability, the bank once again bought fewer Agency CMBS securities than it targeted, focusing on cheaper offerings at higher dollar prices as its balance sheet has now reached $6.4 trillion.
Following the GDP release, Jay Powell’s post FOMC press conference highlighted the bank’s commitment “to use the full range of its tools” to preserve the crucial flow of credit and admitted that it is credible to believe that zero will remain an appropriate rate target for the Committee. Oil storage capacity took a breather as WTI gained 18% on the week as selling pressure waned.
Loans and Rulings
The Federal Reserve Bank expanded loan offerings and qualifications for its forthcoming $600 billion Main Street Lending Program. Unlike the Paycheck Protection Program that was increased last week, the Main Street initiative does require repayment of the loan to be offered at below market rates.
In a ruling Thursday, the IRS classified its tax treatment of the forgiven PPP loan, confirming the dollar amount does not create taxable income, but ruling the associated wages and other expenses are not tax deductible. This prevents a double tax benefit for businesses and could represent hundreds of billions of dollars for IRS.
The Week Ahead
Fed speak resumes, the SBA 504 program prices its May debentures on Thursday, Treasury to auction $108 billion 13 and 26-week Treasury Bills, and April job numbers on Friday are expected to show an unemployment rate near 16%.
April 27, 2020
A Quiet Week
Relatively speaking, that is. Equities and rates were basically flat while another $484 billion was added to the CARES Act for distribution to various programs, including $310 billion targeted for the popular Paycheck Protection Program. This represents the third coronavirus legislation and plans for a fourth package sometime in May are already being discussed. This spending has led the Committee for Responsible Federal Budget to raise its deficit projection for FY2020 to $3.8 trillion, 18.6% of GDP and projecting it to be 106% by 2022.
With interest rates so low, and the Fed buying so much Treasury debt, the interest expense to the government is just 2% of GDP, but that could rise if inflation results and the Fed reacts by raising rates, the standard response for curbing inflation. This enigma is not unnoticed by leaders like Mitch McConnell who was quoted Wednesday as saying this could “threaten the future of the country.” That said, he will be one of the architects for the fourth phase of legislation next month.
Economic reports and government announcements continued recent trends, weak numbers and more spending:
- FRB support of the Agency CMBS market continues as price stability results, evidenced by acceptance of fewer offers than announced
- ECB also is now accepting lower than Investment Grade debt as collateral
- UK to quadruple borrowing to £180 billion thru July
- US jobless claims were 4.4 million, bringing five-week total to 26 million
- China’s unemployment rate spiked to 5.9%
- Existing and new home sales slumped
- Durable Goods came in at -14.4%
- Impacted by its own supply glut, Saudi Arabia seeks to fund part of its projected $100 billion deficit with a $7 billion bond sale
Less than Zero!
We’ve seen dramatic charts the last four-weeks but this display for the price of May futures contracts for West Texas Intermediate crude oil is numbing! The April 21 expiration of this oil futures contract found traders with long positions on contracts with no demand and no economically feasible way to store the product if they took delivery. At the end of the day the contracts were worth a -$37.63 per barrel.
Yes, trading futures contracts may seem to be just an abstract financial transaction but if a trader is long at expiration then payment must be made, and delivery taken. In this case of negative prices, the seller actually has to pay the buyer, a dramatic departure from conventional trading and to better understand the obligation to take delivery - a single contract represents 1,000 barrels of oil, each containing 42 gallons.
This WSJ chart shows the problem was confined to the near contract only, as June and November delivery remained above $20 per barrel and closed the week slightly higher.
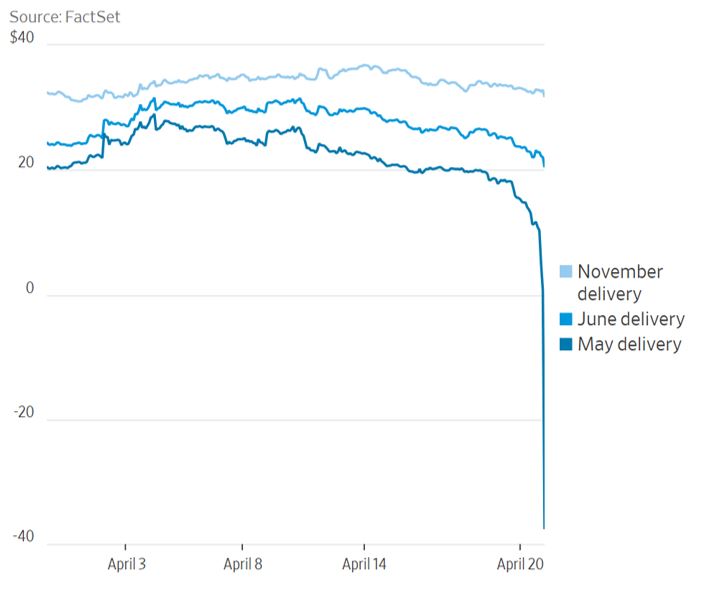
This predicament joined European interest rates and French electricity futures (where there is little ability to bank a surplus) at negative levels as another indication that such prices do not automatically trigger demand, a situation that has been worsened by the pandemic. As oil cheapened, the cost of storage increased sharply with the WSJ reporting 10% of super-tankers worldwide are now being used to store oil instead of transporting it.
The Week Ahead
Federal Open Market Committee meeting occurs with its announcement and Fed Chair press conference Wednesday afternoon. Treasury to sell $105 billion 13 and 26-week Bills and $134 billion intermediate term Notes. Fed to buy $50 billion Treasuries and up to $1 billion Agency CMBS (last week they purchased just $640 million of an announced amount of $1.5 billion.)
April 20, 2020
That was Fast!
From its start date on April 3, the Small Business Administration reports that 5,000 lenders have processed 1.6 million loans that have exhausted the $349 billion available through the Paycheck Protection Program. Administrator Jovita Carranza identified the scope of this performance as the agency has processed 14 years’ worth of loans in just 14 days. With more applications still in the pipeline and more expected to follow, there is agreement that additional funds are needed but there is disagreement over where and how the money should be allocated. News reports continue to identify the important role small businesses play in our economy and that is emphasized by the statistic that companies with less than 500 employees equal 50% of the nation’s workforce while representing 44% of GDP. It is essential for these businesses to survive the current lockdown and be in position to resume trade so it is hoped that differences can be settled, and the program be reopened. Initial requests for an additional $250 billion have increased to $400 billion and there is optimism approval could be this week.
Economic reports continue to set records with unemployment claims over the last four weeks exceeding 22 million (previous four-week record was 2.7 million) and the recent Retail Sales report surpassing forecast at -8.7%. Industrial Production also topped consensus at -5.4%, and China’s contraction of 6.8% in the last quarter is its first official year-on-year decline in 40 years. With the US yet to peak with Covid-19 cases and China just emerging from its 73-day lockdown, it is possible their recovery might serve as a gauge to measure our response time. Their unemployment rate has declined slightly, and manufacturing has partially resumed; to be determined is whether or not they will have a global market with demand for its production.
Never Mind
Ignoring those weak economic reports stock markets continue to rally with the NASDAQ improved by 6% last week and 26% over the last four-weeks, leaving it just -3.6% ytd. While lacking that kind of strength the DJIA just completed its strongest two-week gain since 1938.
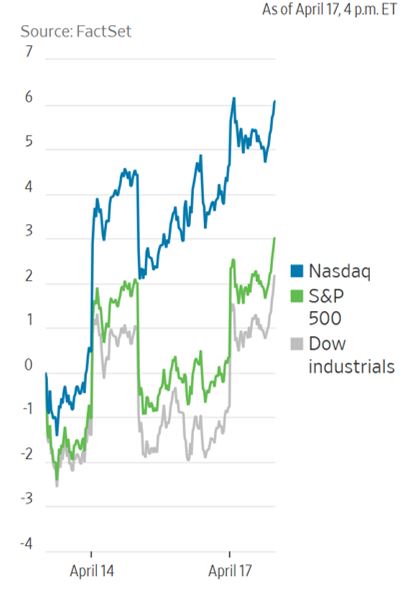
The rebound to offset the virus driven bear market has been swift as the Cboe Market Volatility Index (aka the fear index) has declined from its second highest reading ever of 85.47 a month ago to close at 38.06 Friday. It is clear that the market is ignoring the economy and placing its faith in a speedy recovery once states’ ease their lockdown restrictions. Driving this recovery is the massive intervention coordinated by the Federal Reserve Bank. Its impact has been felt not only in equities but has also stabilized various products in the debt market. Purchases of not only US Treasuries and Mortgage Backed securities but also Investment Grade corporate debt and now High Yield names has tightened their credit spreads and brought stability to those products. The ten-year Treasury benchmark rate declined 9 bps and closed at 0.64%, also 11 bps lower from when the 504 program priced its April debentures.
With retail sales, consumer confidence and corporate earnings all declining it might be asked just what is the market celebrating? Forecasts of a 25% decline in earnings and increased unemployment do not bode well for a desired V-shape recovery that stocks seem to be anticipating.
Lending hope for that was Boeing’s announcement that 27,000 workers are to resume work in Washington state this week, coming after President Trump encouraged governors to end restrictions by May 1, or earlier.
Fed Impact
Market stabilization was the Fed’s objective when it announced the various facilities to purchase product as wide ranging as Commercial Paper and Junk bonds, evidenced by it not buying as much as their announced purchase amounts and with credit spreads tighter, their plan is working. Rates for lower rated companies issuing three-month Commercial Paper have declined to 1.96% from 3.8% on March 19. Likewise, the Fed has not always accepted offers up to its announced purchase amount in Agency CMBS. Referencing a Financial Times headline “Don’t fight the Fed,” investors are reminded that fighting central banks is futile as we look forward to easy monetary policies and continued stimulus which seem to be the forces driving markets today.
The Week Ahead
No Fed speak as we enter the blackout period ahead of the April 28-29 FOMC meeting. Treasury plans to buy $75 billion Treasuries and up to $1.5 billion FNMA DUS and GN PL’s while selling just T-Bills out to a 52-week maturity.
Economic reports focus on housing and this week’s jobless claims with Durable Goods orders expected to decline 11% in March.
April 13, 2020
Rebound
Defying logic, and technical analysts, equities staged a weekly comeback not seen since 1974 as the DJIA gained 13% in a holiday shortened week. With death and despair prevalent and jobless claims exceeding 6 million for the second consecutive week, stock markets are betting more on Washington intervention than on the current disruption to global commerce.
Stock prices tend to be forward looking so perhaps it shouldn’t be surprising that some business sectors like cruise lines, hotels, and airlines that have suffered the most during this crisis were also the ones that performed best.
This WSJ chart shows the persistent gains that received help from the Federal Reserve Bank’s surprise announcement that it would commit an additional $2.3 trillion in lending to support small businesses, cities and states. The bank also expanded one of its facilities to include some lower rated corporate debt never before supported, names that are no longer investment grade like Ford.
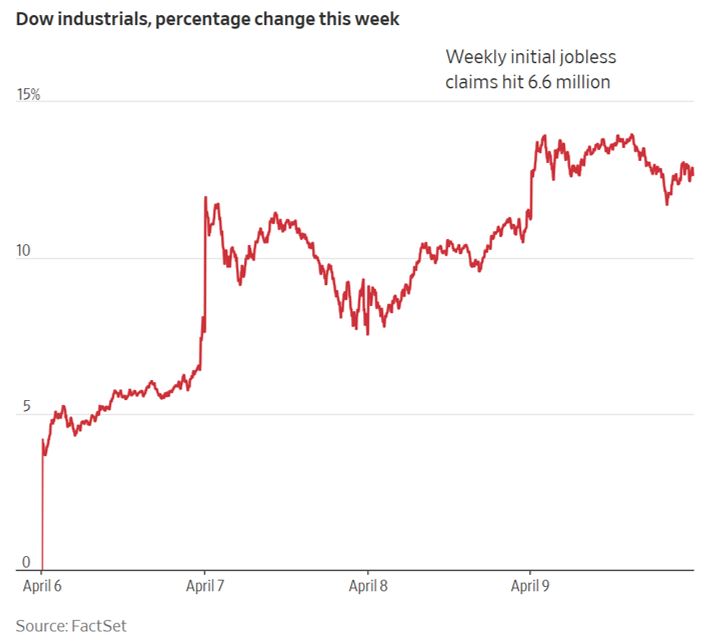
Rates
While the previously downtrodden stock market rallied Treasury rates eased back, still acting as a safe-haven instrument but also aware of how much money Treasury will need to print. After seeing spreads gap wider due to credit concerns, markets regained their equilibrium with the original Fed initiative and the TALF program’s expansion to include additional product which helped even more. The relative calmness that support provided was beneficial for the 504 program’s debenture sale that was well received by investors who participated in the largest monthly sale since July 2013 ($421,208,000). At 1.64% the 20-year issue was just 15 bps higher than in March which set the record for the lowest term rate in history. Most importantly, this month’s rate equates to an ongoing effective cost to small business borrowers of 2.96% while the larger 25-year maturity’s rate of 1.77% equals just 3.03%.
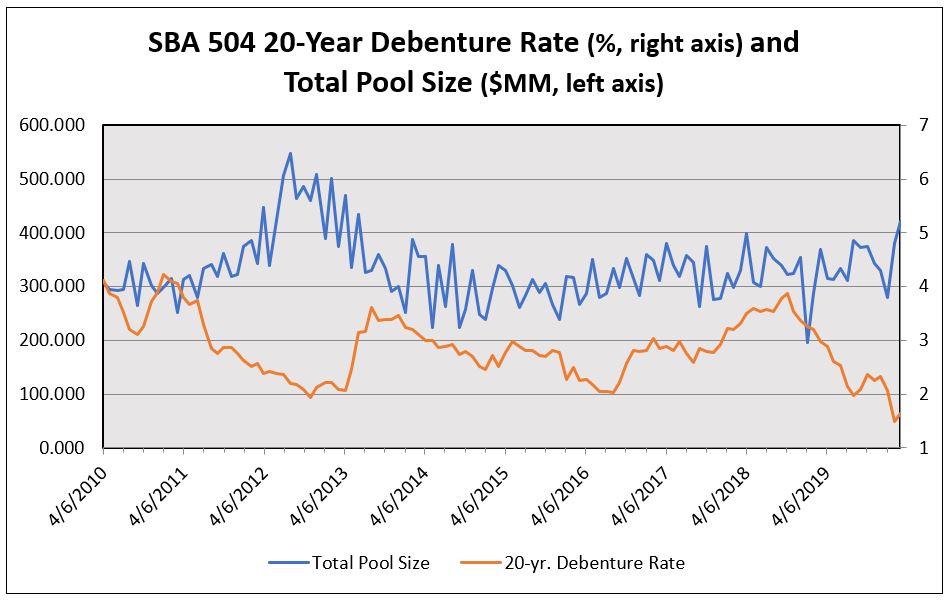
Further enhancing those terms is the combination of six-months debt forgiveness on existing currently serviced and future 504 loans plus an additional deferment option to sustain small business owners during this crisis.
Part of the CARES Act’s Small Business Debt Relief initiative administered by the Small Business Administration includes the Paycheck Protection Program that has generated an overwhelming response with at least 480,000 applications totaling $124 billion. The National Federation of Independent Business estimates that 3800 lending institutions are participating in this program for which Treasury is seeking an additional $250 billion.
Changed Roles
The Federal Reserve Bank, with no public health policy experience and with some restrictions on how it can lend money, has emerged as the catalyst for economic recovery by creating numerous facilities to support credit markets and that approach is open-ended. The minutes from the bank’s March meeting identified the cuts as a “forceful monetary approach” with solving the health crisis being the highest priority. In Thursday’s supplemental aid announcement, Chairman Powell admitted how the bank is remaking itself to keep intact the structure of an enfeebled economy and cautioned about returning to work too soon. As these facilities expand and the Treasury needs to fire up its printing press, Goldman Sachs has estimated America’s debt to gross national product will reach 99% this year and 108% next year. It was 79% last year and even with inflation at low levels investors will be looking at negative real returns on that increased amount of debt.
A contributing factor to equity weakness in March was the breakdown in OPEC+ negotiations that led Saudi Arabia to drastically boost production, driving down the price of oil at a time of limited demand. A weekend agreement to cut daily production by 9.7 million barrels was reached but its impact is slight since recent demand has fallen by even more than that amount.
The Week Ahead
Treasury auctions only T Bills and there is some scheduled Fed speak. Economic reports are old news, with the exception of Jobless claims on Thursday.
April 6, 2020
Decade of Job Growth Ends
Friday’s report of a loss of 710,000 jobs and an increase to the unemployment rate of 4.4% serves as a harbinger of what is to come as those numbers do not include the last two-weeks of March when layoffs accelerated. More than 10 million people have filed for unemployment benefits recently with 6.6 million applying for the first-time last week alone. This Financial Times chart shows the abruptness of job losses to the developing trend of 2009.
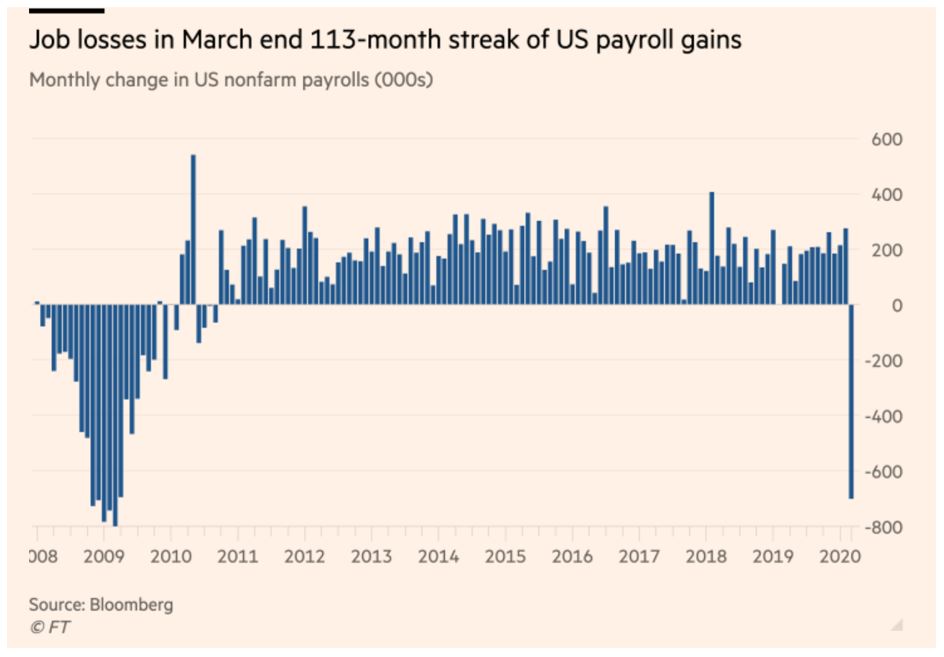
That report capped a week where domestic stock indices yo-yoed up and down 2-5% on a daily basis, ending the week down 3% while the flight to quality moved the ten-year Treasury benchmark down 9 bps on the week, ending at 0.60%. As much as that rate has come down, shorter-dated maturities (Treasury Bills with maturities out to one-year) have seen stronger demand with a late April maturity trading at -0.003%. This issue is part of a record amount of short-term debt sold by Treasury last week, $319 billion vs. the previous record of $190 billion set in October 2008. It can be expected demand for these shortest maturing safe-haven assets will remain strong, just as Fed buying of the longer maturing debt in unlimited amounts is helping to drive those rates lower.
As dire as these numbers are, the most chilling releases included confirmation of more than 312,000 Covid-19 cases domestically with 7,000 deaths. Health officials also announced the next two-weeks will be crucial to stem the pandemic as it expected both counts will rise dramatically.
Sharp Decline
Below is a WSJ chart that shows the dramatic decline in benchmark rates ytd. Expectations are for continued improvement during this crisis even as Treasury increases its funding plans for all maturities. In addition to the increased Bill issuance, increases in the three, ten and thirty-year auctions this week were also announced.
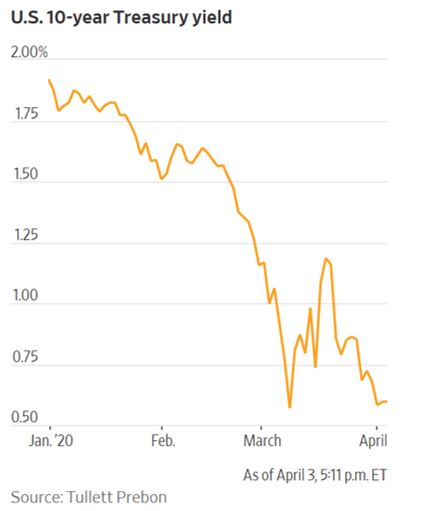
The impact of Treasury buying created a disconnect for credit product like Mortgage Backed securities where spreads widened dramatically until the Fed enhanced its buying program of Treasuries and MBS, while including Agency CMBS in the program. Further enhancing the operation was the re-introduction of TALF (Term Asset Backed Securities Loan Facility). This program was instrumental in unfreezing credit markets in 2009 by supporting issuance of asset-backed securities like the SBA 504 program’s DCPC’s. Under TALF 2.0 the Federal Reserve Bank of New York will lend up to $100 billion on a non-recourse basis to holders of certain AAA-rated ABS backed by newly and recently originated consumer and small business loans. That is especially timely as the 504 program approaches its April debenture sale this week with the benchmark Treasury note 34 bps lower than for its March sale while swap and credit spreads are both wider, but stable. Balancing the combination of those elements and barring unforeseen circumstances, the program can be expected to price at rates not too much higher than in March when financing rates were the lowest in program history.
To date, the FRB has purchased $4 billion Agency CMBS securities (FNM DUS, Freddie K-2, and GNPL’s) and announced auctions for an additional $4 billion this week.
Some Good News
- The Small Business Administration has gotten as much airtime as the Treasury Department for aiding during this crisis. Included in the CARES Act and part of the Small Business Debt Relief program are the Paycheck Protection Program that is being coordinated through its 7(a) program and the debt forgiveness for six-months of existing and future issuance (thru September) to be combined with deferments of payments that will give small business borrowers a chance to survive the crisis and rebuild once operations resume. SBA reported lenders received 17,000 PPP applications for $32 billion on its first day and because its scope is more expansive than traditional debt programs it will require modifications on the fly to insure availability of funds.
- Brent crude jumped 21% on Thursday (its largest one-day percentage gain ever) amid speculation Russia and Saudi Arabia might consider cuts to their increased production levels. This recent glut and resulting price war had driven prices down as much as 60% and added to pressure on energy stocks already at risk from the Covid-19 outbreak.
- It is now faint praise, but Friday’s jobs report included an increase in average hourly earnings to +0.4% and +3.1% y/y. Taken together with the previous week’s report of PCE increasing closer to the Fed’s inflation rate target of 2%, it would appear that Fed policy was on track.
- Like the average hourly earnings gain, both the ISM Manufacturing and non-Manufacturing reports were much stronger than forecast but will soon decline.
The Week Ahead
A light schedule for Fed and Treasury speakers but that will change. Treasury will sell $82 billion Notes/Bonds and as many as $239 billion T Bills with maturities from 4-weeks to 26-weeks. The SBA 504 program prices its 20 and 25-year April debentures on Thursday and economic reports focus on CPI and PPI.
March 30, 2020
Relief on the Way
On Friday President Trump signed into law a $2 trillion CARES law whose advent earlier in the week braked the stock market decline and then confirmed an extraordinary amount of aid and incentives for small businesses. Not only were planned deferments part of the package but an unprecedented scope of debt forgiveness by the Small Business Administration that will permit existing small business borrowers to join with new borrowers over the next six-months to have their principal, interest and fees forgiven by SBA.
In addition to the permanent suspension of interim measures, a $325 billion Payroll Protection Plan contains a debt forgiveness provision that will permit small businesses to borrow funds to maintain payroll as well as cover rent, utilities and other overhead expenses. In total, these and other measures will provide a bridge for businesses to withstand the economic downturn and we can expect an expansion of this bill to include aid for states whose revenue loss cannot be recouped.
This WSJ chart shows how the benchmark ten-year Treasury began the month at 1.17% as the market digested the amount of funding Treasury would need to fulfill the planned stimulus measures proposed by the government. Trading as low as 0.57% on March 9 when stocks first cratered and as high as 1.18% on March 18, it has since resumed its safe-haven status amidst the turbulence of global equity trading and credit risk. Of course, that status was enhanced by the Fed’s aggressive plan to buy Treasuries (later amended to buying an unlimited amount of them), while also purchasing lesser amounts of Mortgage Backed Securities, Commercial Paper and Corporate bonds through various facilities that it established. The Fed continued those buying operations last week in addition to supporting overnight and term financing operations. As part of its buying program, the Fed accepted offers Friday on $1 billion of FNMA DUS product which is traded in the Agency CMBS market, just like the 504 program’s DCPC’s. This inclusion has helped solidify liquidity and improve credit spreads in the sector.
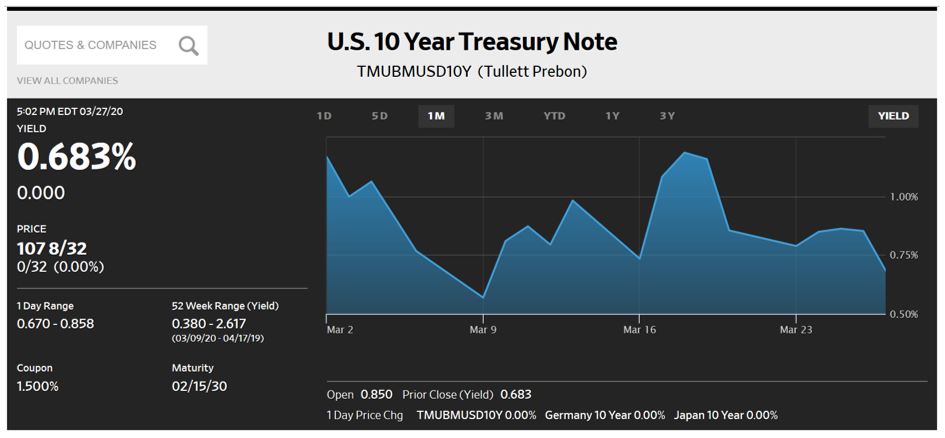
As volatile as the rates market has been, stocks have truly been on a roller-coaster ride with the DJIA showing a 13% gain on the week after absorbing a 4% decline Friday and starts the week down 20% year-to-date. As welcome and relieving as last week’s performance was, Friday’s decline is a reminder that investors seem prepared for another market dive with continued volatility.
In addition to the aid focused on small businesses, central bank activity has been the dynamic that has helped to settle most markets. This Bank of America Global Research chart shows the recent increase in the Federal Reserve Bank’s balance sheet and what it is expected to reach next year as the Fed pursues its “whatever it takes” stance to support credit markets.
Comparisons will be made to the Quantitative Easing program from the great financial crisis, yet this CARES Act at $2 trillion represents 10% of GDP and may be just the first of several aid packages.
With more than $127 billion in recent withdrawals from bond funds, the Fed’s support of dollar liquidity is crucial and a sense of normalcy in credit markets can relieve some pressure on equities.
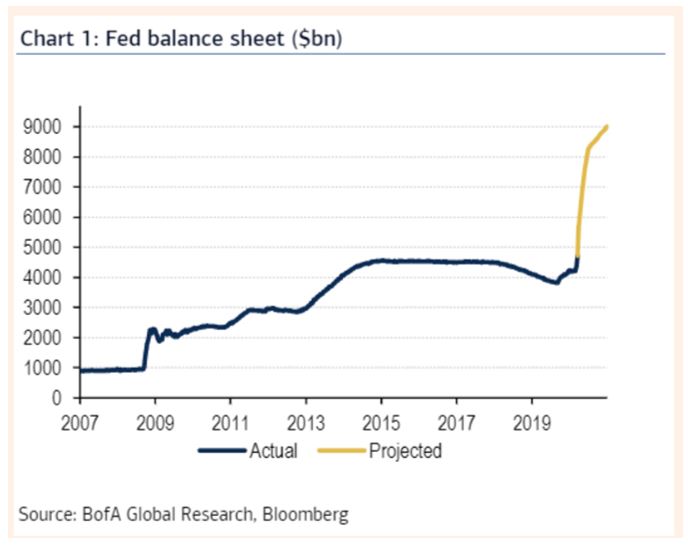
Economic Reports
It was mentioned last week that upcoming economic numbers will be unrecognizable and last Thursday’s jobless claims total of 3.3 million surpassed the forecast for 1.7 million and shattered the previous high of 695,000 in October 1982. 4Q2019 GDP estimate was affirmed as being 2.1% and that will shrink as the impact of supply chain disruption asserts itself. Even an improved core Personal Consumption Expenditure reading of 1.8% y/y showed signs of approaching the Fed’s target and can be discounted as consumer spending is unlikely to expand in the short-term.
Other items of interest were gold having its largest one-week gain in 12-years, oil gaining slightly but still below $30 a barrel, and the Cboe’s VIX (Volatility) Index softening a bit after rising for five consecutive weeks.
The Week Ahead
The 113 straight months of job gains that have produced 22 million new jobs should come to an end with Friday’s report and it is pointless to quote a forecast.
March 23, 2020
Equity Weakness & Credit Support
Last week saw increased central bank support for Treasuries, Mortgage Backed securities, money market funds and municipal securities. It also saw more states imposing shutdowns to cope with the spread of the Covid-19 virus. Of the above markets, only US Treasuries showed a gain with the ten-year benchmark closing at 0.89%, down 8 bps on the week but lower by 28 bps from its weakest post before the Fed bought $275 billion bonds as part of its announced plan to buy $500 billion over the coming months. Purchases of $32 billion MBS, part of its announced plan to buy $200 billion over time, did not have as much impact as all credit product widened on the week. With such aggressive intervention it would seem those total dollar amounts can now be considered minimum amounts as Chairman Jay Powell announced there is “no monthly cap, no weekly cap, as the bank will buy at a strong rate that we think will restore market function”. Of additional help to corporations is a $1.1 trillion lending facility to unclog the Commercial Paper market where companies make short-term loans.
The Fed is not authorized to directly buy Municipal or Corporate securities but is permitted to create lending facilities that lend money with those securities as collateral and that is what they did as municipal and corporate bond funds saw heavy withdrawals last week. Like the Fed’s intent to support Treasury and MBS markets, it is likely these other facilities will be expanded to provide additional support as they have the greatest need. The average yield for investment grade corporate debt has risen from a year-to-date low of 2.26% two-weeks ago to 4.7% on Friday. For higher-risk junk companies, whose securities cannot be used for collateral, the damage is harsher as average yields have spiked as high as 10%. Even the MBS market, considered the second most liquid market after Treasuries, suffered from selling to raise cash as spreads widened to 130 bps from +44 bps a month ago.
The week’s performance for the S&P 500 index unfortunately ranks high in historical performance, down 15% for the week and now down 29% year-to-date. For a brief time on Friday it appeared the index might register its second consecutive up day for the first time in five weeks, but that failed as the market reversed and the index closed down 4%.
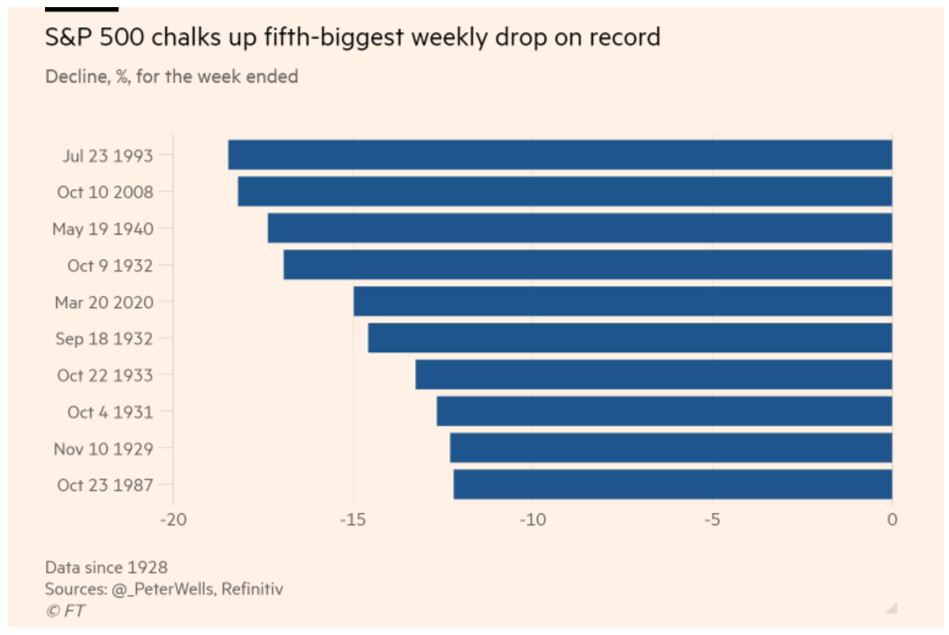
Demand for US$
The selling pressure in these markets reflects investor demand for cash, not even traditional safe-haven assets like Treasuries and gold, just as foreign countries seek US$ to relieve pressure on their currencies and economies. One reason why Fed intervention to buy Treasuries has been needed when rates backed up is the expected increased government funding needs to sponsor the stimulus packages. White House economic advisor Larry Kudlow was quoted as saying the money the Fed will spend to support loans and other programs will have a total impact of more than $2 trillion and daily updates indicate that will climb higher.
What is needed in addition to progress fighting the virus is a respite from the selling pressure in securities markets and less demand for product being hoarded on the consumer side.
Measures that have been established to date are significant and can be expected to be increased:
- The Fed lowered its band for fed funds to 0-0.25%
- $500 billion program to buy US Treasuries and $200 billion Mortgage Backed securities and this morning announced they would make bond purchases “in the amount needed” to support the markets. Included in this morning’s announcement are platforms to support corporate bonds as well as re-introducing a Term Asset-Backed Securities Loan Facility (TALF) like during the financial crisis. This facility will enable the issuance of asset-backed securities backed by student loans, credit card loans, and loans backed by the Small Business Administration, like SBAP’s.
- As part of the Coronavirus Small Business Guidance & Loan Resources program the Economic Injury Disaster Loan Program will make loans of up to $2 million to provide working capital for small businesses which President Trump has identified as “the economic engine of our economy”. On Thursday the Congressional Small Business Task Force proposed a $300 million platform for loans to be coordinated by the SBA 7(a) program. Small businesses could use this Emergency Coronavirus Relief Package or the EIDL program, but not both.
- An $800 million lending facility for money market mutual funds to be managed through the Federal Reserve Bank of Boston
- A Primary Dealer Credit Facility with loans up to 90-days collateralized by approved securities
- A $1.1 trillion facility for Commercial Paper to facilitate short-term financing for corporations
- Expansion of a swaps line with five central banks to improve US$ liquidity daily, rather than weekly
- A proposed stimulus package of as much as $1.8 trillion to include small business retention loans (that could be forgiven), direct deposits to workers, and/or an extension for unemployment benefits failed to get the necessary 60 votes to pass on Sunday. Industry specific aid appears to be a stumbling block for Democrats who want aid directed mostly to individuals. Depending on final negotiations it is hoped that legislation is passed today.
These proposals are viewed as a bridge to survive the crisis and help markets settle down. Other bridges that are more immediate can be found within SBA loan programs when lenders take the initiative to help small business borrowers, like in the WSJ article linked below.
In the absence of the stimulus plan, the Federal Reserve Bank announcement about increased bond purchases plus the TALF program has resulted in a 1,000-point reversal for equity futures and pushed Treasury rates lower.
The Weeks Ahead
The cost of these programs is significant, matching their need and that need will increase. Economic reports will have little positive impact on market performance as data in the near future will be unrecognizable.
March 16, 2020
An Historic Week
Not waiting for their scheduled meeting to act, the FOMC reduced its target for federal funds Sunday afternoon by 100 bps to a range of 0-0.25%, revisiting its mark from after the financial markets collapse. Also announced were plans to buy huge amounts of Treasuries and Mortgage Backed securities “over coming months”; $500 billion of Treasuries and $200 billion Mortgage Backed securities. This will bring the overnight financing rate for institutional investors to positive levels, giving strength to the Treasury market which wobbled last week.
The Fed also encouraged banks to use its discount window, another source of ready access to financing and said it was “encouraging banks to use their capital and liquidity buffers as they lend to households and businesses.” Eliminating bank reserve requirements is another measure to free up cash for the banks to keep lending.
As well received as these measures were upon their announcement (described by some analysts as the Fed bringing out its heavy artillery), markets themselves are the final arbiter and their response has been disappointing. The ten-year benchmark did improve to trade at 0.78%, down 20 bps from Friday’s close, but futures markets for domestic stocks indicate a decline of almost 5% at the opening. Oil is down 10% as the Saudi Arabia price war continues; energy companies, airlines, and hotels are all down similarly as they are most vulnerable to the travel bans and social distancing that is being imposed.
What began as a virus inspired supply chain disruption in China has morphed to demand constriction that is starting to show cracks in the financial markets. With travel bans, work from home initiatives, and social distancing already having an impact on consumer spending, the impact on economies is being felt and the need for fiscal stimulus in addition to monetary aid is needed. With states now closing restaurants and bars, it is clear that businesses and workers of those establishments will need financial aid and the Coronavirus Preparedness and Response Supplemental Appropriations Act recently signed by the President will provide vital economic support to small businesses. Loans up to $2 million to compensate for the temporary loss of revenue will be offered at rates of 3.75%, 2.75% if for a non-profit, and reflects how quickly the Small Business Administration can be mobilized to provide aid.
Stocks
Frequent mention has been made to price action from the financial crisis in 2008 and Black Monday in 1987 as equities experienced both the biggest single day percentage decline since 1987 and the single largest one-day rally since 2008 – occurring on consecutive days late in the week when Friday’s rebound almost offset Thursday’s total decline of 10%.
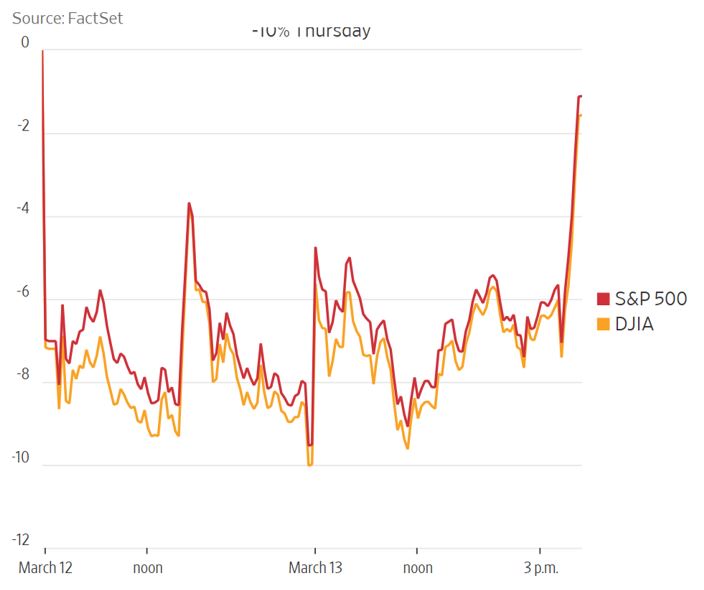
Spurring Friday’s late afternoon recovery was President Trump’s declaration of a National emergency that includes waiving interest payments on student loans held by the federal government, buying oil to fill the strategic reserve, plus freeing up an additional $50 billion in aid. An agreement with Congress on a coronavirus relief package that was approved by the House after midnight Friday will be voted on by the Senate this week.
In another Sunday announcement, a trade group representing eight of the nation’s largest banks will suspend share buybacks and use such funds to provide maximum support to individuals, small businesses and the overall economy. Access to loans is key yet it does represent more debt for companies lacking a revenue stream.
Rates and the Fed
Acting off-cycle for the second time in two weeks, the Fed has already responded to price action in the Treasury market last week. The swing in benchmark Treasuries has been problematic as their performance contradicts their assumed safe-haven status during a crisis such as this with back-end rates rising on the week and the curve (2-year/10year rates) steepening by 23 bps. One indication of their swing is CT-10 finished the week at 0.98% after trading as low as 0.31% on Monday. Since the March debenture sales for the SBA 504 program were priced off a CT-10 rate of 0.94% it might look like there has been little change, but another impact in addition to its underperformance has been on credit spreads which have widened out in sympathy with higher Treasury rates.
There can be several explanations for the disappointing performance of Treasuries, ranging from basis trades (cash vs. futures contracts) and risk-parity trades (allocation of risk based on volatility) being unwound, as well as risk managers just directing traders to reduce risk and close out other relative value trades.
The Mortgage Backed Securities market, considered the second most active after US Treasuries, also underperformed as mortgage rates initially declined in sync with lower Treasury rates only to see the housing refinance market light up with demand. That devalued existing MBS product (the underlying mortgages that comprise the securities) forcing dealers to reduce price on inventory thereby raising mortgage rates greater than the rise in Treasury rates. 30-year mortgages that might have been offered as low as 3.25% one week ago are now offered close to 4%.
An indication of how aggressively the Fed put to use some of its new tools occurred Friday morning when it purchased $37 billion of Treasury debt, more than half the intended purchase amount ($60 billion) that was expected to occur out to April 13. Additionally, the Fed is providing massive liquidity support to banks by increasing the size of short-term financing with up to $1.5 trillion available out to three-months. This provides funds at appropriate rates for firms inventorying securities and reduces stress in the financing market. Complimenting both of those initiatives was Sunday’s announcement from the Fed which vowed to use its “full range of tools” to support the economy and the “smooth functioning of markets.”
March Sadness
Once the dominoes began to fall Wednesday night when the NBA postponed its games for at least 30-days other professional sports followed suit. Two of the most popular Spring events, the NCAA basketball tournament was cancelled, and the Masters golf tournament was postponed, probably until October. Any hope that sports might provide some emotional relief from this pandemic is gone.
The Week(s) Ahead
A light week for economic reports and Treasury issuance, and with the Fed having already announced its rate cut, attention will focus on additional comments from their Tuesday-Wednesday policy meeting. Authorities have cautioned things will get worse before getting better so we can expect continued volatility as we all deal with managing this crisis.
Wednesday – FOMC meeting concludes with a policy announcement, followed at 2:30 with a press conference with the Chairman, Jay Powell.
March 9, 2020
*** A Monday morning update to the commentary shows a dramatic drop in oil prices engineered by Saudi Arabia that sent global equity markets sharply lower, along with Treasury yields, as the entire curve is sub 1%. Domestic equity markets are bumping up against 5% down limits, oil is lower as much as 30%, and the ten-year benchmark Note is 0.42%, 52 bps lower than when the 504 program priced its March debentures last Thursday.
As Steve mentioned last week, we can expect more interest rate cuts, volatility, wider spreads and demand for US Treasuries. Ordinarily, low interest rates and cheap oil are a boon for economies, but it is rare to see a demand collapse coincide with a supply surge. Until this coronavirus is brought under control, markets will remain disrupted.
Historic Lows
Led by price action that compelled the Federal Reserve Bank to reduce its interest rate target by 50 bps ahead of its planned March 17-18 meeting, benchmark Treasuries closed the week at their lowest rates in history. Much of the entire curve is sub 1% with the benchmark ten-year Note at 0.76%. That level represents a 48 bps decline on the week and a 116 bps decline year-to-date. Of most importance to the SBA 504 program was its pricing of March debentures, also at historic low rates. This chart shows the 20-year maturity pricing of 1.49%, shattering the previous low rate of 1.93% set back in December 2012. Additionally, at $379,573,000 the total March sale was $45 million above the previous 12-month average.

In last week’s commentary Steve Van Order identified the probability of:
- Interest rate cuts
- Increased price volatility
- Wider credit spreads to Treasuries
All three happened quickly before he priced Thursday’s debenture sale and his reference to banks being short duration added fuel to the rate decline as they needed to hedge their liabilities and will continue to chase Treasuries should rates decline further. As unconventional as the Fed’s aggressive inter-meeting rate reduction was, the market expects another 25 bps move by the end of next week’s scheduled meeting.
Benefit of Fixed Rate Financing
As important as the low debenture rates are, the ongoing effective rate cost to small business borrowers is even more impressive in this low interest rate environment.
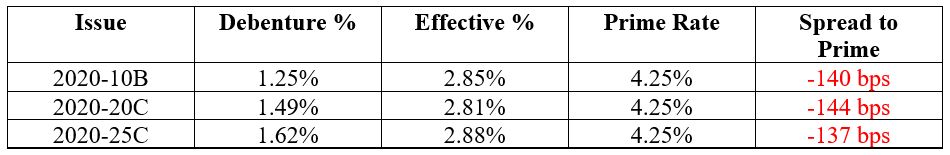
Supply Chain
Just like bank demand for duration to offset refinanced mortgages is linked to their demand for Treasury debt, so too is China’s import/export relationship linked with the global economy. For the January-February period their exports declined 17.2%, leaving them with a trade deficit of $7.1 billion for the period. The decline in imports was just 4%, meaning there is a supply shock from the lunar new year holiday coupled with the coronavirus impact. The shutdown of factories, ports and cities is spreading globally as Italy announced a planned lockdown of Lombardy, its northern industrial region responsible for 50% of the country’s GDP and home to 16 million people. The widening impact of the spreading virus has already resulted in the IMF lowering its global economic forecast to 1% from 2.6%. Adding to global concerns is a rift in the Opec+ Alliance that developed when Russia refused Saudi Arabia’s initiative to cut production in order to maintain price stability.
Volatility
A 48 bps weekly decline in Treasury rates is stunning and equity markets had their share of volatility too. Market records have been falling like dominoes as the Dow Jones industrial average had both its biggest single day decline of 1,191 on February 27 and gain of 1,294 on March 2. Bank, energy, hotel and airline stocks have suffered the most as companies encourage employees to work from home or alternate sites and events are being postponed or cancelled outright. Such restrictions on business activity and social gatherings is restrictive and linked to consumer spending which is a significant part of our economy.
The sharp 12% equity decline from their February 19 highs is what triggered demand for safe-haven assets like Treasuries and gold, so containment of the virus is crucial in order for global economies to return to normal. How long that takes will determine how much pressure stocks face and what that impact will be on rates and central bank policy decisions.
Jobs and the Economy
Friday’s jobs report exceeded expectations but was dismissed as data predating the impact of the coronavirus. 273,000 jobs were added with 85,000 added to previous totals, the unemployment rate dropped to 3.5%, and earnings increased 0.3%. Average monthly gains for the last six months were 231,000 vs. 171,000 for the preceding six months, reflecting a solid if not expanding economy.
The Week Ahead
A blackout period for Fed speak ahead of their March 17-18 meeting, a light economic report calendar and the quarterly refunding Treasury supply.
Monday – Treasury auctions 13 and 26-week Bills
Tuesday – 3-year Note auction
Wednesday – CPI and 10-year Note auction
Thursday – PPI and 30-year Bond auction
March 3, 2020
The Virus Spreads Further, the Risk Markets Totally Crack
Last Monday, Eagle’s Frank Keane commented “On balance, it is impressive that equity markets have not suffered more than they have, but with reports of more contagion and increasing deaths it is likely its full impact has not been felt.” All we can say this week in response to Frank’s timely comment is “and how.”
Last week the equity markets completed the fastest correction of at least 10% in many years. Commodity prices again fell sharply. Gold, haven currencies, and government bonds rallied. After touching 1.11%, the 10-year Treasury note yield settled the week at a record low of 1.14%. Since the last SBA 504 debenture deal pricing on February 6, that yield has fallen over half a percentage point. The monthly range chart of the 10-year note yield since 2001, seen below, shows a sharp and stunning drop to the bottom of the rolling 20-month volatility band. The sharp move coming off an already low yield forced short covering and mortgage hedgers to buy duration, accelerating the move lower. Banks appear to still be short a massive amount of duration per a recent J.P. Morgan survey. This should cushion any yield rebound.
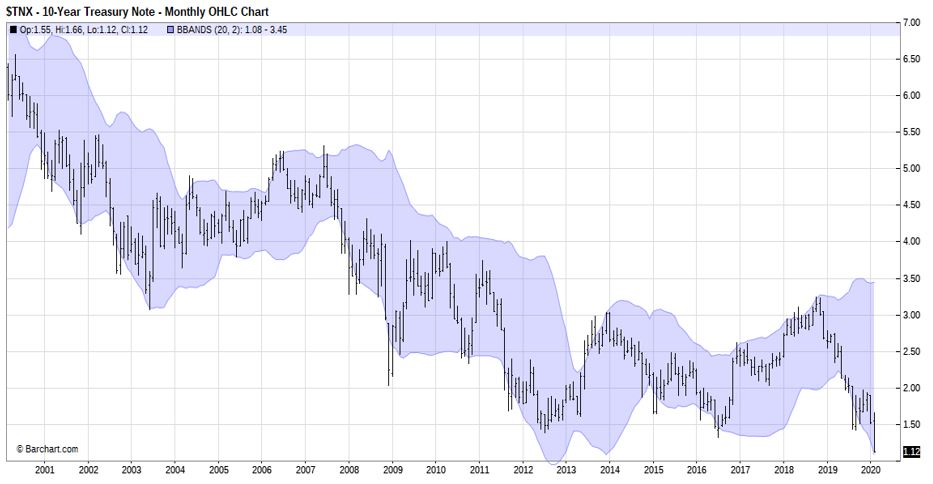
We will not get into a detailed discussion of the headline equity markets because investment managers and the news media covered it in quite some detail. What we look at this week are some aspects of the credit markets that are helpful in describing the new market environment we find ourselves in as we enter the March debenture offering.
Much higher probability of Fed rate cuts. Fed Chairman Powell’s brief statement Friday, in light of the sharp sell-off in financial and commodity markets and expected shock to global industrial production, resulted in markets pricing in certainty of a ¼ point, and a nearly 3-in-4 chance of a ½ point rate cut at the March 17-18 meeting. The other major central banks have indicated that easing is clearly on the table. Central banks are concerned about a demand shock arising out of 1) virus fears dampening the “animal spirits” and 2) supply shock-driven disruption to output, corporate earnings and hours worked. The market-implied Fed funds rate for the end of this year was 0.83% on Friday, which compared with the current policy target rate range of 1.50% to 1.75%. Not too long ago, the Fed communicated that it would be on the sidelines for the foreseeable future.
Higher expected interest rate volatility. We can see in the chart below, expected interest rate volatility in the Treasury market increased sharply (the MOVE index for Treasuries is similar to the VIX index for equities). As well, the term structure of interest rate volatility inverted, signaling that the market expects higher volatility in the shorter run before settling down to higher levels than experienced in the low volatility cycle that just ended.
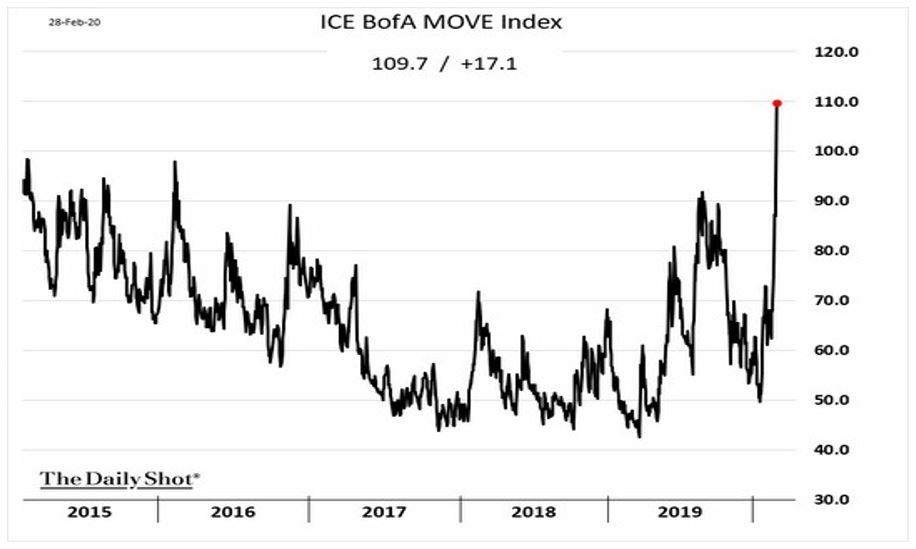
More U-shaped yield curve. As we can see in the chart below (using Thursday’s close), yields collapsed in the belly of the yield curve, which is the area of the curve most sensitive to the change in Fed policy expectations. Short-term Treasury bills remain stuck more to the current Fed funds rate. Longer term maturities fell quite a bit, but not as much as in the belly of the curve.
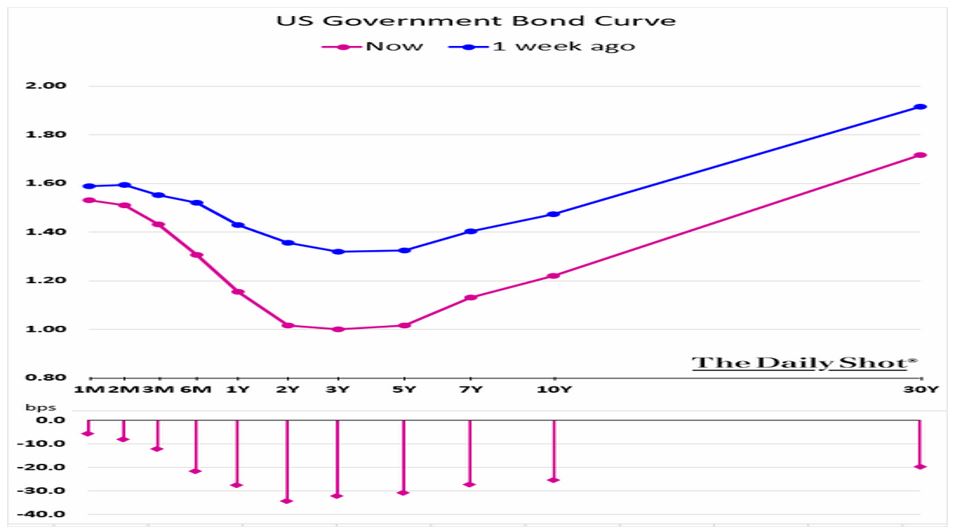
Wider spreads to Treasuries. As is to be expected in times of market turmoil, credit spreads have widened, approximately 20 basis points for investment grade corporate credit and 75 basis points for high yield bonds since the last SBA debenture pricing on February 6. Spreads on government-guaranteed securities with embedded prepayment options, such as nominal coupon MBS and SBA 504 debenture pools, have widened as lower interest rates lower the threshold for prepayment. In addition, at times like this, spreads widen on all bond market securities, to varying degrees, because of the liquidity preference for Treasuries during a flight to safety.
As we bring the March SBA debenture offering to market this week, while the recent moves in the markets have been sharp, and in some cases nearly unprecedented over such a short time frame, and conditions sloppy, feedback we've received from underwriters is that the markets remain orderly. Full faith and credit securities, such as SBA 504 pools, typically perform relatively better in these environments. Given how fluid the situation is with the spread of the virus and fragile risk market psychology, amid what will be updated projections on the impact all this could have on the global economy, the clearest thing to expect for this week is the potential for more interest rate volatility
The Week Ahead – Main Releases and Events
Monday – ISM manufacturing for Feb. Treasury auctions bills
Tuesday – SBA 504 debenture offering announcement
Wednesday – ADP employment report, Fed Beige book
Thursday – SBA 504 prices. Productivity, ULC for Q4, factory orders for Jan. Treasury auctions bills
Friday – Employment Situation for Feb
February 24, 2020
The Virus Spreads
Stocks and interest rates dropped as more signs of the coronavirus affecting economic growth surfaced.
- A loss of $29 billion in airline revenue
- China, the world’s largest car market, reports auto sales might decline by as much as $92 billion
- Procter & Gamble reports disruptions for 387 of its China based suppliers
- Apple and a big part of its supply chain, Foxconn, both report revenue is taking a hit
- The yield on the 30-year Treasury bond hit a record low of 1.89% leading Black Rock, the world’s biggest asset manager, to sell some of its long-dated securities. Per Rick Rieder, its Chief Investment Officer, current low yields “are not anywhere close to fundamentally correct.” That said, Mr. Rieder admits that does not mean they can’t stay here or go even lower
***And go lower they did as the ten-year benchmark is trading at 1.38% this morning as global equity markets have sold off sharply after Italy joined South Korea in locking down cities due to the spreading virus.
Surprisingly, with this virus entering its second month domestic stock indices suffered their first weekly loss of the year as all three were lower by more than 1% with the tech heavy Nasdaq Composite down 1.8%.
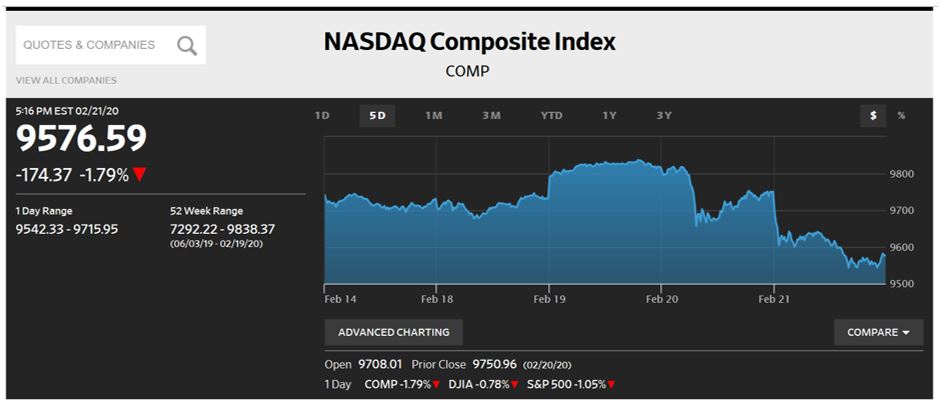
A Financial Times article reports that signs of complacency abound, citing a Bank of America global survey of fund managers that reports cash comprises just 4% of portfolios, the smallest amount since March 2013. When investors are worried, they usually hold more cash, instead they have been putting it into global equities that recently hit record highs. Even with last week’s selloff domestic markets are still +3% ytd.
Even though volatility has remained low, the benchmark 10-year Treasury rate has declined 45 bps this year, closing the week at 1.475% (as shown in the WSJ chart below), 22 bps lower than when the SBA 504 program priced this month’s debentures on February 6th.
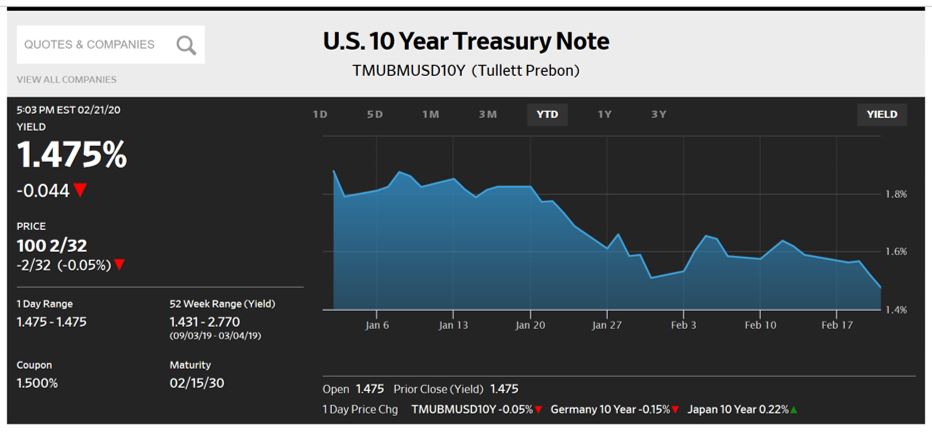
Last year’s decline in rates was driven by Fed rate cuts and recessionary fears over US-China trade tension while this year’s performance has been accelerated by fear of the virus’ economic impact, leading analysts to expect at least one rate cut this year. Whether or not such action is taken, Fed Governor Lael Brainard noted “now is the time for lawmakers to undertake a review of tools and strategies to ensure they are ready and effective.” That echoes the call of others seeking fiscal policy initiatives that would complement monetary policy which is limited by how low rates are already.
On balance, it is impressive that equity markets have not suffered more than they have, but with reports of more contagion and increasing deaths it is likely its full impact has not been felt.
The Week in Review
Economic news last week was fairly dismal:
- Japan’s economy contracted at an annualized rate of 6.3%, putting it technically in recession
- Germany’s Bundesbank warned it sees no sign of improvement in its outlook for 1Q2020 and called on the government to spend its large surplus, a fiscal tool endorsed by Governor Brainard though the US is hampered by a deficit
- Minutes from the Fed’s January 28-29 meeting showed comfort with the economy, but the virus outbreak had just begun at that time
- Purchasing Managers Index Composite Flash disappointed, coming in below consensus
- Leading Indicators did provide some relief, above consensus at +0.8%
The Week Ahead
Treasury to sell $241 billion, some Fed speak, a light economic calendar but with the Fed’s preferred inflation gauge.
Monday – Treasury to sell $84 billion 13 and 26- week Bills
Tuesday – Treasury sells $26 billion 52-week Bills and $40 billion 2-year Notes
Wednesday – Treasury sells $18 billion 23-month Floating Rate Notes and $41 billion 5-year Notes
Thursday – Treasury sells $32 billion 7-year Notes; second estimate 4Q19GDP expected to be 2.1%; Durable Goods expected to be -0.9%
Friday – Personal Income & Outlays; Personal Income expected to be +0.3%, core Personal Expenditures +0.2% with a range of +1.6-1.8% y/y
February 18, 2020
Still Immune?
Even as the number of people affected by the coronavirus rises, so do domestic stock indices, up 1% on the week and setting record highs amid concern over the potential impact on global trade. With more than 67,000 cases reported in China alone, and a death toll of more than 1,700, the first death in Europe has been recorded. While the safe-haven Treasury trade paused with the ten-year benchmark flat on the week at 1.59%, the Treasury did sell $19 billion of 30-year debt at a record low yield of 2.06%. Fixed income mutual funds and exchange traded funds took in $23.6 billion last week with US funds accounting for $15.4 billion of that total.
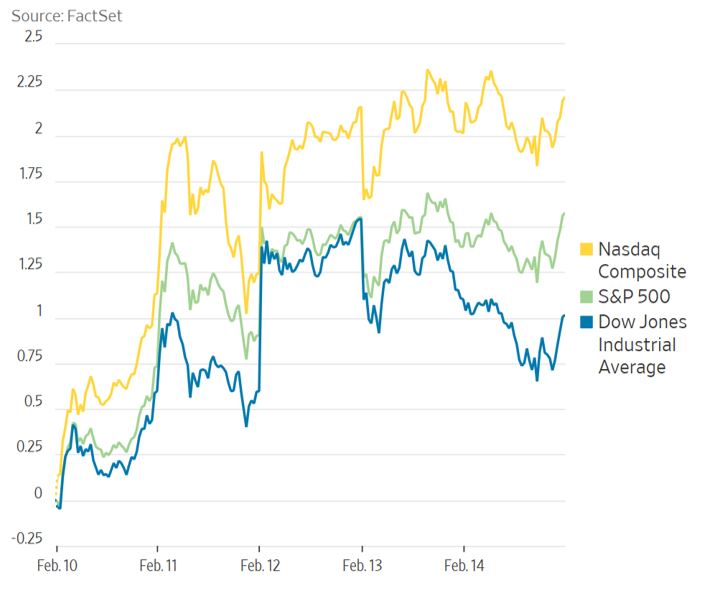
Economy in Quarantine
In China the epidemic is hitting a growing list of companies, disrupting supply chains and reducing consumer demand as many analysts ask – how much of an effect will it have on global economies and equity markets? With an economy that is four times larger than it was during the SARS outbreak eighteen years ago, any continued shutdown in China will weaken its growth, lower Chinese tourist spending and lower Chinese goods imports. To stem the previous week’s equity decline, China has announced substantial fiscal stimulus that offset last week’s slump. In his Congressional testimony Jay Powell noted the US is “closely monitoring the emergence of the coronavirus which could lead to disruptions in China that spillover to the rest of the global economy.”
An indication of what that impact might be is indicated below in this Financial Times chart and supports market beliefs the Fed may resume cutting interest rates this year.
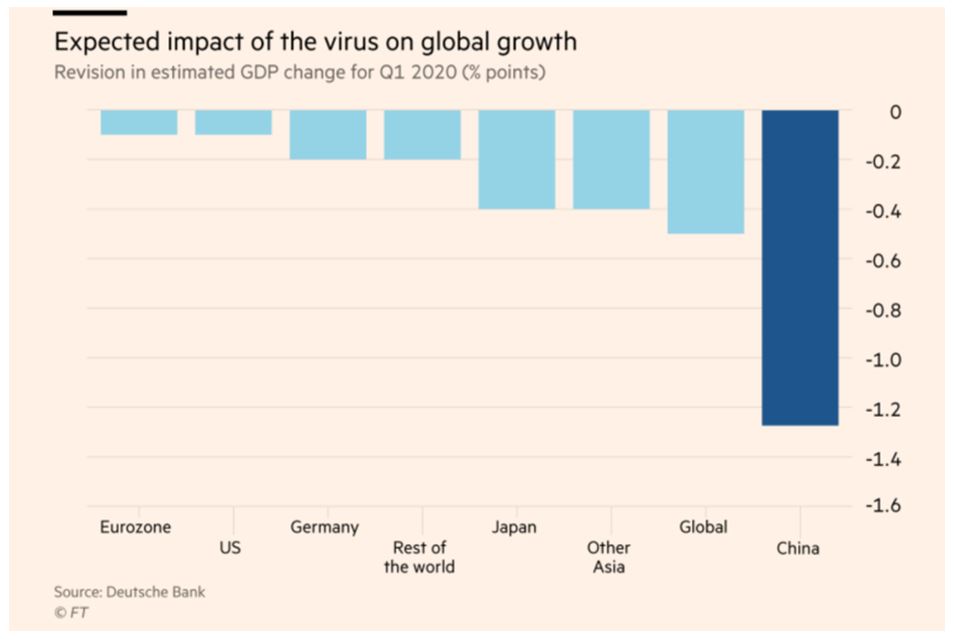
In other events last week, Retail Sales (+0.3%) and CPI (+0.2%) came in as expected and the President proposed an increased tariff on plane imports from the European Union.
The Week Ahead
Treasury sells $132 billion in debt, Fed speak, some housing data and economic reports.
Tuesday – Treasury auctions $40 billion 21-day Cash Management Bills and $84 billion in 13 and 26-week Bills
Wednesday – PPI expected to be +0.1%
Thursday – Leading Indicators forecast to be +0.3%; Treasury sells $8 billion 30-year TIPS
Friday – PMI Composite Flash expected to be flat
February 10, 2020
Stocks Show Immunity
In a week that saw the coronavirus death count exceed 800, stock indexes had their best week since June as the safe-haven trade lost momentum though it recovered a bit on Friday with weak manufacturing data from Europe. China’s central bank pumped cash into its market helping to calm worries and then the government announced it would halve tariffs on some US imports, both events helping investors think containment is possible even as more countries try to isolate themselves from Chinese interaction. Leading the equity surge was Tesla, up 20% on Tuesday alone as its market value reached $130 billion, more than that of GM, Ford and Fiat Chrysler combined. This performance continues to catch many investors offsides as it is speculated that short sellers have lost $11 billion betting against the company.
As impressive as overall equity performance has been during this crisis, it is important that it not escalate further so that businesses can reopen shortly to resume economic activity.
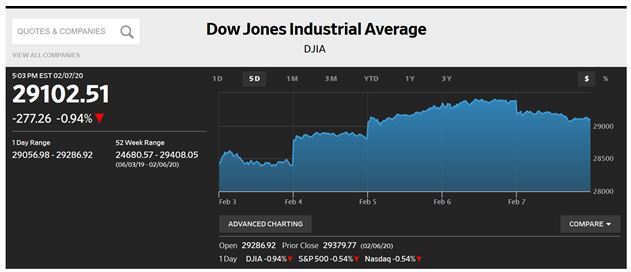
One sector that is not seeing much love is commodities, as energy stocks are down 20% since last April and Brent crude is down 12% this year alone. Consumer demand and rising wages are driving our economy, but the retail trade still seeks its footing. Macy’s announced it is cutting 2,000 management jobs and closing 125 stores as mall traffic continues to decline.
Equity weakness on Friday seemingly ignored that morning’s jobs gain of 225,000, well above consensus and the 175,000 monthly average for all of last year. While the Unemployment rate ticked up to 3.6%, the amount of job seekers increased and the average hourly earnings rate of 3.1% also showed a y/y increase.
This report should give the FOMC comfort that its wait and see approach to monetary policy is justified even as the market seems to expect at least one rate cut this year.
On Thursday the SBA 504 program saw its 20 and 25-year debenture rates decline 25 bps from January levels, benefitting from the recent flight to quality. Continued demand for high quality assets helped tighten their financing spreads by 4 bps with both issues strongly over-subscribed. At debenture rates of 2.07% and 2.20% these debentures provide small business borrowers with ongoing cost of funds of 3.39% and 3.46% respectively. Both levels are significantly lower than Prime Rate and offer attractive alternatives to adjustable rate loans which use that marker for a base rate.
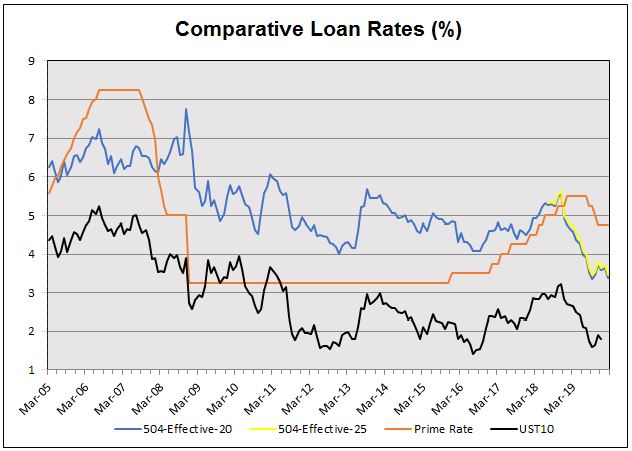
Treasury confirmed it would reintroduce a 20-year maturity later this year, using a quarterly schedule of sales along with Treasury Inflation Protected Securities. Initial size would be $10-$13 billion with subsequent sales slightly smaller. This structure was discontinued in 1986 when its financing cost exceeded that of both the 10 and 30-year issues.
In another move to separate funding from LIBOR (London Interbank Offered Rate) Treasury announced interest in offering a Floating Rate Note based on its preferred alternative, SOFR (Secured Overnight Financing Rate), a system using pledged Treasury collateral.
The Week Ahead
Treasury to sell $198 billion in debt, Jay Powell provides semi-annual testimony before Congress, and some inflation and consumer data.
Monday – Treasury auctions $84 billion 13 and 26-weeek Bills; Pitchers and Catchers report
Tuesday – Treasury sells $30 billion 56-week Cash Management Bills and $38 billion 3-year Notes; Jay Powell speaks before Congress
Wednesday – SBA 504 program funds its February debenture sales; Treasury sells $27 billion 10-year Notes; Jay Powell speaks before Congress
Thursday – CPI ex food & energy expected to be +0.2% and +2.2% y/y; Treasury sells $19 billion 30-year Bonds
Friday – Industrial Production expected to be flat to -0.3%; Retail Sales expected to continue its recent history of 0.3% gains
February 3, 2020
The Infection Worsens
Add the negative impact of the coronavirus to existing tariff induced trade tensions as a reason for global growth concerns. With the Chinese death count rising, expansion of the isolation zone around Wuhan, and many businesses closing their doors the impact on the Chinese economy is being felt. And, by extension, its impact on the global economy as worldwide supply chains have been disrupted causing commodity prices to drop sharply.
This WSJ chart shows investors’ flight to quality as the benchmark ten-year Treasury continued its rally, now down 41 bps in rate since the start of the year.
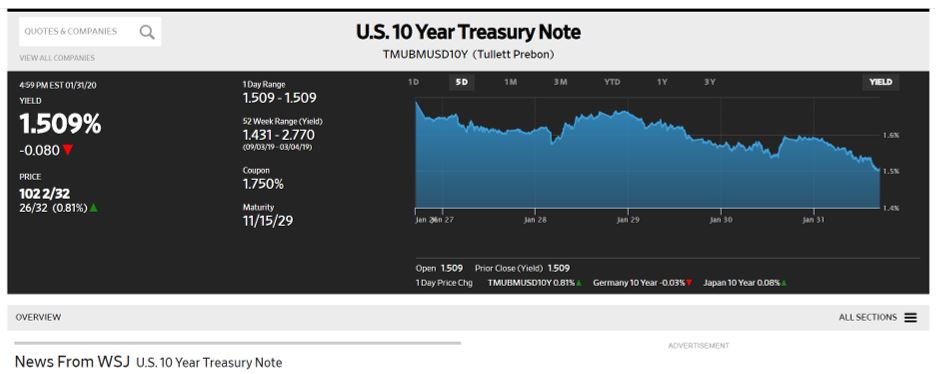
Since sharp rate declines don’t coincide with equity strength, this virus outbreak has seen global stock markets surrender their previously robust gains, with domestic indices down more than 3% from the January 17 record highs. With Chinese stock markets closed since January 23, their reopening Monday could reinforce safe-haven trading as related markets like Hong Kong’s Chinese stocks have already declined 6.7% last week, their worst performance in two-years. In advance of the domestic stock markets re-opening, the government has pledged $22 billion in financial market support, something that might pump the brakes on markets that have remained open but can only help to limit some pressure on Chinese markets whose Shanghai Composite did fall 8.4% today.
What Else Happened?
Not to be overlooked were two significant events that occurred within one hour of each other on Friday evening – the failure of a Senate proposal to call more witnesses in President Trump’s impeachment, virtually assuring his acquittal, and the formal departure of the United Kingdom from the European Union. The former will become a contentious issue in the presidential campaign while the latter simply sets the stage for terms that need to be finalized by December 31st as Britain is pleased to regain its individual identity while it may remain subject to EU trade terms even though it no longer has a place at the table.
In other market related events, the Fed announced no change in policy while noting that household spending is viewed as moderate rather than previously described as strong in its December release. Affirming that description was Friday’s release of Personal Consumption & Expenditures showing a 4% gain in household spending, its smallest since 2016. Part of that report showed Personal Income at +0.2% and the Fed’s preferred inflation gauge holding at 1.6%, stubbornly below its 2% target.
Real Interest rates are defined as Nominal Interest Rate less Inflation, making the Treasury curve out to ten-years already negative. With the base rate for Federal Funds currently at 1.50%, the Fed has little room to be accommodative if economic conditions should soften more.
Intensifying this move lower in rate are two other items to be considered:
- The Fed intends to reinvest the run-off in maturing Mortgage Backed Securities from its balance sheet in Treasuries
- Per the Basel agreement, most large banks are required to post initial margin of Highly Qualified Liquid Assets (e.g. Treasuries) vs. uncleared exposure on derivatives
Both could contribute to increased demand for government guaranteed debt even as Treasury increases supply by funding the government’s growing budget deficit.
Revisiting the GDP report, non-residential fixed investment fell for the third consecutive quarter, the first time since the financial market collapse. This WSJ chart shows that trend which many analysts ascribe to concerns about ongoing trade tensions, something this virus outbreak could enhance.
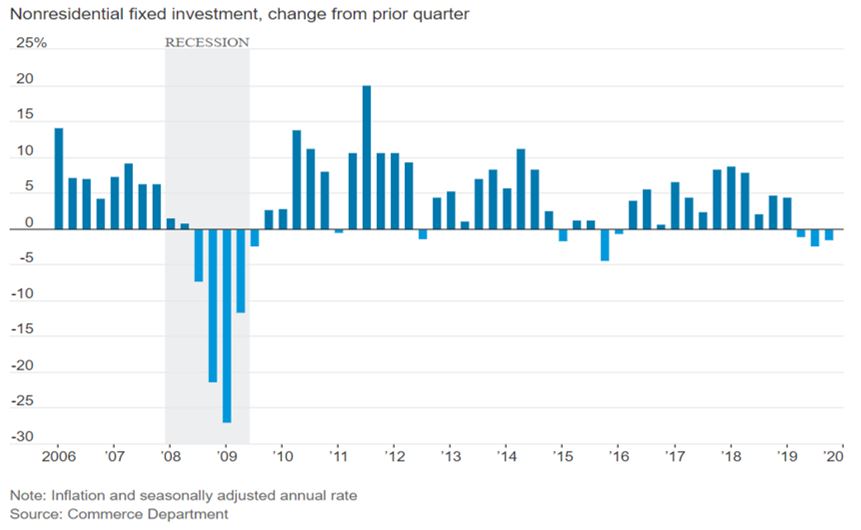
What all of this means is we have increasing amounts of cash seeking assets for investment in a risk-off environment that has increasing concerns for global growth.
The Week Ahead
A light Treasury calendar, the SBA 504 program prices its February debentures, and Fed speak resumes.
Monday – Treasury auctions $94 billion 13 and 26-week Bills; ISM Manufacturing Index
Tuesday – Factory Orders expected to be +1.2%
Wednesday – ISM Non-Manufacturing Index
Thursday – 504 program prices its February 20 and 25-year debentures
Friday – Non-Farm Payroll expected to be +153,000 vs. 145,000 last month
January 27, 2020
A Virus Hits the Markets
Stocks tried to rally but eventually succumbed to global concern over the coronavirus outbreak in China which damaged those domestic markets much more severely. For the week, S&P 500 Index was down 0.9% for its poorest weekly performance since August after a second case in the US was reported. But Asian markets were off as much as 4% before closing Friday to celebrate the lunar new year holiday.
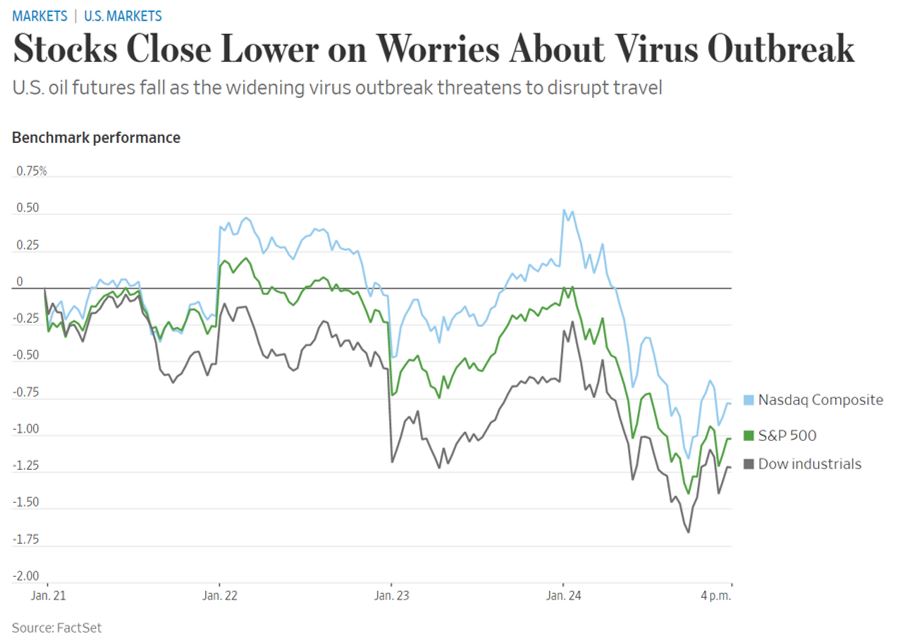
The impact on China’s economy is yet undetermined but with central China under a near-lockdown and many new year festivities cancelled there is concern over the extent of possible damage. Stock sectors that were most affected by travel restrictions resulting from the virus were airline stocks like American and United, down almost 4% and Wynn Resorts, whose revenue at its Macau casino is heavily dependent on air travel, was down 3%. A SARS outbreak 17-years ago was estimated to cost China’s economy $50 billion in losses and there remains concern that the country is not acting fast enough to contain this event.
While equities sagged, safe-haven trades were back in vogue as Treasuries broke out of their recent range with the benchmark ten-year Note closing the week at 1.69%, better by 13 bps on the week and 20 bps from when the 504 program priced its January debentures two-weeks ago. Both trends are likely to continue as authorities struggle to contain the outbreak.
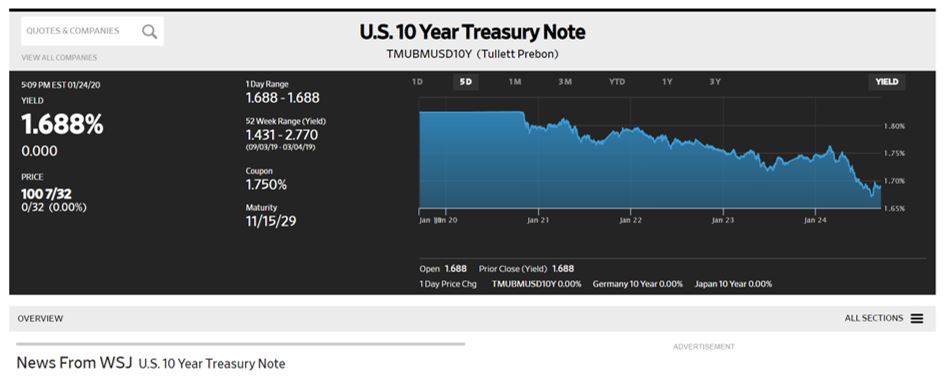
In a week devoid of Fed speak and light in Treasury issuance, one economic report that showed encouragement was existing home sales that were stronger than consensus at +3.8%, bringing total sales for the year to 5.54 million. Additionally, data company IHIS Markit reported its purchasing managers index for January climbed to its highest level in ten-months. This overall increase was concentrated in the service sector, with manufacturing showing a decline.
The Week Ahead
The FOMC meeting is most prominent but with no change, Treasury sells $243 billion in debt, and economic reports reflecting GDP and the Fed’s preferred inflation gauge that is expected to remain below target.
Monday – Treasury auctions $84 billion 13 and 26-week Bills, $40 billion 2-year Notes, and $41 billion 5-year Notes
Tuesday – Treasury auctions $26 billion 52-week Bills, $20 billion 2-year Floating Rate Notes, and $32 billion 7-year Notes. FOMC meeting begins; Durable Goods orders expected to recover to +0.5% from the previous level of -2.1%
Wednesday – Fed announcement at 2:00 with Jay Powell press conference at 2:30
Thursday – 4Q GDP estimate is +2.1%
Friday – Personal Income & Outlays forecast to show Personal Income at +0.3%, with core inflation at +0.1% and y/y unchanged at +1.6%
January 20, 2020
Is it More Than FOMO?
In a week that saw the first phase of the US-China trade pact signed, China removed from the list of currency manipulators (but still being monitored) and Impeachment proceedings having begun, the Treasury market stood still while stock indexes continued to set new highs.
As this WSJ chart indicates, all three major indexes improved at least 1.25% on the week with the technology sector of the S&P 500 index up 3%. Indicative of that sector’s strength Alphabet, parent company of Google, became the 4th US firm to reach the $1 trillion mark in market value, joining Apple, Amazon and Microsoft, though Amazon has not sustained that level. This record growth is not without concern as this sector is trading at elevated earnings per share levels, an indication of how pricey that may be.
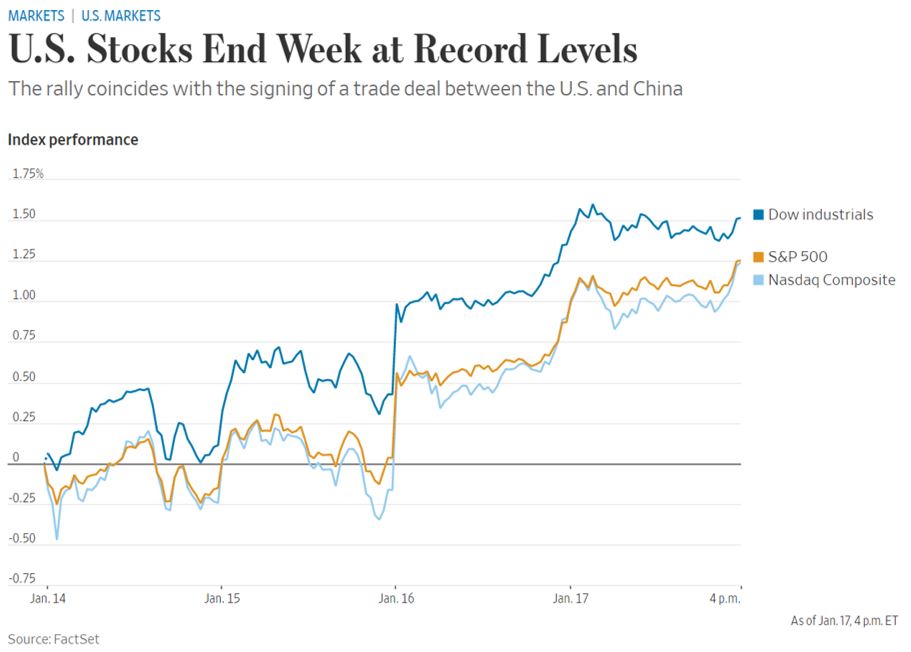
In addition to this cautionary truce in the trade war, another contributing factor that helps discount the Fear of Missing Out concept for this sustained equity strength was Friday’s report from China that December industrial production rose 6.9%, better than forecast and putting GDP at 6.1%. That final number is low compared to past performance but eases some fears about the world’s second largest economy while apprehension remains about an overall soft outlook for global trade as cyber security and Chinese subsidies are yet to be negotiated. With the Fed on hold as it evaluates data to determine any future moves, equity markets continue to gain as banks report strong earnings amidst robust consumer demand. All good for now, let’s see how long it continues.
A Big Hurdle
Wednesday’s trade agreement identified four sectors where China will increase its purchases of US products by $200 billion over the next two-years – agriculture, energy, manufacturing and services. Since the government is involved in much of the country’ s business this is achievable, but possibly at the expense of its other global trade partners.
Other Releases
Domestic reports came in below consensus: CPI core at +0.2%; PPI core at +0.1% and y/y lower at +1.1%; while Retail Sales disappointed at +0.3% but with November revised up by 0.1%. While European bond sales saw strong over-subscriptions, US Treasury rates softened late in the week after Treasury announced resumption of 20-year Bond sales to take place later in the year. Expectations are for increased funding needs as the deficit hits $1 trillion and shifting some of that financing to longer maturities is prudent in this low rate environment. This is a reintroduction of a security last sold in 1986 when long-term rates were above 8%.
The Week Ahead
A light week for Treasury auctions and economic reports, with no Fed speak in this blackout period ahead of the January 28-29 FOMC meeting.
Monday – Martin Luther King holiday
Tuesday – Impeachment trial resumes and Treasury auctions $78 billion 13 and 26-week Bills
Wednesday – Existing Home Sales
Thursday – Jobless claims
Friday – PMI Composite Flash
January 13, 2020
Slow and Steady
In a week where geo-political issues replaced trade tension for headlines, the 504 program priced its January debentures and the jobs report came in below estimates but held unemployment at 3.5%. Additionally, women held 50.04% of jobs for the first time in a decade and the positive number completed a year that represented 10 consecutive years of job growth. 2.1 million jobs were created in 2019, placing it 8th overall in the decade as the economy reflects the diminishing impact of the tax cuts that took effect in 2018. There was a total of 14,000 in reductions to previous reports and wage gains shrunk to 2.9% as markets seem resigned to steady but slower economic growth.
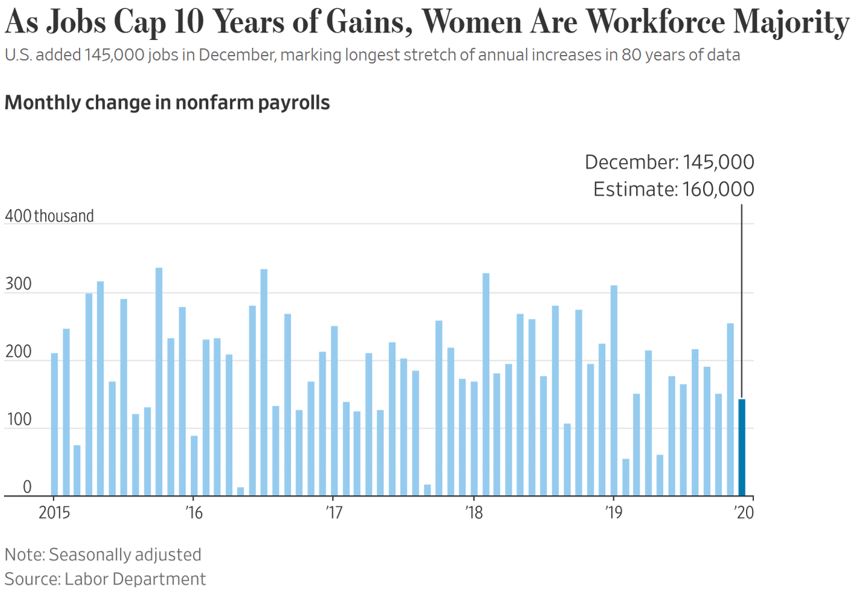
The admitted missile attack by Iran on the Ukrainian jet impacted markets in a more subtle way than might have been expected as it drove traders into safe-haven Treasuries for a day before that fear trade faded. It did take three days for Iran to claim a junior officer made a mistake in firing the missile though Western authorities suspected Iranian involvement almost immediately. The admission resulted in global outrage and protests on the streets of Teheran as Canada and Ukraine demand retribution.
Markets were still uncertain when the 504 program priced its January debentures, but the sales were met with strong demand and were priced at improved spreads to benchmark Treasuries as investors continue to seek high quality assets.
This chart reflects the ongoing Effective Rates for the 20 and 25-year debentures (more than 100 bps below Prime) which were priced at 2.32% and 2.45% respectively.
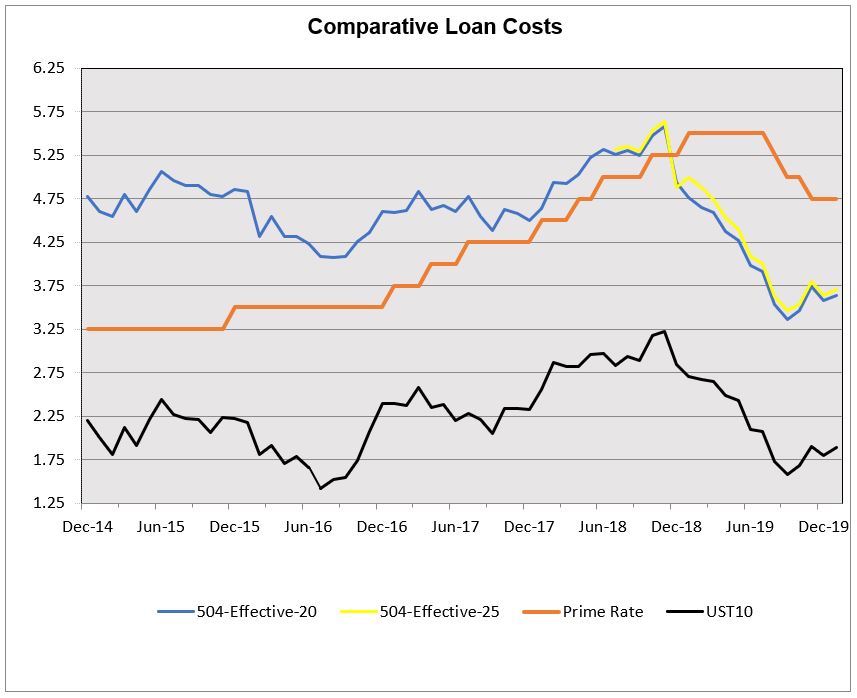
For the week, the benchmark ten-year Note traded in a fear on/fear off range of 10 bps, ending the week higher by just 3 bps at 1.82%.
The Week Ahead
A light Treasury calendar, heavy Fed speak, some economic reports and impeachment papers are expected to be submitted to the Senate.
Monday – Treasury sells $78 billion 13 and 26-week Bills
Tuesday – CPI expected to be +0.2% core and +2.3% y/y
Wednesday – PPI expected to be +0.2% core and +1.4% y/y; SBA 504 January debenture sales fund
Thursday – Retail Sales forecast to be +0.3%
Friday – Industrial Production expected to decline, -0.3%
January 6, 2020
Risk
A week that initially saw robust strength in equities evolved into a risk-off safe haven trade for oil and US Treasuries. After trading aIn a week where geo-political issues replaced trade tension for headlines, the 504 program priced its January debentures and the jobs report came in below estimates but held unemployment at 3.5%. Additionally, women held 50.04% of jobs for the first time in a decade and the positive number completed a year that represented 10 consecutive years of job growth. 2.1 million jobs were created in 2019, placing it 8th overall in the decade as the economy reflects the diminishing impact of the tax cuts that took effect in 2018. There was a total of 14,000 in reductions to previous reports and wage gains shrunk to 2.9% as markets seem resigned to steady but slower economic growth.s high as 1.93% on the first trading day of the new year the benchmark ten-year Note rallied to close the week at 1.79%.
The primary cause was Mideast tension resulting from a drone attack that killed an Iraqi General, supplemented by a weak manufacturing report that continued a five-month string of unimpressive numbers that continue to fall below consensus. In equities, the major indexes had set new record highs before Friday’s selloff where they were able to claw back a bit from an early 1.1% selloff.
The flight to quality was more subtle than on previous occasions and reversed the recent trend higher in rate that resulted from recent Fed comments about not taking rates lower. That stance was confirmed by Friday’s release of minutes from the Committee’s mid-December meeting that indicated they are comfortable with holding rates steady and are more concerned with economic activity than with a below target inflation rate of 1.6%. Supporting the premise of stronger economic activity is a yield curve that has steepened to +26 bps from -0.7 bps in August.
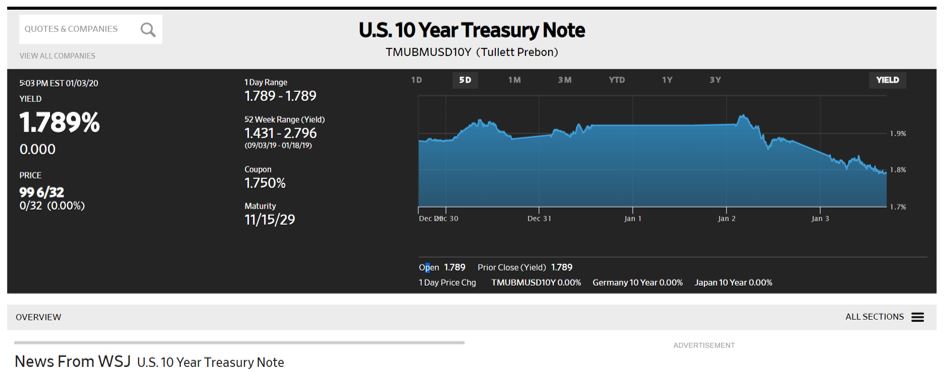
Any escalation of the Midbeat tension would continue a rally in rates as the 504 program prepares for its January debenture sales. At 1.79% the benchmark Treasury is 2 bps lower than in December when the 20-year debenture was priced at 2.26% and the 25-year at 2.38%.
This chart shows the dramatic rate drop in funding cost for the program as the 20-year rate dropped from its recent high of 3.87% in November 2018 to its low rate of 1.98% in September 2019. It was at that time when the Fed’s neutral stance was pronounced, and rates have gradually risen, but still remain low.
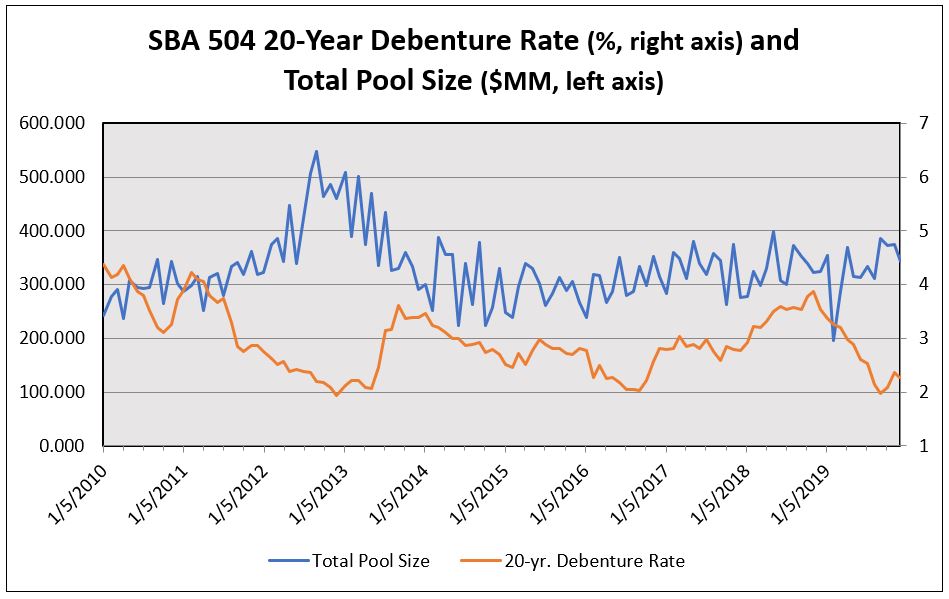
A Brief Review
Looking back at 2019 there was central bank volatility, some advancement on Brexit, some resolution of trade tensions, and successful intervention by the Fed in stabilizing the Repurchase Agreement market. Fear of a rate spike over year-end did not happen and it is hoped their participation can be reduced.
Looking ahead it is expected that the Fed will retain its neutral stance, Britain needs to finalize its departure terms from the EU, and more advances with China are needed. Hopefully, the most volatile development will be the rhetoric contained in the presidential election campaign.
The Week Ahead
Fed speak, Treasury to auction $156 billion in debt, the 504 program prices its January debentures, and the December jobs report.
Monday – Treasury auctions $78 billion 13 and 26-week Bills
Tuesday – Treasury auctions $38 billion 30-year Notes; ISM non-Manufacturing index
Wednesday – Treasury auctions $24 billion 10-year Notes
Thursday – SBA 504 program prices its January 10, 20 and 25-year debentures; Treasury auctions $16 billion 30-year Bonds
Friday – Non-Farm Payroll report for December expected to be +150,000
December 23, 2019
Equities and Rates Rise
With trade tension temporarily reduced, a bi-partisan trade pact with Mexico and Canada on track, and an impeachment process possibly delayed until 2020 stocks again closed at record highs. The three major indexes closed higher on the week by as little as 1.1% for the DJIA and as much as 2.2% for the tech heavy NASDAQ. Support was also received from economic reports like:
- Industrial Production above consensus at +1.1% after two weak months
- Third estimate of 3Q19 GDP holding at 2.1%
- Personal Income better than forecast at +0.5% while the core PCE was below forecast at +0.1%, continuing to trend below the Fed’s 2% with a y/y reading of +1.6%
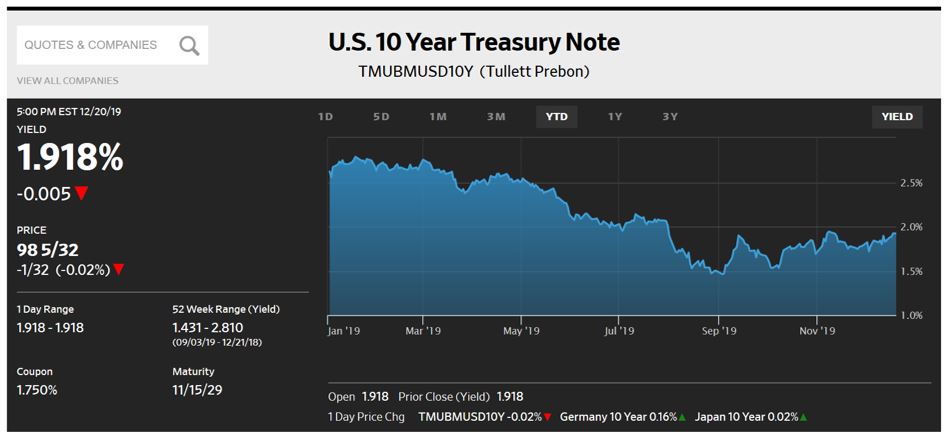
What is interesting about the closing level of 1.92% for the benchmark ten-year Treasury is that it now matches the 75 bps in rate cuts orchestrated by the Fed this year. At one point in September the market had driven its rate as low as 1.46% in expectation of additional rate cuts which the Fed has since indicated are unlikely to happen. That stance, along with strong consumer spending has bolstered domestic equity markets while vacating the safe-haven trade in Treasuries. Another indication of the market’s interpretation of Fed policy is the 2/10 Treasury curve is now at +28.6 bps, its widest spread since November 2018 and far removed from its brief and slight inversion.
Globally, the amount of negative yielding sovereign debt has been reduced from its high of $17 trillion to just above $11 trillion.
No Shutdown
With passage of a $1.4 trillion spending bill through September 2020, Congress has removed the risk of a government shutdown while also removing parts of the Affordable Care Act.
Economic Forecast
A WSJ survey of 57 economists cites a healthy labor market contributing to the US expansion that is now in its 11th year. Growth is expected to slow to 1.8% by 4Q20 from 2019’s estimated level of 2.2%. Job growth in the first half is expected to average 157,000, declining to 104,000 in the second half of the year. With the economy well balanced between employment and inflation, plus strong consumer demand, the economists see no need for the Fed to act in the 2020 election year, leaving us in a range bound market for interest rates.
The Week Ahead
Treasury to auction $191 billion, no Fed speak, and few economic reports.Monday – Treasury auctions $78 billion 13 and 26-week Bills and $40 billion 2-yer Notes; Durable Goods expected to remain strong at +0.9%; New Home Sales forecast to show continued strength
Tuesday – Treasury sells $41 billion 5-year Notes
Thursday – Treasury sells $32 billion 7-year Notes
December 16, 2019
Long Pause
Both the Federal Reserve Bank and the European Central Bank announced their satisfaction with economic developments with no plans to tighten monetary policy while leaving the door open to cut rates further. The three rate cuts so far this year from the Fed have been the most aggressive moves since the financial crisis, leaving the benchmark ten-year Treasury rate lower by 87 bps YTD (unchanged on the week at 1.82%) while the S&P 500 index has gained 25.5%.
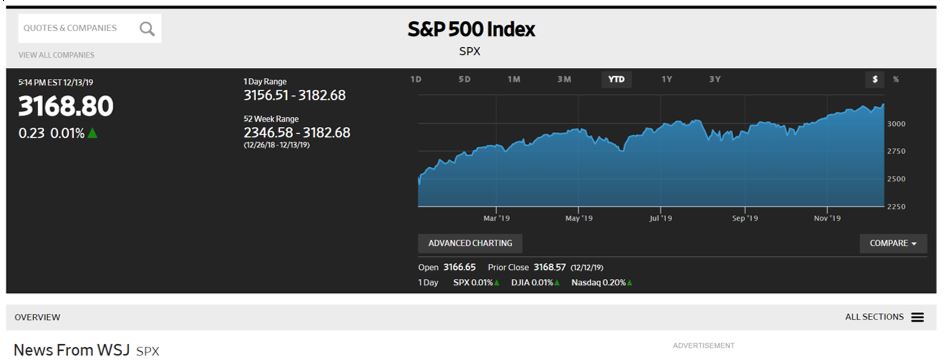
Trade
And it was the equity market that responded most favorably to the limited Phase One trade agreement announced Thursday as new highs were reached once again. Chinese negotiators were pleased with the rollback of many tariffs while agreeing to an undisclosed reduction to its demands for sharing intellectual property and will provide access to domestic financial markets. Their agreement to purchase $32 billion of agricultural products yearly, with the intent to increase that amount, will be welcomed by American farmers.
This agreement was one of three recently concluded by the President’s chief negotiator, Robert Lighthizer, who added the USMCA agreement with Mexico and Canada, plus elimination of the appellate process at the World Trade Organization. The second agreement is the successor to NAFTA while the WTO action blocks the overreach that recent Administrations have accused the organization of doing.
Not part of the Phase One agreement though, was China’s recent decision requiring government offices to cease using foreign equipment and software by 2022.
Brexit
Thursday’s general election has provided Boris Johnson a Conservative majority in Parliament which should make it easier for him to facilitate Britain’s exit from the European Union. Terms of that move are to be determined as Mr. Johnson has not defined his plan for the exit, especially Northern Ireland’s border, nor its cost. While that will be negotiated with EU leaders in Brussels, he will also have to deal with renewed demands for Scottish independence as that country has voted its preference for remaining in the bloc.
Repo Market Blame
As we approach year-end and its usual financing pressure over the turn, blame for the distorted rate pressure in October for Repurchase Agreements (Repo’s) has been directed to Hedge Funds, in addition to the Treasury for issuing more debt and banks for increasing their reserves above the required levels. The rationale for this is their Basis trading, a representation of Relative Value Trading - which deals with the difference in price between two assets that are nearly identical – like buying Treasuries and selling Interest Rate Futures contracts. These products are similar but not identical and their price difference is small, so the trades need to be large to be profitable. Hedge Funds will buy the Treasuries and finance them in the Repo market to raise more cash to put on more of the trade, a process that has recently strained that market. While these Funds may be criticized for their impact on financing rates, it should be appreciated that they are buying the increased amounts of Treasury debt being sold to fund the government’s deficit, something that helps lower its funding costs.
Reports last week had CPI above forecast at +0.3%, PPI below consensus at 0.0%, and Retail Sales a bit disappointing at +0.2%.
The Week Ahead
Treasury will sell $111 billion of debt, Fed speak resumes, and we get the Fed’s preferred inflation gauge on Friday.
Monday – Treasury sells $78 billion 13 and 26-week Bills
Tuesday – Industrial Production forecast at +0.8% after two very weak reports
Wednesday – Treasury sells $18 billion 2-year Floating Rate Notes
Thursday – Treasury sells $15 billion 5-year TIPS
Friday – 3Q2019 GDP forecast as 2.1%; Personal Income & Outlays includes Personal Consumption Expenditures forecast as +0.2%, 1.6% Y/Y
December 9, 2019
Stronger than Expected
After reacting to daily, contradictory messages on trade, Friday’s Non-Farm Payroll report sent equities and Treasury rates higher. Coming in stronger than consensus at 266,000 with unemployment lower at 3.5%, the report especially helped equities recover from additional tariffs announced earlier in the week. The tariffs included steel from Brazil and Argentina plus a 100% tariff on French goods and accompanied comments from President’s Trump that there was “no deadline” for a China deal. This combined to send stocks lower by 1.2% on Tuesday, only to recover 0.7% on Wednesday when the President said talks were going “very well.”
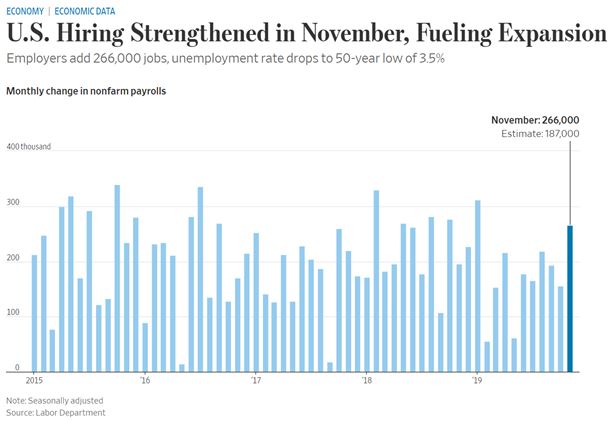
In addition to the stronger than expect jobs report, Y/Y wage growth came in at 3.1% and was accompanied by a comment from Labor Secretary Scalia that 6.6 million jobs had been created since January 2017.
With the Fed having already indicated it would be cautious about additional rate cuts, it is unlikely Wednesday’s announcement will result in any action as this report represents the “incoming information” that the Fed has stated it will assess for its decisions.
One Weak Sector
The global auto industry continues to shrink faster in 2019 than at the height of the financial crisis. VW and Daimler announced job cuts totaling 20,000 recently and the Association of the Auto Industry projects 4 million fewer cars will be sold in 2019 than last year.
This month’s jobs report did show a gain of 41,000 auto workers but this is misleading as they were returning from an extended strike at General Motors.
Continued Low Rates and Higher Volume
Last week’s debenture sale for the SBA 504 program was well received and continues to produce ongoing effective rates at attractive levels. With the Prime Rate having been reduced by 75 bps this year the differential is not as great as it had been, but the reduced government borrowing fee for FY20 was realized by loans this month for the first time.
At 2.26% the 20-year debenture rate was 28 bps lower than the 12-month average and total pool size of $342,753,000 for the two debentures was $13,393,000 more than the 12-month average.
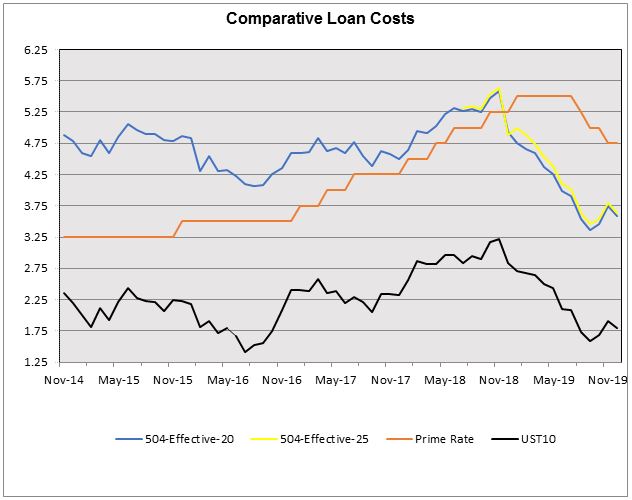
Fed Continues Support
The Fed continues to add liquidity to the financial markets to ensure stable financing terms through year-end when cash can be scarce. The bank continues to buy T-Bills and will do so through next summer as it hopes that activity will reduce the need for continued support in the short-term Repurchase Agreement market.
The Week Ahead
A light economic and Treasury calendar, and no Fed speak until Wednesday’s announcement.
Monday – Treasury sells $78 billion 13 and 26-week Bills, and $38 billion 3-year Notes
Tuesday – FOMC meeting begins, Treasury sells $24 billion 10-year Notes
Wednesday – SBA 504 program funds its December debenture sales, CPI forecast to be +0.2%, Treasury sells $16 billion 30-year Bonds; FOMC announcement and economic forecast @ 2:00 followed by Jay Powell press conference
Thursday – PPI expected to be +0.2%; Britain holds a General Election which will influence its Brexit negotiations
December 2, 2019
Frozen
Like the movie sequel from Disney, markets seem trapped with Treasury rates yo-yoing within a tight range while equities continue to grind higher as alternate days bring reports of progress and dissension on trade talks. Adding to that tension was President Trump’s signature on legislation supporting the Hong Kong protesters, a gesture that so far has produced a muted response.
The benchmark ten-year Treasury was basically unchanged at 1.78% while equities gained 1% on the week, closing November with their best monthly performance since June. At 1.78%, UST-10 is 12 bps lower than when the SBA 504 program priced its November debentures.
Frozen 2
Below is a Financial Times chart displaying a long-range forecast of JP Morgan Asset Management that reduces its expectation for the performance of long-dated US Treasuries. The bank’s opinion reflects the impact of central bank interest rate cuts and investors are advised to abandon safe-haven trades because “they can no longer provide the combination of portfolio protection and positive income that they have in the past.”
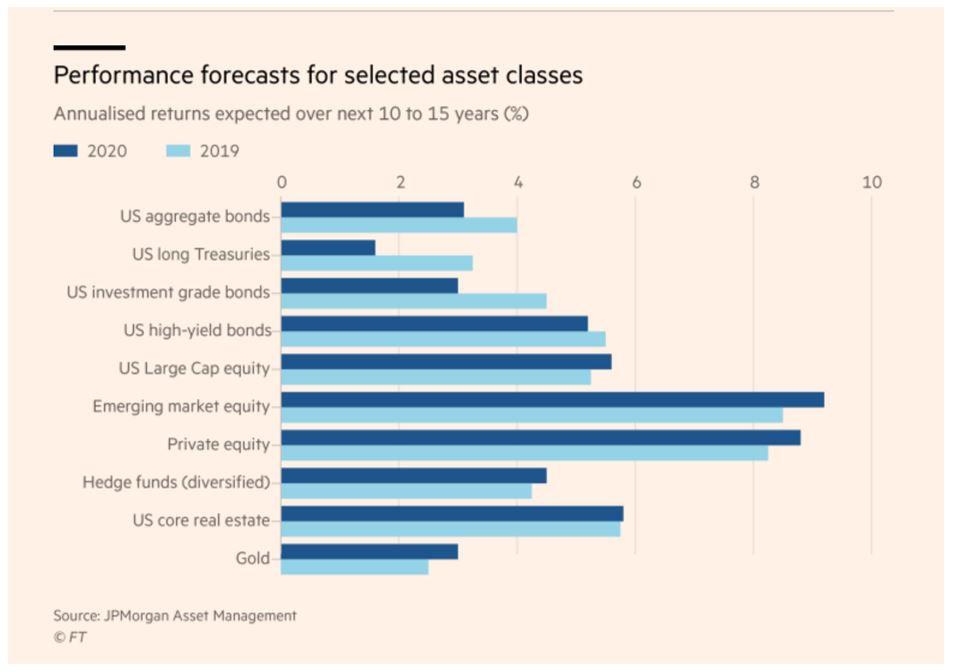
The head of multi-asset strategy at JPMAM, John Bilton, cautioned investors that monetary policy will probably remain “extremely accommodative” throughout this business cycle and into the next due to global economic weakness and low inflation. Lending support to those observations is a recent quote from Chairman Powell -“we would need to see a really significant move-up in inflation that’s persistent before we would consider raising rates,” and by virtue of the recent rate cuts the Committee is affirming that the economy is showing less strength than it expected.
And speaking of low inflation, the Fed’s preferred gauge, Personal Consumption Expenditures, declined to 1.6% y/y, trending further away from its 2% target. Consumer spending did increase, but much of that gain was attributed to higher outlays for electricity and gas, which are excluded from the core calculations. In other economic reports last week:
- The second estimate of 3Q19 GDP increased to 2.1%
- Durable Goods orders came in at +0.6%, far above the -0.7% consensus
The Week Ahead
No Fed speak ahead of their December 10-11 meeting, Treasury sells Bills only, and the SBA 540 program prices its December debentures.
Monday – Treasury sells $78 billion 13 and 26-week Bills; ISM Manufacturing Index
Tuesday – Treasury sells $26 billion 52-week Bills
Wednesday – ISM Non-Manufacturing Index
Thursday – SBA 504 program prices its December 20 and 25-year debentures
Friday – Non-Farm Payroll expected to be 180,000
November 25, 2019
Still Waiting on Phase One
But while we wait there was some positive news on the economy as illustrated in this WSJ chart showing an October increase in the recent Purchasing Managers Index. The release from data company HIS Markit shows an increase to 51.9, partially reversing the year to date drop from its February high of 55.5. A reading above 50 reflects economic growth while a reading below 50 indicates a retraction, as shown for the Eurozone, Japan, and the Brexit in waiting UK.
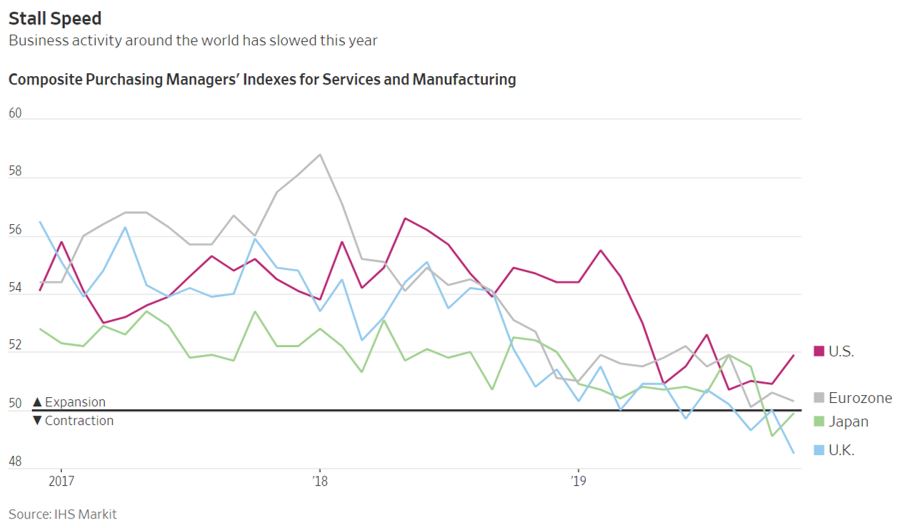
The report included a comment from HIS Markit’s economist, Chris Thompson, that “the worst of the economy’s recent soft patch may be behind us,” though it is clear that is not applicable globally. Trade tensions continue to promote uncertainty which is compounded by the impeachment inquiry and a UK election next month that will influence Brexit negotiations. For the week, safety was again sought in Treasury debt with the benchmark ten-year Note improving 6-bps while equities marked time be setting back from the previous week’s record highs. UST-10 settled at 1.77%, improved by 6 bps on the week and 13 bps from when the SBA 504 program priced its November debentures.
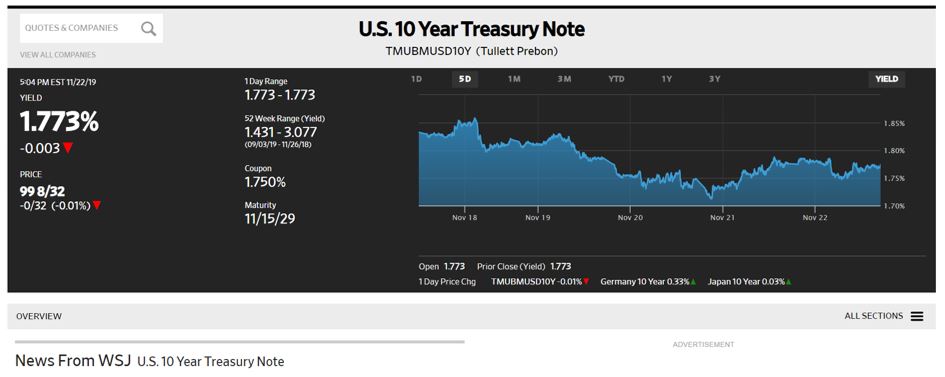
The Week in Review
Release of the minutes from the October 31 FOMC meeting were as expected with the Fed indicating it was moving to the sidelines and will review economic activity before making any “material reassessment” of its policy.
Reflecting the cautious state of investors, year-to-date inflows into Corporate bond funds reached $180 billion, making it the third most active year for that product. But risk in fixed rate debt is still being embraced if the potential reward is high enough. Angola, a country whose debt almost matches its GDP, attracted $8 billion in orders for $3 billion 10 and 30-year securities. The respective rates of 8% and 9.25% proved to be very attractive for yield starved investors.
Discount Window Lending vs. Repurchase Agreement Support
The Discount Window is a facility the Fed manages to support member banks needing to meet reserve requirements on any given day. Much is not currently needed as banks are holding cash positions well above what regulators require; like JP Morgan Chase holding $120 billion vs. the required $60 billion. The reason given by bank officials is to provide a big buffer should any crisis arise, but the effect of that approach is to reduce liquidity in the Repo market where securities firms finance their overnight positions. To reduce that strain, the Fed continues to add billions of dollars daily to maintain financing rates in line with their Fed Funds range of 1.50%-1.75%, resulting in a stable Repo market but an increased balance sheet for the bank.
The Week Ahead
Light Fed speak and economic reports in a holiday shortened week, and Treasury to sell $215 billion in Bills and Notes.
Monday – Treasury sells $84 billion 13 and 26-week Bills and $40 billion 2-year Notes; Jay Powell speaks in Providence, Rhode Island
Tuesday – Treasury sells $41 billion 5-year Notes and $18 billion 2-year Floating Rate Notes
Wednesday – Treasury sells $32 billion 7-year Notes
November 18, 2019
Risk On, and Off
In a week where preliminary reports of a trade accord were challenged, both the US Treasury safe-haven trade and the risk-on equity trade prospered. The benchmark ten-year Note recovered almost 11 bps and the DJIA improved by 1.4%, crossing 28000 for the first time.
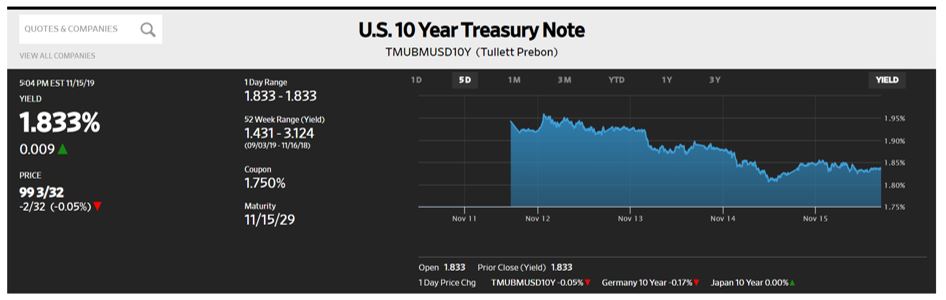
While Treasuries steadily improved, positive Jay Powell comments on the economy helped equities gain ground later in the week. A strong earnings report from Walmart (+27% ytd) and then a stronger than expected +0.3% gain for Retail Sales helped retailers like JC Penney show a 6.5% spike on the week. If nothing else, investors seem to have identified value in both market sectors while still exhibiting caution.
As positive as Chairman Powell was regarding economic stability, he, and other Fed speakers referenced the “low for long” interest rate environment as possibly resulting in “financial vulnerabilities” as investors reach for yield and more debt is assumed. And nowhere is this felt more than in underfunded pensions, where life expectancy has increased, and funds are scrambling for yield. With $11.5 trillion of global debt trading at negative yields, any spike in rates will compound this dilemma for fund managers.
This teeter-totter approach to monetary policy will continue as the Committee balances President Trump’s yearning for lower, even negative interest rates with the reality of full employment and reasonable, though not dynamic economic stability. Further insight on the Committee’s thinking should be available when the minutes of their October meeting are released this Wednesday.
Other Reports
CPI and PPI both came in as expected and will do little to change Fed policy.
One weaker than expected event was Friday’s -0.8% update on Industrial Production, which was double consensus. Though a decline was expected due to the impact on vehicle production resulting from the UAW strike, production of business equipment continues its downward trend.
Fed Balance Sheet
As this WSJ chart indicates, the Fed has reversed its Quantitative Tightening by providing liquidity to the short-term financing market. The graph identifies the bank has reversed 40% of balance sheet reduction in the last two months as it has moved to normalize the market’s financing terms. That rate has settled slightly below the 1.625% mid-point of the bank’s Fed Funds range.
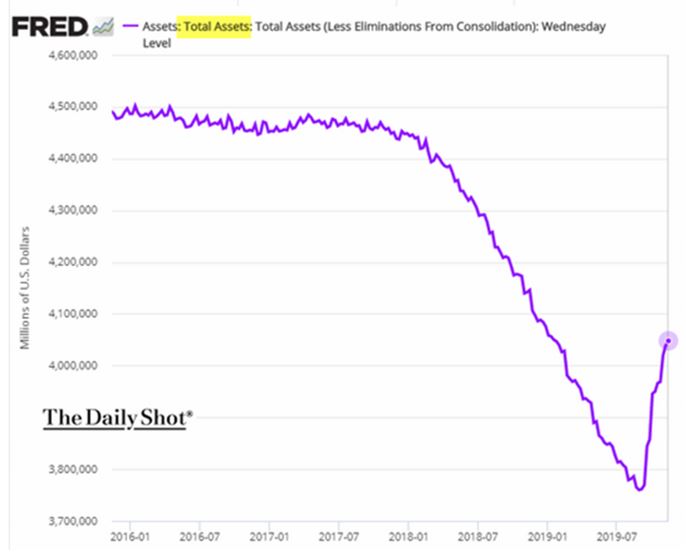
The Week Ahead
There is a light calendar for reports (some housing data), Fed speak and Treasury supply.
Monday – Treasury to sell $87 billion 13 and 26-week Bills
Wednesday – Minutes of the last FOMC meeting are released
Friday – PMI Composite Flash report on manufacturing and services
November 12, 2019
A Change in Market Sentiment
In a week that saw rumors of reduced tariffs only to be squashed by President Trump saying he has not agreed to that, we saw equities reach new highs again while bond rates rose in response to the unconfirmed agreements.
The market had become hopeful on tariff resolution for stocks and cautious on rates following the most recent FOMC rate cut. Rates began the week by drifting higher into the Treasury’s quarterly refunding of debt and on Thursday the benchmark ten-year Note increased 9 bps ahead of the SBA 504 program pricing its November debentures. That trend has paused the safe-haven trade in Treasuries and gold for now, leaving UST-10 at 1.94% to close the week and looking for its next level of support. This move in rates has steepened the 2/10’s Treasury curve to +27 bps negating talk of a pending recession when it was inverted at -1 bps back on August 30th. Since that date, the Fed has reduced its base rate by 50 bps and the benchmark ten-year Treasury has risen 44 bps, and even UST-2 is higher by 18 bps, a disconnect from traditional performance.
Here is a snapshot of how the November debenture rates changed this month, but more importantly, how much lower they are y/y than the 75 bps rate reduction that has taken place since July. Part of the explanation is change in sentiment, as rates were increasing last November in anticipation that the Fed was about to raise rates again in December, but after that rate hike the market front-ran the Fed in response to weaker economic reports and trade tensions. Global sovereign rates declined, and a changed central bank posture soon followed with the most recent announcement indicating they will be on hold pending future reports.
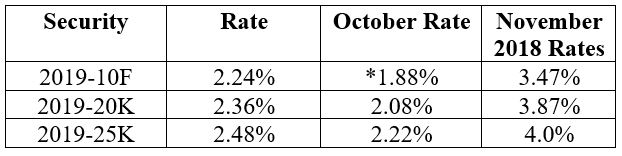
*September issue
What stands out in the comparison is how the 25-year debenture tightened in pricing spread by 2 bps m/m (and by 6 bps over the 12-month average) as investor demand for the maturity has matched small business borrowers increasing preference for it.
As seen in this chart, even with the 75 bps reduction in Prime Rate and increased debenture rates, the 504 program is still delivering attractive ongoing Effective Rates for term loans with 2019-20K at 3.74% and 2019-25K at 3.80%.

Other Items Last Week
- Treasury auctions were well received as strong demand reflected investor interest at higher yields
- Fed speak was cautious, as expected
- The ISM Non-Manufacturing index came in above forecast with help from strong consumer demand, something that should influence this week’s Retail Sales report
The Week Ahead
A light Treasury calendar, more Fed speak including Chairman Powell, and some economic reports on inflation and consumer demand.
Tuesday – Treasury auctions $87 billion 13 and 26-week Bills
Wednesday – SBA 504 program funds its November debenture sales; core CPI expected at 0.2%/2.4% y/y; Chairman Powell speaks before the Congressional Joint Economic Committee
Thursday – Core PPI expected to be 0.2%/2.0% y/y
Friday – Retail Sales forecast to be 0.2%; Industrial Production expected to be 0.4%
November 4, 2019
The Week in Review - Third Rate Cut, as Expected
The FOMC announcement on Wednesday was as expected, but with the Fed pumping the brakes on additional cuts. The language in their announcement changed from “act as appropriate” to assist the economy to - the Committee will “monitor the implications of incoming information, as it assesses the appropriate path” of rates; whatever that means. Markets were quiet immediately afterwards but then Thursday delivered a sense of Chinese pessimism for a long-term trade deal whose first phase was expected to be signed at a now cancelled meeting of world leaders in Chile. That cancellation was nominally a result of riots caused by a $.04 transit fare increase but are largely associated with global recognition of income inequality and the economic prosperity gap between the wealthy and the masses.
Treasuries rallied on the week with the benchmark ten-year Note closing at 1.72%, 8-bps higher than when the SBA 504 program priced its October debentures. Equities were hurt by the Chinese assessment but recovered on Friday after the jobs report.
Slower, but Stable
Helped by a 1.9% reading for 3Q19 GDP and then a larger than expected gain of 128,000 jobs in October, stocks ended the week on a strong note even as the market battles a lack of consumer confidence. That deficiency is perplexing since the GDP report was bolstered by a 2.9% increase in consumer spending, a significant component of economic growth. To show how the market perception has changed recently, this Financial Times chart shows the negative reaction to the previous two rate cuts, but the Fed’s comments supporting economic stability resulted in a more positive reception with the three domestic indexes closing at or near record highs. October’s report reduces the year’s monthly average gain to 167,000 but also represents the 109th consecutive month of gains, the longest stretch in the report’s history.
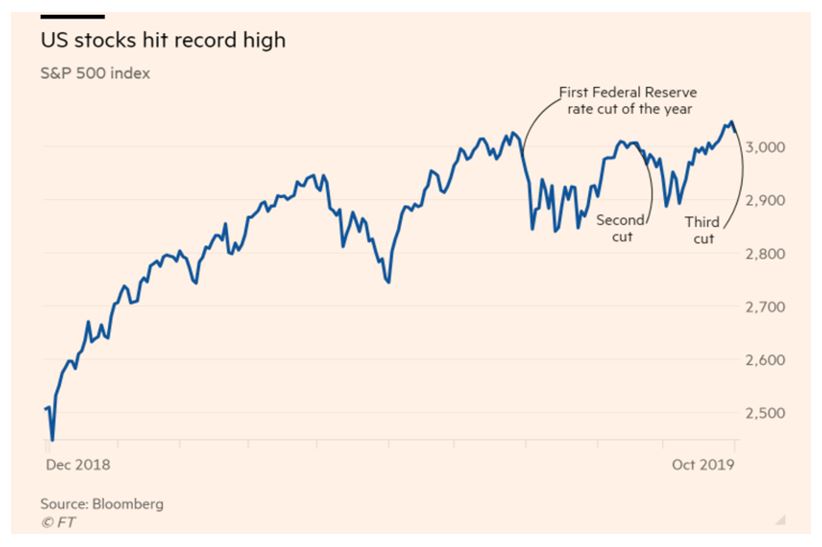
Brexit Update
PM Boris Johnson successfully maneuvered for a general election on December 12 after agreeing with opposition demands for a “flextention” to leave the EU by January 31. This qualification will permit an earlier departure should an agreement be reached after the election and allow the UK to leave at that time without waiting until the new end date.
How Attractive is the Residential Real Estate Market?
For sellers, the answer is very attractive, for others not so much. While the Pending Index of Home Sales report came in with its strongest reading in two years last week, the strength is not felt by all participants. Using local data, in September the average home sale price in Charlotte was up nearly 10 percent over last year. Meanwhile, the number of houses on the local market is down 40 percent from five years ago. Few people feel that squeeze more than real estate agents who, to make things even more competitive, have seen the number of licensed agents nearly double since 2014. Additionally, a report from Redfin, a real estate brokerage, shows homeowners staying in their homes an average of thirteen years, five years longer than they did in 2010. Adjusted for population growth the inventory level is the lowest in 37-years, contributing to reduced supply and increased valuations. Click here to view full Redfin report.
The Week Ahead
SBA 504 program prices its November sale of 10, 20 and 25-year debentures; heavy Treasury supply and Fed speak, and a light economic calendar.
Monday – Treasury sells $87 billion 13 and 26-week Bills
Tuesday – November debenture sale is announced; Treasury sells $38 billion 3-year Notes and $28 billion 52-week Bills
Wednesday – Treasury sells $27 billion 10-year Notes
Thursday – November debentures are priced; Treasury sells $19 billion 30-year Bonds
Friday – University of Michigan Consumer Sentiment survey is released
October 28, 2019
Trade Optimism Boosts Stocks, Softens Bonds
The first phase of a trade agreement with China still waits to be finalized but positive comments were enough to push the S&P 500 Index close to its record high, gaining 1.2% on the week, as seen in this WSJ chart.
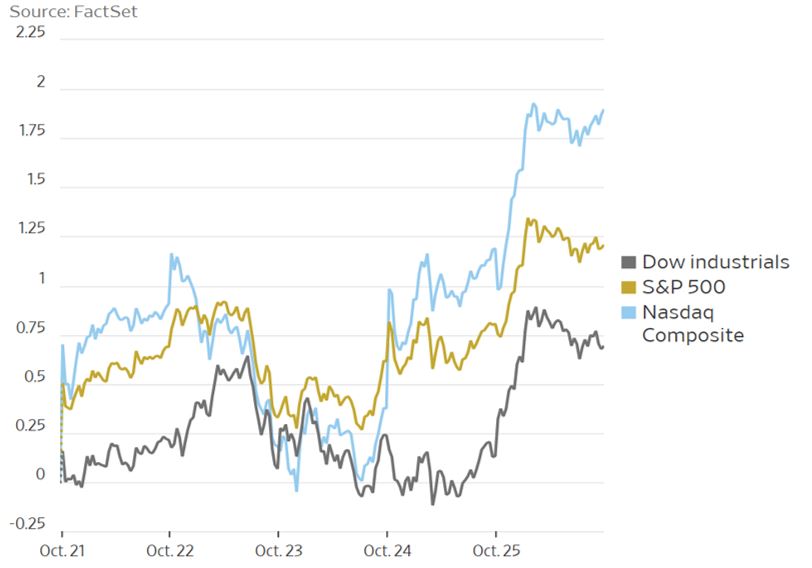
Reports and Rates
Not even a weaker than expected Durable Goods number and a mixed bag of earnings reports could dampen the enthusiasm for stocks as the rates market dealt with a heavy Treasury calendar and then news of an increased budget deficit that grew by 26% in the latest year, approaching $1 trillion. Durable Goods came in even weaker than its negative forecast at -1.1% and did nothing to deter either market from the paths they were on, especially Treasuries which usually rally on weak economic news.
The ten-year Treasury benchmark yield rose 5 bps (1.796%) on the week putting it 16 bps above where the SBA 504 program’s October debentures were priced. A greater deficit translates to increased funding needs for Treasury at a time when the market expects further rate cuts that should lower Treasury rates, at least in the front-end. From levels in January (and even higher last year) the market front-ran the Fed by pushing that ten-year yield lower by 67 bps to 2.01% even before the first rate cut on July 31st; but now, with expectations of a third rate cut at Wednesday’s announcement the market is more cautious.
Like most countries, Japan is experiencing reduced manufacturing activity with a September decline that was the most in five-years. It was affected not only by global weakness but a recently increased consumption tax and a deadly typhoon. Like the Fed, this week their public policy Board meets to discuss monetary policy with an announcement scheduled for Thursday.
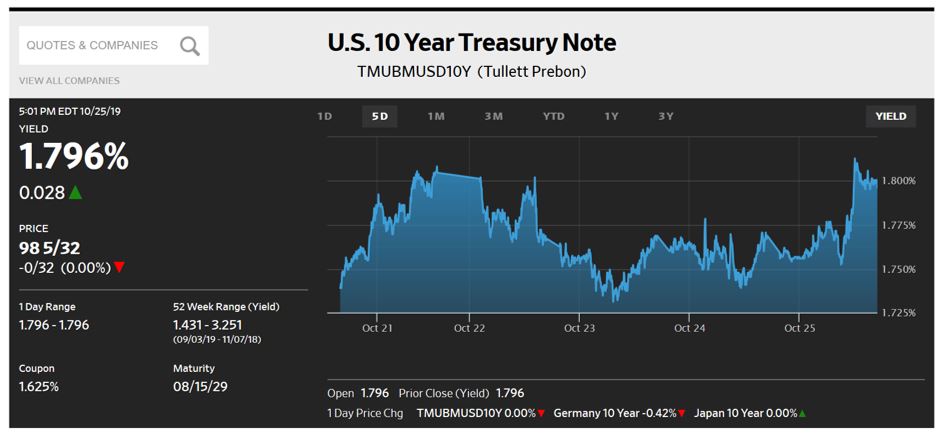
With regard to Treasury supply, the Fed increased its intervention in the overnight Repurchase Agreement market to $120 billion and to $45 billion in the term market. Like its monthly purchases of $60 billion of Treasury Bills, these moves are directed to reduce market volatility, especially as firms approach year-end when they generally reduce their Balance Sheet exposure. In other news, Brexit continues to stumble along with continued debate on seeking an extension of the October 31 deadline and for how long. Negotiations are complicated by a government preference for a general election which the opposition resists because they currently lag in the polls.
The Week Ahead – It’s Fed Time
No Fed speak until Wednesday, a light Treasury calendar, and some significant economic reports.
Monday – Treasury auctions $87 billion of 13- and 26-week Bills
Tuesday – Federal Open Market Committee meets
Wednesday – 3Q2019 GDP expected to decline to 1.7% from 2% in Q2; Fed announcement at 2:00 followed by Chairman Powell press conference at 2:30
Thursday – The Fed’s preferred inflation gauge is part of the Personal Income & Outlays release, expected to show a 0.1% gain with the core rate at +1.7% y/y
Friday – Non-Farm Payroll expected to decline to 95,000 from a 136,000 gain in September. Average hourly earnings forecast to be +0.2%, +3% y/y
October 21, 2019
Deal or no Deal
That header qualifies for a few negotiations:
- UK and the European Union on Brexit
- US and China trade negotiations
- UAW and General Motors
- US and Turkey negotiations on Syria
On Brexit, the leaders of both entities have an agreement, though final terms and ratification are pending. In the case of the UK, their sticking point is that dreaded border issue on the island of Ireland and Mr. Johnson’s proposal is not fully endorsed by his coalition’s partner, the Democratic Union Party of Northern Ireland. A desired vote on Saturday was postponed forcing the PM to request a Brexit extension, something he has said he would prefer “being dead in a ditch” to doing. As for the EU, their flexibility on negotiations seemed to indicate a “leave already” attitude as they want to finalize this departure.
If anyone knows where the US-China negotiations stand, they have not come forward with a clear explanation. Confirmation of a tentative, first phase agreement two weeks ago lent support to equities while softening Treasuries, and Thursday’s release of 6% 3Q2019 growth for China confirms the impact that tariffs are having on the world’s second largest economy. While that rate of growth seems to be sizeable, this was the weakest quarterly performance in three decades. In the US, factory output slumped 0.5% in September as a strike at General Motors caused a steep decline in auto production.
That leaves the UAW-General Motors deal as the firmest of the negotiations, but even that requires a final vote from union members. The deal resulted in increased wages, benefit gains and a signing bonus for workers while agreeing to permanently close three plants and not relocate any production from Mexico.
The situation in Syria has little impact on financial markets for now but has embroiled the President in a dispute with his own party members as he negotiated a cease fire to permit Kurd fighters to evacuate the country over a five-day period.
Other Developments
Three for Three?
The FOMC meets again on October 29-30 and it is expected they may reduce rates for the third consecutive meeting, lowering the Fed Funds target to 1.50-1.75%. Investors in interest rate futures assign a 90% probability for such a cut while Fed Governors caution future policy will be decided on a meeting to meeting basis.
Regarding the $15 trillion of global debt trading at negative yields, the International Monetary Fund cautioned that bond funds who hold $1.7 trillion of bonds could be facing a bond bubble if volatility increases and they face sudden withdrawals.
Adding to the weak manufacturing report, Retail Sales came in at the expected number of 0.3%, but it was -0.3%. A partial offset was an upward revision of 0.2% to the August report. Additionally, Leading Indicators were -0.1% with August being revised down 0.2%.
This WSJ chart identifies the concern analysts have for the health of the US economy as Industrial Production continues to trend lower from its most recent peak in 2018.
Here is the US industrial production on a year-over-year basis.
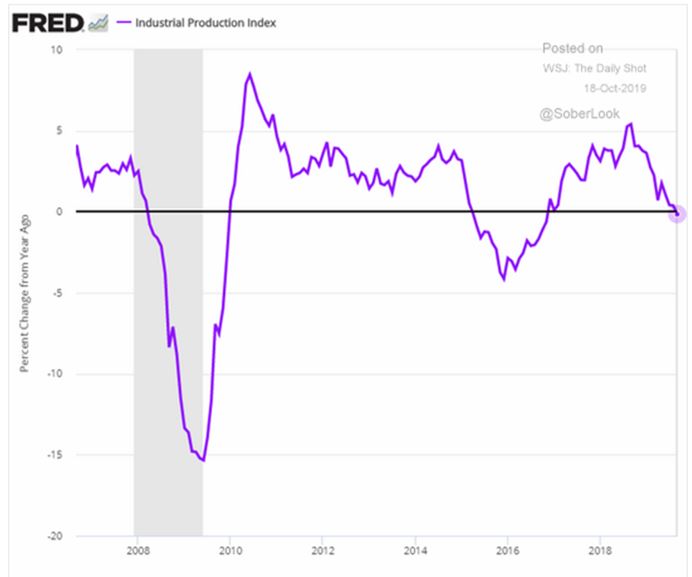
The benchmark ten-year Treasury remains in a vacuum, closing the week 7 bps higher than when the SBA 504 program priced its debenture sales on October 10th. At 1.75%, this benchmark is down 89 bps ytd with just 50 bps in rate cuts by the Fed, while domestic equity indexes hold their double-digit gains.
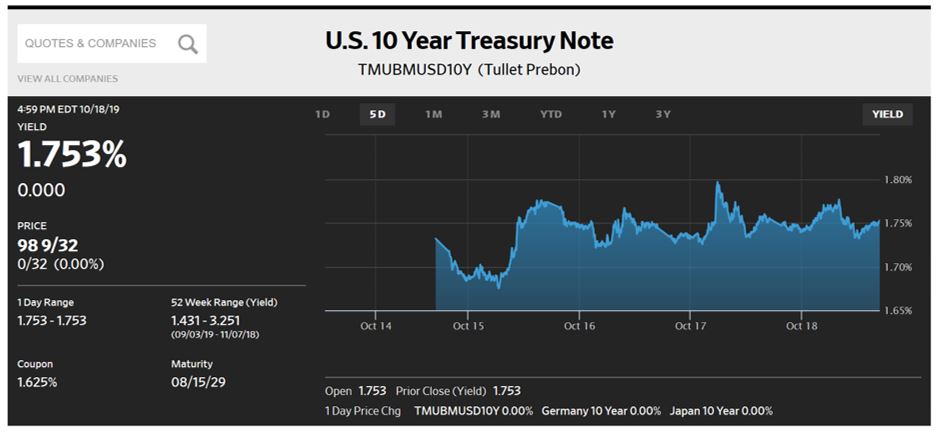
The Week Ahead
Fed speak, Treasury sells $220 billion of debt, some housing numbers and a Durable Goods report.
Monday – Treasury auctions $87 billion 13 and 26-week Treasury Bills
Tuesday – Existing Home sales; $40 billion 2-year Note auction
Wednesday – Treasury sells $20 billion 2-year Floating Rate Notes and $41 billion 5-year Notes
Thursday – Treasury sells $32 billion 7-year Notes; Durable Goods expected to be -0.7%
Friday – University of Michigan report on Consumer Sentiment
October 14, 2019
Risk On?
Well, maybe temporarily. Auctioning long-term debt at its lowest levels in three-years drew below average demand from investors, forcing dealers to position the securities and raising yields going into Thursday’s pricing of the SBA 504 program’s October debentures. Then Friday’s session was impacted by news of a first-phase agreement between the US and China that will pause some tariff increases which will be met with increased Chinese purchases of agricultural products. The impact on markets was somewhat unexpected since much of the agreement had previously been settled. Nevertheless, safe-haven trades were abandoned, and equities strengthened, gaining almost 1.5% on the week to levels that are within 2% of their recent highs.
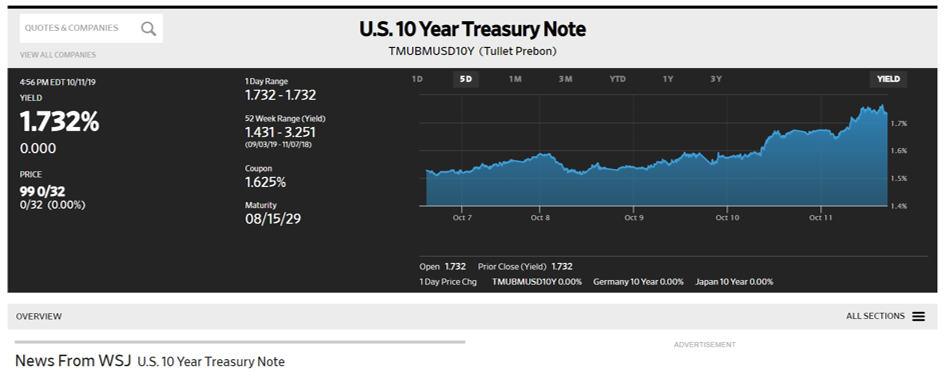
Of benefit to small business borrowers was Thursday’s debenture sales that showed increased demand for the 25-year term issue, which was larger than the traditional 20-year issue for the third consecutive month. The chart below shows the slight uptick in rate for the benchmark Treasury and the recent 504 debentures while the Prime Rate has seen a 50-bps decline since July. At 2.08% and 2.22% respectively the ongoing effective rates for the debentures are -154 and -146 bps to Prime.
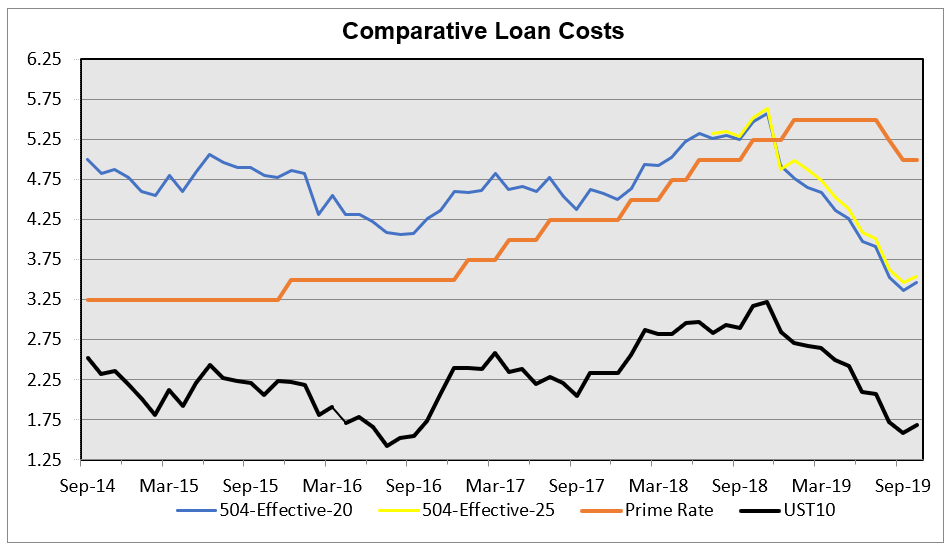
Stimulus or Not?
Other developments that had a positive market impact last week included two actions by the Federal Reserve Bank:
- The Fed supplied $88.1 billion in short-term financing (Repurchase Agreements) and will extend this activity to November 4
- Fed also announced plans to buy $60 billion Treasury Bills each month to ease cash shortages which were the cause of the spike in short-term financing that precipitated their Repurchase Agreement activity. Chairman Powell identified this action as “purely technical” and not related to the stimulus like the Quantitative Easing purchases of longer-term debt
- Adding to the positive vibe was some relative progress in UK deliberations on Brexit as the thorny customs border issue for Northern Ireland saw revised proposals
- Greece, once disparaged as one of the PIIG’s that were dragging down the European Union’s economy, joined other countries whose debt is so valued that it trades at negative yields. Their sale last week of €488 million of three-month debt was done at -0.02%
The Week Ahead
As Ohio prepares to host the next Democratic presidential debate it is interesting to note how the state’s economy has changed. Unemployment is down yet median hourly wages are below where they were in 1979 and that reflects the changing nature of its employment, from manufacturing to services. A generation ago General Motors, currently in the fourth week of a strike, was the largest employer; now it ranks 72nd, just ahead of Starbucks.
The holiday shortened week has a lot of Fed speak, light Treasury calendar, and few economic reports.
Tuesday – Treasury auctions $87 billion 13 and 26-week Bills
Wednesday – Retail Sales forecast to be +0.3%; SBA 504 program funds its October debenture sales
Thursday – Treasury auctions $17 billion 5-year TIPS
October 7, 2019
A run of weaker-than-expected US economic data led to lower Treasury yields as the week wore on. Treasury yields declined across the board led by a 22 bps drop w/w in the two-year note to 1.41%. The ten-year note yield declined 14 bps w/w to 1.53%. Below is a chart of the daily trading range in the ten-year yield over the past three months. Bordered by green lines is the trading range since the start of September of 1.4% to 1.9%. Last week’s rally in Treasuries brought the yield into the lower half of the trading range (circled in red in the chart).

Weaker Economic Data. The weaker US economic data can be captured in the downturn in the Citigroup economic surprise index. This index is nicely positively correlated with the rolling 13-week average yield on the ten-year note. A lower Citi index correlates with lower Treasury yields. After a run of positive surprises, the surprise index turned south last week. The weaker manufacturing, services and payrolls data released were the culprits.
Bond Market Priced in More Fed Cuts. The bond market took this turn south in the US data seriously. Despite Fed Chair Powell’s comments about a single “mid-cycle adjustment” the other month, the market quite disagrees. Why?
- the US economic expansion is quite old
- the economic data for the US and other large economies clearly are weaker
- other major central banks tend toward, are in, easing mode
- US trade conflicts, impeachment inquiry, volatile US executive leadership, and looming Brexit make for tougher trading decisions
- We will add that, amid the most rancorous US political climate in many years, the federal government will run out of funding after November 21. A continuing resolution must be passed by then to avoid what would be the second partial government shutdown of 2019.
Measuring Market Expectation for Fed Easing. The bond market has now priced in a material easing cycle. How can we measure this expectation? The OIS market provides a good measure of expected future Fed funds rates. It now prices in a high probability (80% or more) of quarter-point cuts in the target Fed funds range at the October and December FOMC meetings. If so, that would leave the year-end target Fed funds rate range at 1.25% to 1.50% versus a cycle starting range of 2.25% to 2.5% (the Fed has made two ¼-point cuts off that target so far). Further out the market prices in a 1% Fed funds target by the end of 2020. One hundred to 150 bps in rate cuts on such a low starting target base would be a material easing cycle indeed.
The yield curve is another measure of the expectations for a minor Fed easing cycle. The two-year Treasury note yield was 4 bps above the ten-year yield on August 27. It now is 12 bps lower than the ten-year note, a swing of 16 bps in five weeks. That relatively stronger move lower in shorter-maturity yields is a hallmark of market expectation for more Fed easing.
Risk Appetite Held In. While the Treasury market priced in a weaker outlook, US stocks closed not much lower on the week, and other measures of risk appetite were steady. In currencies, expectations of more Fed easing helped emerging market currencies. For example, the Brazil Real strengthened 2.6% and the Mexican peso was up 1%. Emerging market currencies typically sell off on higher US interest rates and rally on lower US rates.
In US credit, the CDX HY US high yield (HY) index spread to Treasuries was a bit wider. In higher-grade credit sectors spreads were a few basis points wider. In the government-guaranteed agency CMBS market spreads were 3-4 bps wider as Treasury yields fell amid heavy housing agency new issuance. Yet, continuously heavy flows into US bond funds has meant that portfolio managers have lots of cash on hand and have vigorously bought any bump higher in market yields, which helps contain any material spread widening.
Managers also face a chunk of the global government bond market at negative yields, with the US bond market the most liquid spot in the world to capture positive yields. Cheaper USD currency hedging costs help global investors to support the US bond market. As well, the Fed is expected to increase shorter-maturity Treasury purchases, not for easing purposes, but to get the level of banking system reserves to a higher level as a more permanent way to smooth over recent liquidity disruptions in the money market. For fixed income portfolio managers that would be an unplanned-for source of Treasury demand that would help soak up massive Treasury issuance, helping to keep bond market yields lower.
Calendar. This week the calendar is highlighted by the setting of the 20- and 25-year SBA 504 debenture interest rates on Thursday morning. In economic data we will see inflation data for producer (Tuesday) and consumer (Thursday) prices. On Wednesday the FOMC will release minutes from the latest meeting.
September 30, 2019
Whistleblowers Ruled the Week
Using a whistleblower complaint that the White House used a classified security system to cover up President Trump’s conversation with his Ukrainian counterpart in which it is alleged that he threatened to withhold financial aid, House Democrats launched an Impeachment inquiry into the affair; and NFL referees showed that they still cannot identify pass interference.
The implications of the presidential conversation are extensive as the President has rolled former Vice-President Biden into the affair as he claims that Mr. Biden had intervened with Ukrainian officials while in office on behalf of his son, who served as a board member for a Ukrainian energy company.
It seems that impeachment has been a topic of conversation since President Trump took office and the opposition finally settled on an issue thought to be appropriate. While the House of Representatives is authorized to bring the resolution of impeachment and officially charge the President, it is the Republican controlled Senate that must adjudicate the charge, needing a two-thirds vote to convict. With strong party support it may be difficult to find a sufficient number of Republican Senators to be swayed, but the process will be partisan and extended, even though House Democratic Committee chairs look to accelerate the timetable for the probe.
Developments related to the release of this Presidential transcript include:
- Demand for the release of call transcripts with Russian President Putin
- Questioning the role of Presidential attorney Rudy Giuliani in meetings with Ukrainian officials
- The resignation of the volunteer Special Envoy to Ukraine, Kurt Volker, who introduced Mr. Giuliani to Ukrainian officials
- And then there is the unintended, or perhaps intentional, consequence of elevating Elizabeth Warren’s campaign as Mr. Biden’s suffers from his reluctant association with Ukraine
The impact of this inquiry on financial markets, along with a new threat to limit Chinese access to US markets, can be substantial. Stocks are somewhat paralyzed, down about 0.5% and it appears investors are shunning companies that lose money, evidenced by WeWork pulling its IPO and Peloton opening at a loss. Most surprising might be the subdued flight to quality as the ten-year Treasury ended the week at 1.68%, down just 4 bps on the week, yet 10 bps above the level when the September debentures for the SBA 504 program were priced.
The Federal Reserve Bank of NY, the branch of the central bank that manages daily oversight of the Treasury market, was active once again in supplying cash for Repurchase Agreement activity. On Friday alone it added $71.7 billion, much of it on a term-basis to alleviate any quarter-end pressures to finance investor positions.
Last week marked the one-year anniversary of the Fed’s next to last rate increase on 9/28/2018 that left the above-mentioned ten-year Treasury at 3.06%. We have since seen one additional increase, and two rate cuts this quarter alone, as the Fed reluctantly reversed course amidst conflicted economic reports and heightened trade tensions.
As previously mentioned, the Fed’s preferred inflation gauge, Personal Consumption Expenditures, increased y/y to 1.8%, but the report also showed household spending increasing by just 0.1% as consumers may be suffering some fatigue, even with increased wage growth. If consumer spending remains soft, it will complicate matters for the Fed which signaled no more rate cuts this year even with market analysts predicting a further decline in rate. A probable cause for that expectation is a defensive posture by investors who are uncertain about trade resolution, geo-political issues in Britain and Hong Kong, and now an Impeachment inquiry.
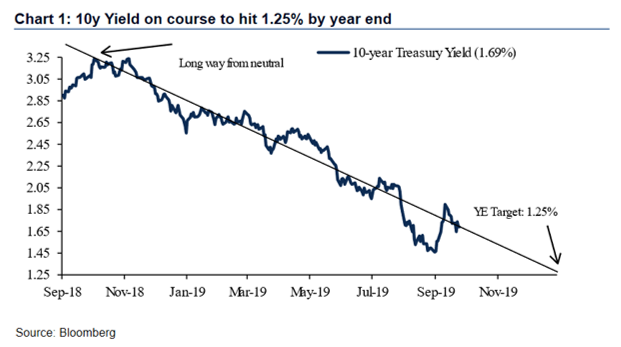
Other reports showed New Home Sales above consensus with an upward revision to July, Durable Goods was +0.2% vs. a forecast of -1.2%, and 2Q19 GDP was unchanged at 2%.
The Week Ahead
Fed speak, a light Treasury calendar, and Friday’s jobs report tops the economic calendar.
Monday – Treasury auctions $87 billion 13 and 26-week Bills
Tuesday – ISM Manufacturing report (a mid- September UAW strike could be a drag on this number)
Thursday – Factory Orders, plus ISM Non-Manufacturing report. Treasury to sell an undetermined amount of 4 and 8-week Bills
Friday – Non-Farm Payroll expected to rebound from last month’s 130,000 report
September 23, 2019
Now, What?
- US-China trade tensions are somewhat relaxed in advance of planned meetings
- Increased sanctions were levied on Iran in response to their drone attack on Saudi oil fields
- The market got its 25 bps rate cut, more than some analysts and FOMC members think was needed, but less than what is desired by the Administration. The rates market response was typical, with the ten-year benchmark Note declining 15 bps on the week, but mostly ahead of the announcement, as seen in this WSJ chart
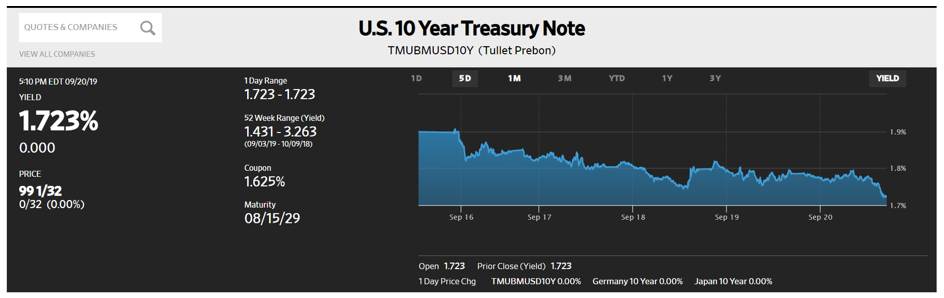
- But not all rates declined as the Federal Reserve Bank needed to provide liquidity to the Repo (Repurchase Agreement) market where investors lend cash to each other on a short-term basis in exchange for high-value assets, like Treasury securities. Starting before Wednesday’s rate cut the cost of money escalated far above previous levels making it much more expensive for firms to finance their positions. After spiking as high as 7% on Tuesday, this overnight funding rate remained as high as 2.25% late in the week even though the new mid-point rate for funds after Wednesday’s cut is 1.875%. This experience reflects too little cash in the financial system and the absence of the Fed’s Quantitative Easing purchases of bonds is one cause of it. Unlike the European Central Bank’s re-introduction of QE, this program is not in the forecast for the Fed so this imbalance may continue, something that could pressure demand for future auctions.
Regarding Wednesday’s Fed action the vote was 7-3, the first time there has been as many as three dissents since September 2016. An indication of that dissent is captured in this recap from the WSJ: “A summary of projections by Fed officials released Wednesday showed five of 17 policy makers see the benchmark federal-funds rate remaining in its current range between 1.75% and 2% through the end of the year. Seven officials see another quarter-point cut, to a range of 1.5% to 1.75%, while five officials expect rates to finish the year where they were before this week, between 2% and 2.25%.” That means all three options are almost equally represented with two more meetings scheduled this year, so we can expect recently strong economic reports to compete with trade negotiations and drone attacks to direct the path for interest rates.
The Week in Review
Economic reports were consistently strong.
Industrial Production was above consensus at +0.6%, with manufacturing surprisingly strong at +0.5%
Housing Starts & Permits were stronger than expected, both in single and multi-family units, with an upward revision to July
Existing Home Sales showed additional strength. The median home price is now $278,200 with a 4.7% gain y/y
The Week Ahead
Fed speak resumes, Treasury to auction $200 billion, and we’ll see if the Fed’s preferred inflation indicator affirms previous week’s gains in CPI and PPI
Monday – Treasury auctions $87 billion in 13 and 26-week Bills; Purchasing Managers Index flash indicator
Tuesday – Treasury sells $40 billion 2-year Notes
Wednesday – New Housing Starts and Treasury sells $41 billion 5-year Notes
Thursday – Third estimate of 2Q2019 GDP expected to be unchanged at 2%; Treasury auctions $32 billion 7-year Notes
Friday – Durable Goods orders expected to be -12% after two strong monthly increases; Personal Income & Outlays expected to show Personal Income +0.4% and core Personal Consumption Expenditures forecast to increase 0.2% and 1.8% y/y
September 16, 2019
Safe-haven Reversal
An overbought market that began the week with a rise in rate saw that move accelerate with stronger than expected inflation data, more Quantitative Easing from the ECB, and enhanced by reciprocal moves by the US and China to ease tariff increases. Defensive trades were off and value investing took hold, allowing domestic stock indices to record a 1% gain for the week and finish with its first three-week winning streak since June while Treasuries had their worst week in three years.
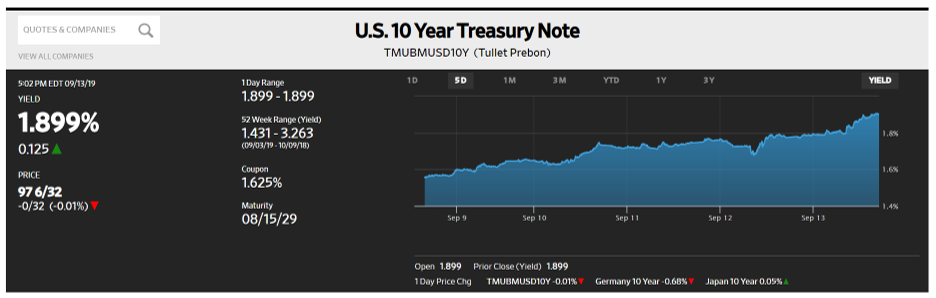
The mood for this activity was captured by a Financial Times columnist, Mike Mackenzie, who wrote on Tuesday, before the move accelerated, about Sovereign bond fatigue: “This (change) cuts to the heart of the debate rippling across markets. Sovereign bonds are currently poised for a cycle-busting recession, whereas the tone of data and central bank easing this year signals only slowing growth and possibly a near-term bottom.”
This captures the dilemma for central bankers and investors concerning markets that are over-extended and economies that need fiscal stimulus and trade resolution. Fiscal stimulus, in particular, was mentioned by ECB President Mario Draghi when he announced a rate cut and a restart to a €2.6 trillion Quantitative Easing program, measures that were not unanimously agreed to by the 25-member council.
Next up for central bankers is this week’s FOMC meeting that markets expect will end with a 25 bps rate cut on Wednesday, but the Fed’s dilemma is deciding if growth will only weaken slightly over the next few years without contracting, and that distinction is critical. A Bloomberg survey of economists shows a median estimate for 2019 GDP to be 2.3%, dropping to 1.8% in 2020. That weakness does not necessarily support recessionary fears and Chairman Powell said last week that “the most likely outlook for our economy remains a favorable one with moderate growth,” and “our main expectation is not at all that there will be a recession.” Such sentiment reflects a cautious approach to rate cuts which the administration endorses as it seeks more monetary stimulus to spur the economy. Adding to that mandate is the drone attack on Saudi oil fields that has halved that country’s production. The President called for more stimulus in its wake while Russia and OPEC recognize an opportunity when they see one and announced no increase in production. The result has been a large spike in the price for Brent crude, but only a modest reentry into safe-haven Treasuries. “Act as appropriate” can be expected to be included in Wednesday’s Fed announcement regardless of how big, if any rate cut is announced.
At 1.899% the benchmark ten-year Treasury ended the week 47 bps higher than where it was on September 2, before it was disclosed that trade talks would be scheduled for next month. That began the reversal, but not before the SBA 504 program was able to price its September debentures at the lowest ongoing effective rates in the program’s history. A snapshot of what has changed since that sale on September 5 shows the difference between that day’s debenture pricing and what a pricing last Friday would have looked like.
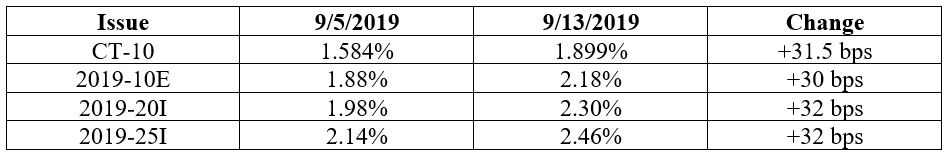
Economic reports that lent support to equity strength were:
Retail Sales above consensus at +0.4%, helped by strong auto sales
CPI +0.3% ex food & energy and +2.4% y/y; both above consensus
PPI +0.3% ex food & energy and +2.3% y/y; both above consensus
The Week Ahead
No Fed speak until Chairman Powell’s press conference Wednesday afternoon, just $99 billion in Treasury auctions, some housing data and Industrial Production
Monday – Treasury auctions $87 billion 13 and 26-week Bills
Tuesday – FOMC meeting begins; Industrial Production expected to be +0.1%
Wednesday – Fed announcement, Chairman Powell press conference and the Committee’s forecast
Thursday – Leading Indicators forecast to be +0.1%; Treasury auctions $12 billion 10-year TIPS
September 9, 2019
A Tale of
Two Economies – with a Manufacturing Index coming in below expectations because of weak export orders. and its counterpart, the Non-Manufacturing Index, coming in above expectations due to strength in the service and business sectors. The weak export orders are a direct result of trade tensions and that situation is having a global impact.
Two Fed Presidents – as the Federal Open Market Committee prepares for its September 18 announcement, where at least a 25 bps cut is expected, different Fed Presidents offered conflicting views on policy. Eric Rosengren, FRB Boston, believes developments in the US Treasury market are tied to economic weakness abroad, which is of less concern to the Fed. The partial inversion of the curve, usually a precursor to recession, is different this time because it is not the result of the Fed raising short-term rates but because of demand for Treasury assets. On the other hand, there is Robert Kaplan, FRB Dallas, who is focused on weakening domestic growth and its need for lower rates now before it is too late. Plus, he is joined by James Ballard, FRB St. Louis, who believes that the Fed should be more aggressive and cut by 50 bps this month.
Back to the economy, we have a weak but still steady jobs report that had a little something for every point of view. Pessimists point to slowing economic growth with manufacturing in a recession, while optimists point to historic job growth and strong consumer spending. This Washington Post chart shows how employment gains in 2019 have slowed as the economy is in the tenth year of its expansion and slower job growth is not an unusual development.
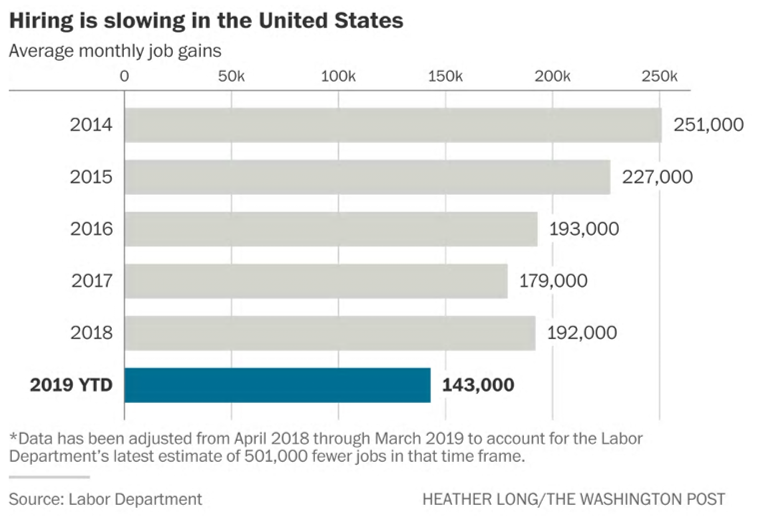
The 130,000 jobs gain for August was below consensus and the more encouraging gain of 195,000 that was in the private sector ADP report on Thursday, but positive items in Friday’s report were:
- Average hourly earnings increased y/y to 3.2%
- Unemployment remains at a 50-year low of 3.7%
- An increase in the number of hours worked
- Civilian Labor Force Participation Rate increased to 63.2%
A Busy Week
As the market was headed to lower rates a surprise announcement to resume trade talks next month gave it pause, sending rates higher and boosting equities which allowed the three major indexes to close higher by at least 1.5% on the week.
Taking advantage of global demand for quality assets the global, investment grade Corporate market saw what was described as a month’s worth of issuance in just three days - $140 billion, with $74 billion of that in the US. This was accomplished without any mega deals as the US activity represented 45 issuers who are utilizing this low rate environment to raise cash to prepay outstanding debt and extend their maturities, much the same as homeowners who are refinancing their mortgages.
And demand for quality assets benefitted the SBA 504 program, which sold $385,364,000 term debentures with very strong subscription levels that permitted pricing at spreads far tighter than comparable Agency CMBS. Below is a chart that shows the 20-year debenture being priced at 1.98%, second lowest in history, while the 25-year debenture was priced at 2.14%. Of particular note is the growth in the 25-year series which last week was 22% larger than the 20-year issue. Both issues provided historically low, ongoing effective rates for small business borrowers of 3.36% and 3.46%, respectively.

Signaling the start of the blackout period for Fed speak ahead of the September 17-18 meeting was Fed Chairman Jay Powell’s speech on Friday in Zurich. He emphasized his comments were personal and did not reflect FOMC opinion, but they did contain references to previous announcements. When asked about future rate increases, he adhered to the standard response that the Committee will “act as appropriate,” and not be influenced by political or trade issues which are not in their domain. He did mention though that trade policy is weighing on the economy as the US deals with low inflation, low growth, and low investment.
The Week Ahead
No Fed speak, $193 billion in Treasury auctions, closing date for September SBA 504 debentures, some inflation data, and then the consumer is heard from again.
Monday – Treasury sells $87 billion 13 and 26- week Bills
Tuesday – Treasury sells $28 billion 52-week Bills and $38 billion three-year Notes
Wednesday – Treasury sells $24 billion ten-year Notes, the 504 debentures fund, and PPI expected to be 0.2% and 2.2% y/y ex food & energy
Thursday – Treasury sells $16 billion thirty-year Bonds, and the ECB addresses monetary policy
Friday – Retail Sales expected to remain strong at 0.3% after a 0.7% gain in July
September 3, 2019
Au Revoir August!
- Stocks End Four-Week Slide
- $17 Trillion and Counting
- Yield Curve More Inverted
Markets breathed a sigh relief that August ended quietly after an escalation of trade war rhetoric roiled markets for much of the month. For the week, Treasury rates were stable, and equities eked out a positive weekly close after China extended an olive branch regarding retaliatory tariffs. President Trump has frequently mentioned the Chinese want to talk, but this official statement was the first from them in advance of tariffs being implemented on Sunday by both sides, but trade talks remain unscheduled.
That soothed global stock markets, allowing them to stabilize and end the week with modest gains. Some consumer companies did stand out, like Target jumping 24%, Lowe’s 11% and Neville Brands, the maker of Sharpies, up 17%. For the month though, stock indexes were down almost 2%.
Demand for safe-haven assets continues, with sovereign debt trading at negative yields now totaling $17 trillion, and Japan accounts for almost half that figure and is responsible for the phrase Japanification, something that is more troubling to economies than a mere recession that inverted yield curves traditionally foreshadow. Analysts fear other economies could mimic Japan’s 30-year battle with slow growth, low inflation, and persistently low bond rates, so it is hoped that the remaining countries with positive yields maintain that status.
The two-year/ten-year Treasury curve has flirted with inversion in recent weeks but has now moved clearly negative, ending the week at -1.1 bps.
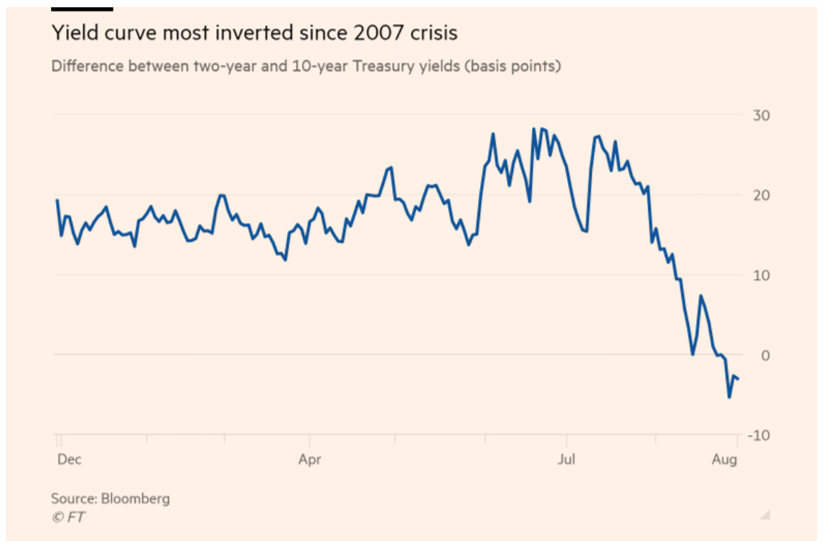
Speaking of changes, this WSJ chart shows the 114 bps decline this year in the ten-year Treasury rate, and 18 bps in August alone, as the SBA 504 program prepares to price its September debentures on Thursday. An indication of how much the market has anticipated future rate cuts is that 114 bps move occurred with one 25 bps reduction and has moved the 30-year bond below 2%, closing the week at 1.96%. What this means is the entire Treasury curve offers investors income that is below the 1.98% dividend yield on shares in the S&P 500 index.
Driving some of that demand for longer-term Treasuries could be increased prepayments in mortgage backed securities resulting from homeowners refinancing their mortgages that pay off those securities faster, forcing their holders to replace that income as quickly as possible.

In international news, Argentina announced it will look to restructure $101 billion of debt after “technically” defaulting on $7 billion of short-term securities, and a Chinese bank citing loan losses will skip a year’s worth of interest payments to international bond holders. It also reported that its non-performing loan ratio has reached 6.88%.
Last Week’s Reports
Durable Goods showed a strong +2.1% reading thanks to transportation orders, aircraft in particular.
2Q19 GDP showed a slight decline to 2.0% but with strong consumer spending keeping the number at consensus.
Personal Income was +0.1% and the Fed’s preferred, core inflation gauge was flat at +0.2% and 1.6% y/y.
Consumer sentiment report on Friday showed a dramatic drop from 92.1 to 89.8, its lowest reading in three years and a troubling indicator for an economy so dependent on consumer spending.
The Week Ahead
A light Treasury calendar; heavy Fed speak; some manufacturing reports; the SBA 504 program prices its 10, 20, and 25-year debentures; and the all-important jobs report.
Monday – Treasury auctions $87 billion of 13 and 26-week Bills
Thursday – Factory Orders expected to be up 1%; the SBA 504 program prices its September debentures
Friday – Non-Farm Payroll forecast to be slightly lower at 158,000; Fed Chairman Jay Powell speaks in Zurich on Economic Opportunity and Monetary Policy
August 26, 2019
One Crazy Day of Tariff Tirades
As much as Chairman Powell’s Friday speech was anticipated, and had pretty much frozen the markets in the run up to it, his comments that the Fed will continue to provide stimulus but warning that trade policy uncertainty is creating challenges, signaled that the market should not expect the deep interest rate cuts as requested by the President. Reaction was muted until President Trump took to Twitter to challenge the “weak Fed”, sending Treasury rates down, inverting the curve further, and plunging stock indexes which fell for the fourth consecutive week.
The President then directed American companies to start looking for alternatives to trading with China, prompting a US Chamber of Commerce executive to remind everyone the answer isn’t for American companies to ignore a country with 1.4 billion customers. In a retaliatory effort, President Xi announced a new 5% tariff on American oil imports after having started the day with an imposition of tariffs on $75 billion of American goods.
For good measure, after the markets closed, the President tweeted that he was escalating the trade war further, applying a 15% tariff on $300 billion worth of Chinese goods starting October 1 and raising the rate on $250 billion of imports to 30% from 25%.
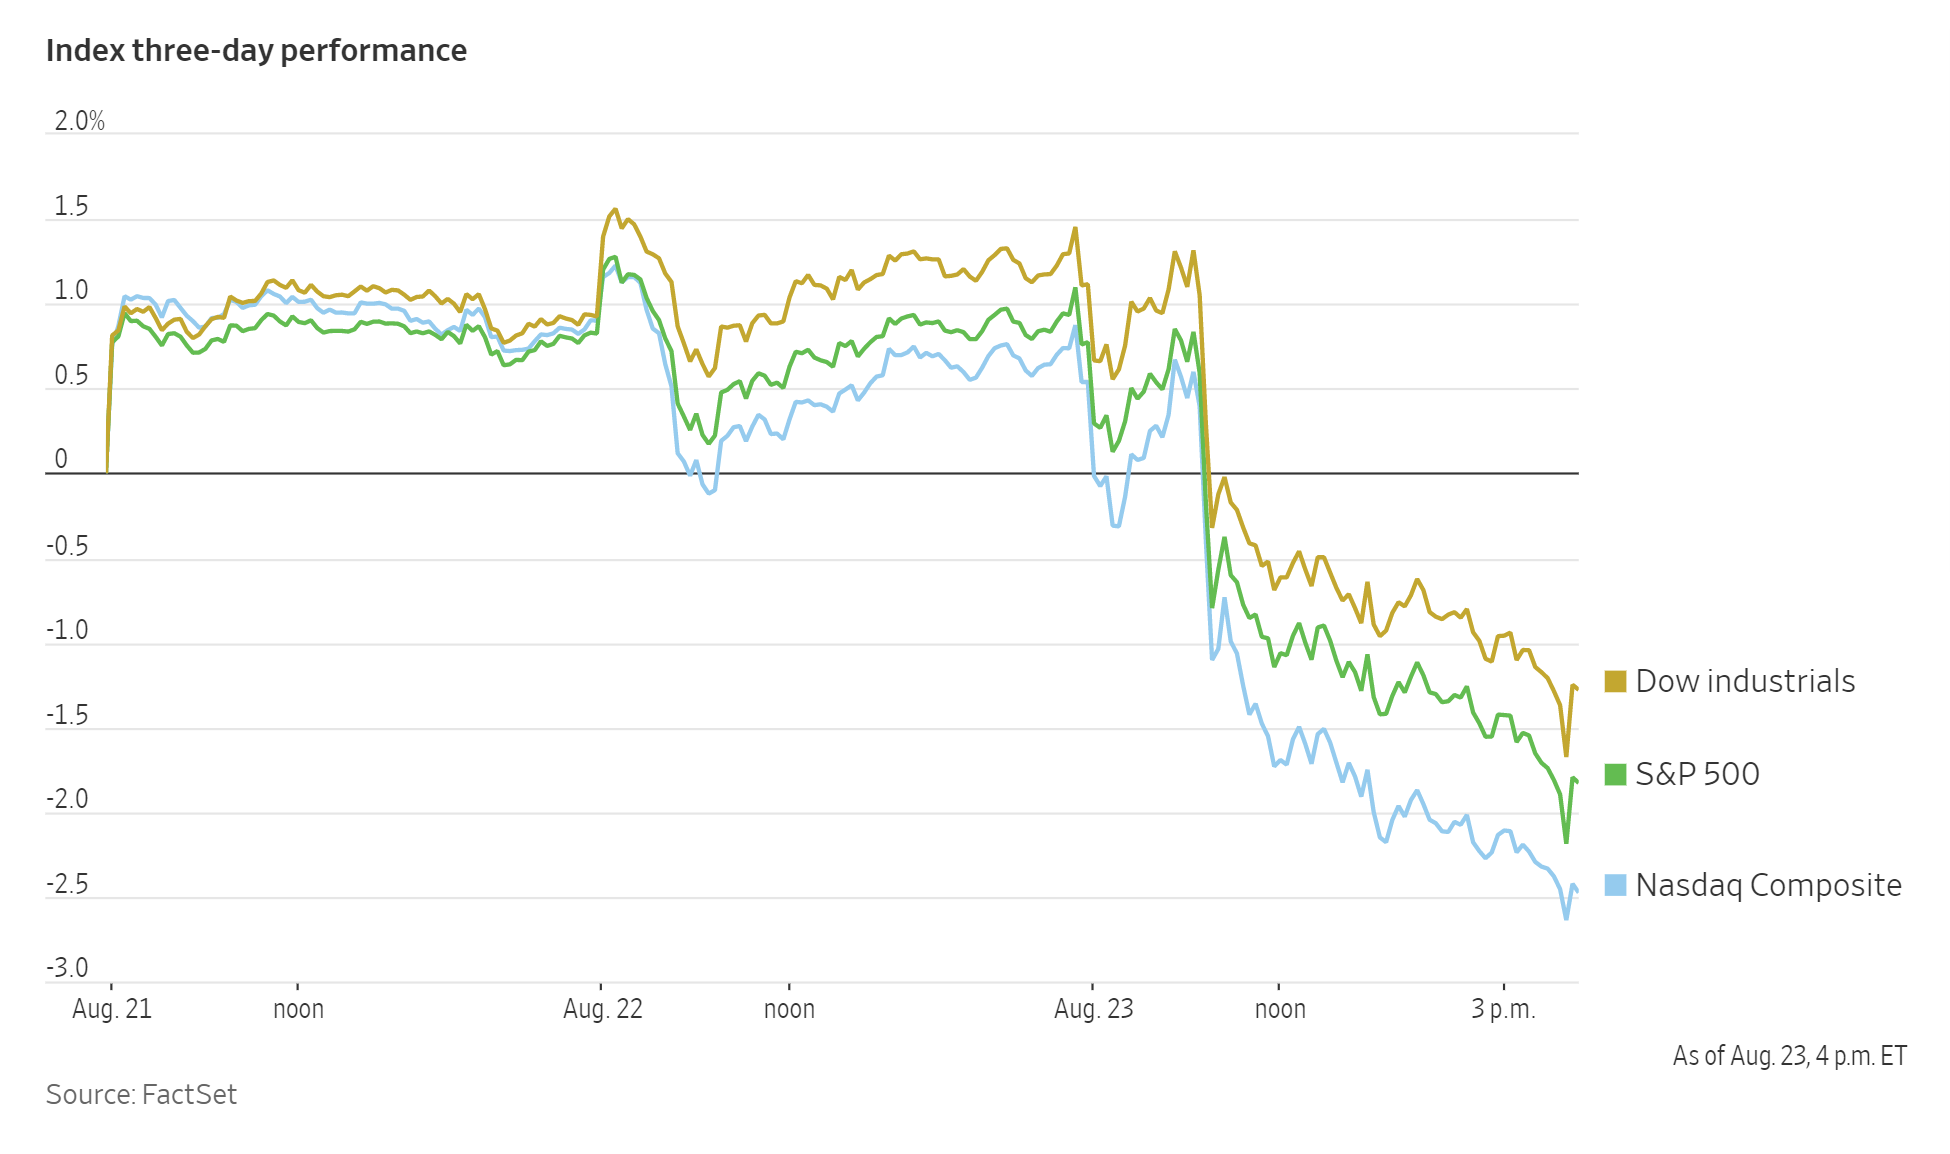
The disconnect between reserved central bankers and foreign trade policy is global in nature, as Bank of England governor Mark Carney, another attendee at Jackson Hole, described the limited ability to use monetary policy to offset the damage expected from Britain’s possibly messy exit from the European Union.
So, we have the benchmark ten-year Treasury trading at its lowest end of day rate (1.52%) in three years and an escalating trade war that may not be as serious as the 2008 financial crisis, but is different in that central bank tools were better suited to address that crisis while there is little they can do in a trade war. One analyst noted that interest rate cuts to address trade policy issues is like giving pain relievers to someone with a broken bone - “better to have than not, but unable to solve the underlying problem.”
Earlier in the week the release of minutes from the July 31 FOMC meeting identified that rate cut as a “recalibration”, not the onset of an easing cycle so the market seemed prepared for Chairman Powell’s speech, but not for the President’s comments, and they will continue to be the driving force going forward.
The Week Ahead
Fed speak resumes, some housing data, the Fed’s preferred inflation gauge on Friday, and Treasury auctions $227 billion of debt.
Monday – Durable Goods expected to be 1.1%; Treasury sells $87 billion 13 and 26-week Bills
Tuesday – $40 billion two-year Treasury note sale
Wednesday – Treasury sells $18 billion two-year Floating Rate Notes and $41 billion five-year Notes
Thursday – Release of second estimate of 2Q19 GDP expected to be 2%, and $41 billion seven-year Notes are auctioned
Friday – Personal Income & Outlays core price index expected to be 0.2%, 1.5% y/y
August 19, 2019
Anticipation
The markets are expressing impatience for central bank policy as you can see in this Financial Times chart that shows the difference between where the Fed’s main rate of 2.10% is now after last month’s rate cut, and where traders expect it to be next year.
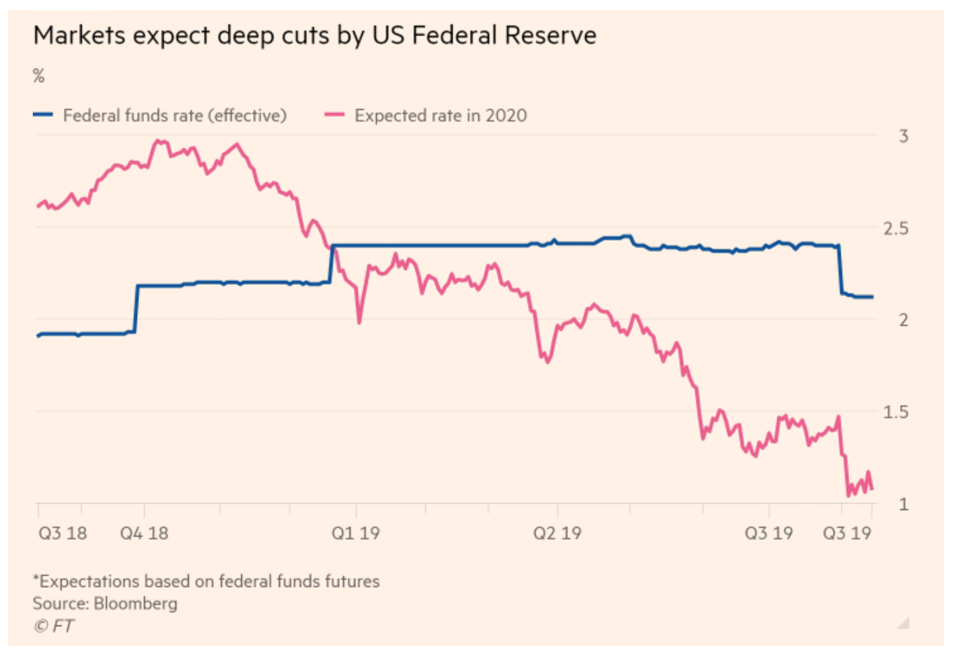
Now, the market anticipates multiple rate cuts going forward as we have seen equity prices lower for three straight weeks and the benchmark ten-year Treasury yield lower by 46 bps this month alone. The result has been an inversion in some sections of the yield curve, a negative real yield on the ten-year benchmark (1.56% less current inflation rate), and renewed fears that the inversion portends a recession sometime next year.
Two small caveats to that implication are: the emphasis that Treasury has placed on funding more debt in the front-end of the curve, creating more supply in short-term securities and less in the longer maturities that have been in demand; and, it seems longer ago, but in September 2012 DCPC 2012 20I was priced off the ten-year benchmark rate of 1.55% and it seemed rates were headed lower. The following Spring a “taper tantrum” led a U-turn in rates and in September 2013 that benchmark rate was 140 bps higher. That is not to suggest we near such a move now, only a reminder that the rates market appears ahead of itself and any improvement in trade negotiations could be a game changer.
Recent market performance illustrates the limits of central bank policy as low, even negative interest rates for a prolonged time have failed to strengthen the global economy, so they alone are not the answer. Resolution of trade disputes, expansive fiscal policies, and increased corporate investment are needed to reverse recent trends
The Week in Review
- Equity markets recovered from a shaky start when the recently announced tariffs were delayed until December
- That didn’t last long as the DJIA dropped 3% on Wednesday in its biggest drop of the year as Treasury yields declined with some of the curve inverting and the 30-year bond trading as low as 2%
- Equities recovered to close the week -1.5% and Treasury rates rose, but the ten-year benchmark closed 18 bps lower on the week at 1.56%, 20 bps lower than when the 504 program priced its August debentures eleven days ago
- Argentina saw its peso devalue 25% in one day while its stock index declined 37% after a shock result in its political primary process
- The budget deficit is expected to reach $1 trillion
- A stronger than expected Retail Sales number (possibly helped by Amazon Prime Day) soothed concerns and helped equities rally to close out the week. One impact of this was an upward revision for 3Q19 GDP to 2.2% by the FRB Atlanta, from 1.8%
Upside Down
In a world where low inflation is a puzzle and $15 trillion of sovereign debt trades at negative yields, this may be the most confusing item to ponder – a Danish bank this week launched the world’s first negative rate mortgage, where a home buyer can pay back less than what they pay for their house.
The Week Ahead
A light calendar for Treasury and Fed speak, though Chairman Powell has a significant speech Friday at the Jackson Hole Economic Symposium. His timely topic is “Challenges for Monetary Policy.”
Monday – Treasury sells $87 billion 13 and 26-week Bills
Wednesday – Release of the FOMC minutes from the July 31 meeting
Thursday – Treasury auctions $7 billion of 30-year TIPS
Friday – Jay Powell speaks in Wyoming
August 12, 2019
A Sigh of Relief – For Now
Markets exhaled on Friday as stocks closed the week marginally down after some tumultuous sessions resulting from the heightened US-China trade tensions. This WSJ chart shows the dramatic drops before sustaining a recovery on Thursday when China’s central bank stabilized its currency by fixing its mid-point at a less aggressive level than had been expected. That diffused criticism that the country was manipulating its currency in retaliation to the recently expanded tariffs.
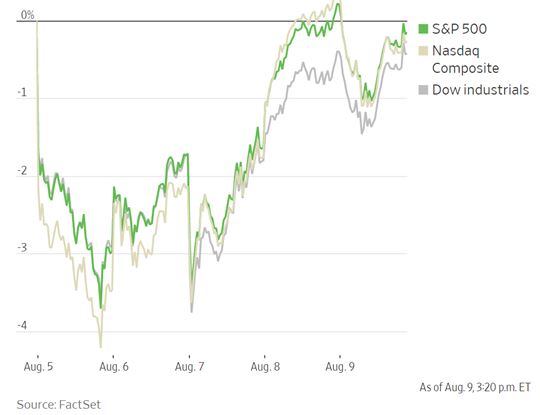
As stocks were being punished, Treasury securities rallied with the ten-year benchmark Note trading as low as 1.61% before the currency stabilization gave support to stocks and temporarily curtailed the safe-haven trade. Settling back to 1.726% on Thursday, the SBA 504 program was able to price its two debentures at 2.15% (20-years) and 2.31% (25-years) respectively. That is the lowest 20-year rate since September 2016 and produced an ongoing effective rate for small business borrowers of 3.53%, 172 bps lower than Prime Rate, while the 25-year effective rate was 3.63%, a difference of 162 bps. Both represent significant savings, even after the recent 25-bps rate cut and are dramatically cheaper than just one year ago when their effective rates were 30 and 35-bps above the Prime Rate, as shown in the chart below.
With regard to the August debenture rates, it should be noted that in a week of heightened turmoil and wider credit spreads, both issues were priced essentially at unchanged spreads from the previous month
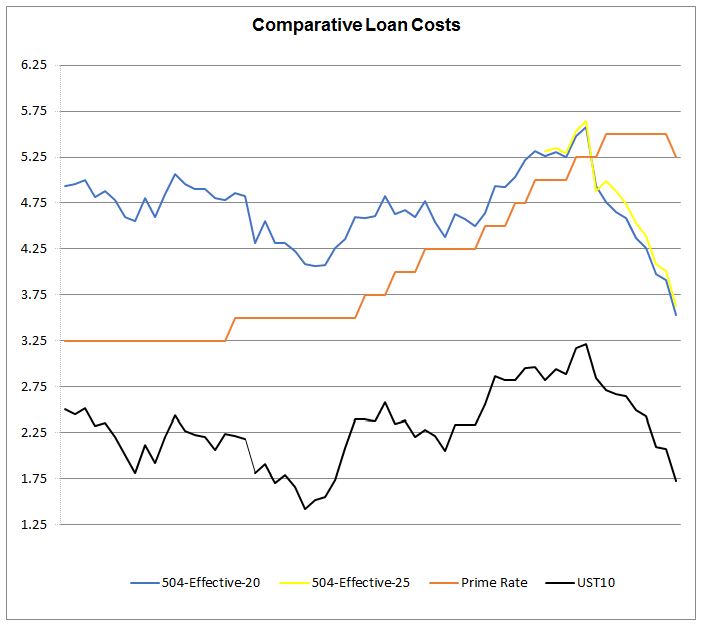
Other developments last week were:
- Oil continues to slump due to economic uncertainty, with Brent crude down 21% since April
- Ahead of Brexit the UK economy declined for the first time in seven years (0.2%), and its currency is down 4.5% vs. US$ since July
- Germany, the EU’s largest economy, saw industrial output in June decline more than forecast, 1.5%, stoking fears the country could be headed for a recession
- China faces internal turmoil with continued protests in Hong Kong forcing the airport to shut down
- Japan and South Korea have their own trade tensions involving responsible investing
- Demand for last week’s Treasury auctions was tepid but a series of Occidental Petroleum bonds saw as much as $78 billion in orders for $13 billion of bonds offering yields as much as +185 bps to benchmark Treasuries
- PPI, ex food & energy, came in at -0.1%, and 2.1% y/y, both below forecast
The Week Ahead
Some Fed speak with a light calendar for economic reports and Treasury debt.
Monday – Treasury auctions $84 billion thirteen- and twenty-six-week Bills
Tuesday – Treasury sells $28 billion fifty-two-week Bills; CPI ex food & energy expected to be 0.2%, 2.1% y/y
Wednesday – the SBA 504 program funds $310,591,000 from its August debenture sales
Thursday – Retail Sales expected to be 0.3% and Industrial Production forecast as 0.1%
August 5, 2019
Tariffs Trump Fed
Things were peaceful after the expected and first rate cut in eleven-years, with Treasury rates slightly improved and equities encouraged by the prospect of another cut later this year. And then they weren’t. On Thursday President Trump announced a 10% tariff on an additional $300 billion of Chinese goods, pushing investors back into government guaranteed debt as a safe-haven trade. The benchmark ten-year Treasury closed the week near its lowest level since 2016 and even the thirty-year German bund dipped into negative yield, with Germany joining Denmark and Switzerland as countries whose entire yield curve is negative, meaning if investors hold their debt to maturity, they will never receive their original investment in return. At 1.846%, this benchmark note is 23 bps lower than when the SBA 504 program priced its July debentures.
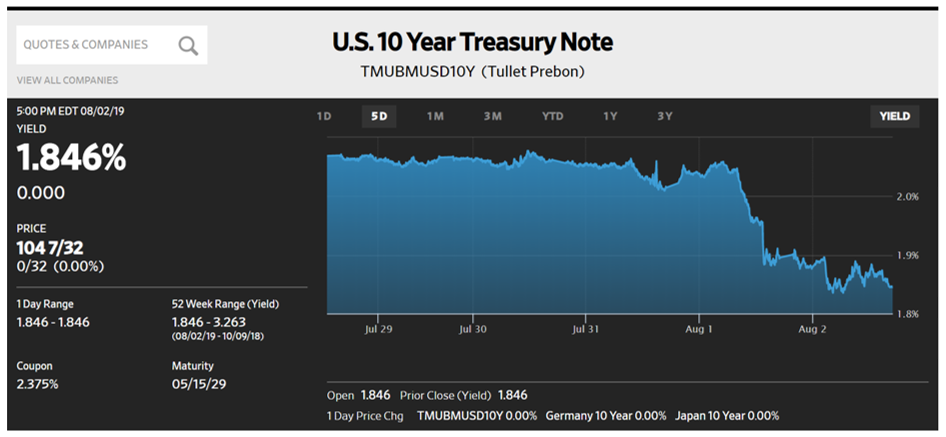
These proposed tariffs add to the existing 25% tariffs on $250 billion of Chinese imports and further dampen any hope for resolving trade tensions in the near future. Talks don’t resume until September and the President has already stated he believes the Chinese may wait until after next year’s election before resolving the issues.
Have the tariffs had an impact yet?
- Mexico is now the top trading partner with the US for the first half of the year, supplanting China for the first time since 2015
- Imports from China dropped 12% while exports to China fell 19%
- These results affirm a principle that states tariffs on imports ultimately end up acting as a tax on exports, leaving America’s trade gap for the first half year at $316 billion, 7.9% wider than a year earlier
Add heightened concerns about a no-deal Brexit and weak growth in Europe as contributing factors to equities suffering their worst week this year. Major domestic exchanges in the US suffered declines ranging from 2.6% to 3.9% and will remain unsettled for a while. Ironically, in his comments after Wednesday’s announcement Chairman Powell identified “trade policy uncertainty being more elevated than we expected” as part of the reason for the Fed’s action. Additional reference to this cut not being the start of an easing cycle, perhaps a mini cycle, disappointed some analysts who hoped for a more assertive reference to future moves.
Lending support to the FOMC decision to cut rates was the Personal Income & Outlays inflation gauge showing a 0.2% gain in its core reading, and just 1.6% y/y, further below the Committee’s 2% target than before. Lost in Friday’s price action was a solid jobs report of 164,000 with the unemployment rate holding steady at 3.7% and with private sector average hourly wages rising to 3.2% y/y. This current US expansion became the longest on record in July but as 2Q19 GDP indicated, it is slowing down. Manufacturing output and business spending are in decline and those indicators, not so much the President’s criticism, possibly cautioned the Committee to make what some analysts call an “insurance cut.”
Small Business Job Growth
Though this Paychex Small Business Employment Watch chart reflects a tight labor market, showing a continued decline in its index, it reported increases in hourly earnings and weekly hours worked. The data is taken from 350,000 small business clients and reflects a 2.76% increase in hourly earnings.
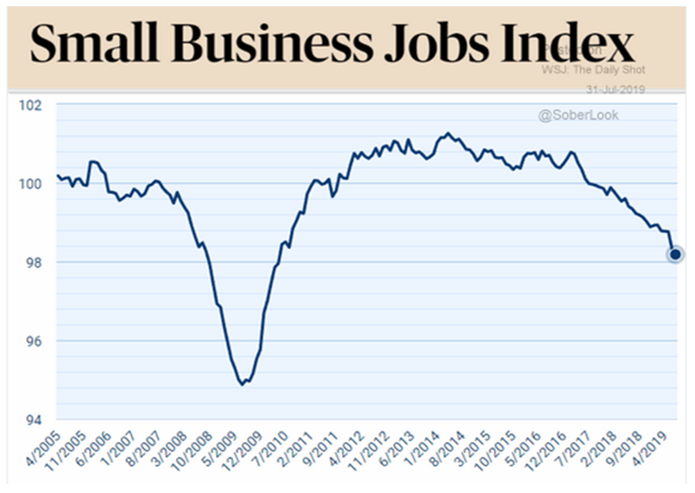
The Week Ahead
Fed speak resumes, Treasury to auction $162 billion in debt, the SBA 504 program prices its 20 and 25-year debentures, and some economic data.
Monday – Treasury to sell $78 billion 13 and 26-week Bills; ISM non-manufacturing report expected to be stable
Tuesday – Treasury sells $38 billion three-year Notes
Wednesday – Treasury sells $27 billion ten-year Notes
Thursday – Treasury sells $19 billion thirty-year Bonds and the 504 program prices 2019 20H and 2019 25-H
Friday – PPI expected to be 0.2% and 2.4% y/y
July 29, 2019
Waiting for the Fed
Interest rates moved sideways in advance of Wednesday’s expected 25 bps rate cut by the Fed, for which the market assigns an 81% probability; and both the S&P 500 index and NASDAQ hit record highs with strong earnings reports.
At 2.07%, the ten-year benchmark Treasury is within 2 bps of where the last two debenture sales were priced, and analysts expect the effect of the cut is already priced into the market so language from the announcement and Chairman Powell’s press conference will be important. Rates had been lower earlier in the week but the ECB policy announcement disappointed, containing nothing meaningful, but with language that strongly suggested future moves could be taken.
With no Fed speak, headlines did the talking last week:
- Chinese money dries up – Direct investment in the US has dropped to $5.4 billion in 2018 from a peak of $46.5 billion in 2016
- SIFMA reports that trade tensions are driving a sharper than expected slowdown in global trade
- IMF revised its forecast for global growth down 0.01% to 3.2%, citing Brexit as a contributing factor. This is down sharply from last year’s forecast of 3.6%
- Mario Draghi, outgoing President of the ECB, “expects rates to remain at present or lower levels.” Following the ECB announcement there was criticism that the bank has no sense of urgency and has failed to lay out concrete plans to provide stimulus
- The first estimate for 2Q19 GDP came in above estimate at 2.1%, down sharply (as expected) from 1Q19 at 3.1%. Strong consumer spending was credited for the above forecast performance, but business investment declined to 0.6% from 4.4% in Q1
This category of non-residential fixed investment reflects spending on software, research and development, equipment and structures, and it is feared the decline represents the uncertainty crested by the trade tension with China. That tension may be extended as President Trump announced that China may wait until after next year’s election to finalize a deal. The President also challenged the World Trade Organization to compel certain countries – China, Mexico, Turkey, and Qatar to name a few, to drop their designation of “developing countries,” a description that permits them export subsidies and procedural advantages for WTO disputes.
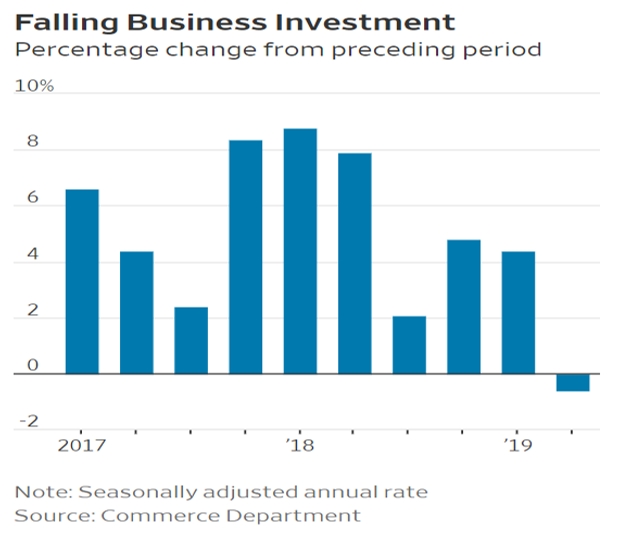
Economic reports other than GDP showed Durable Goods rising 2.0%, but with May’s number revised down an additional 0.8% to -2.3%.
The Week Ahead
All eyes on Wednesday’s FOMC announcement, light Treasury issuance, and key inflation and jobs reports.
Monday – Treasury auctions $72 billion of 13 and 26-week Bills
Tuesday – Personal Income and Outlays contains the Fed’s preferred core inflation gauge, expected to be +0.2%, +1.7% y/y
Wednesday – FOMC announcement, followed by Chairman Powell’s press conference
Friday – Non-Farm Payroll expected to be 156,000
July 22, 2019
Marking Time Until FOMC Meeting
Equities ended the week lower, as were Treasury yields (CT-10 @ 2.06%), as every indication points to just a 25 bps rate cut from the Fed on July 31. Though up more than 1% for July, the three major domestic exchanges are torn between mixed corporate earnings reports and uncertainty over central bank policy.
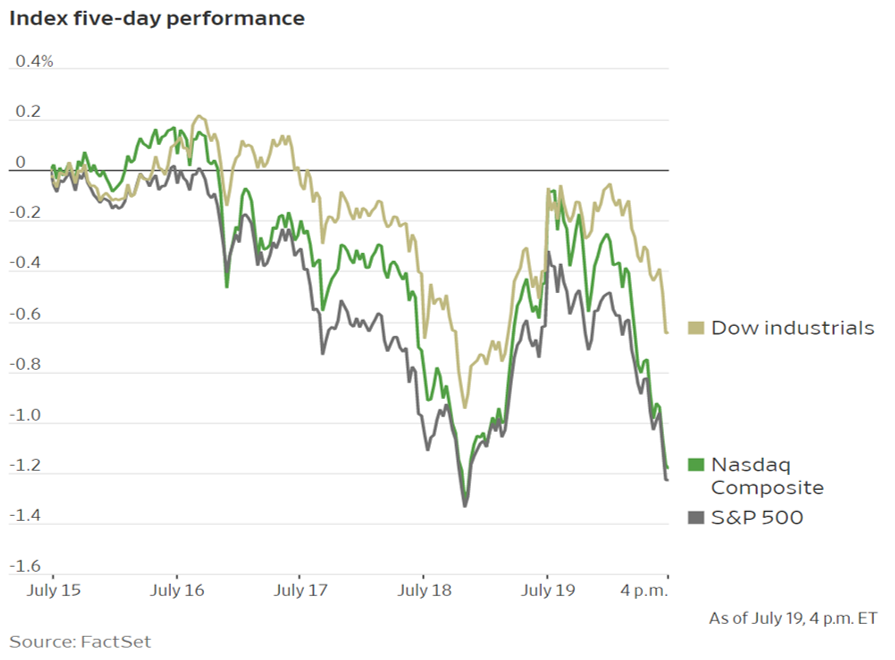
And US markets are not alone, as the ECB meets shortly to shape its policy that is expected to result in a further reduction of its deposit rate to -0.50%. That rate compares to the US rate (Interest on Excess Reserves) of 2.35%.
Regarding that IOER rate, it is lower than what mutual funds charge to lend money overnight to bond brokers (2.47%) who use Treasury securities as collateral. This condition results from the increased supply of bonds in the overnight market, a reflection of increased Treasury funding needs.
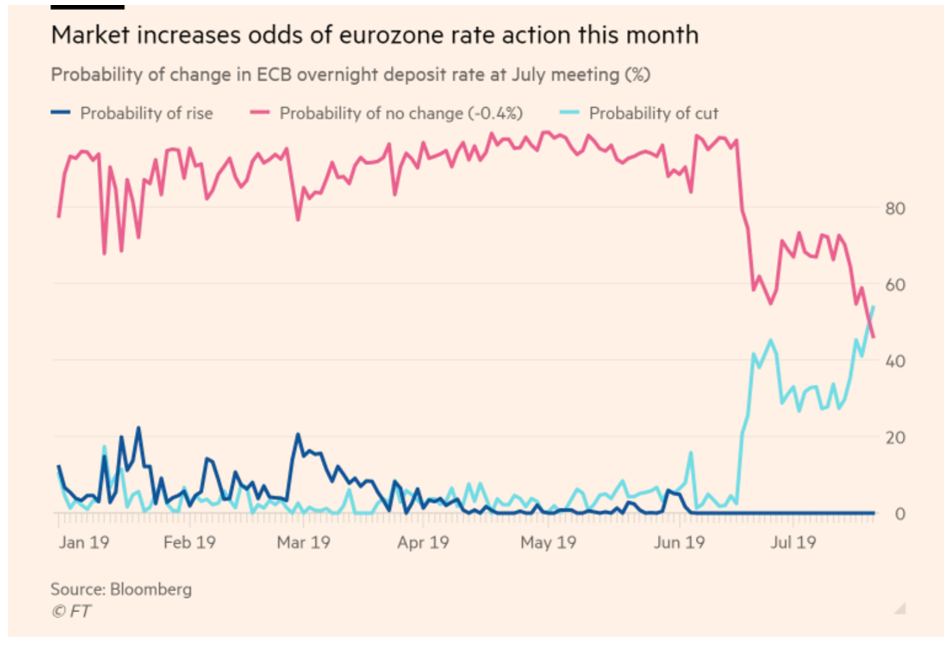
The Week in Review
China did report 2Q19 GDP as 6.2%, its lowest rate in almost 30 years. A deeper slowdown was avoided by increased domestic consumption, something the government has promoted to offset decreased emphasis on its exports trade.
Sub-zero sovereign debt enabled Greece to sell 7-year bonds at 1.90%, more than 100 bps tighter in spread to German benchmarks than during a March sale. Such was the demand for it that $13 billion in orders were received for the $2.5 billion issue.
Retail Sales came in stronger at 0.4% than its 0.1% forecast.
Industrial Production was flat vs. a 0.1% consensus.
The Week Ahead
No Fed speak as part of its 2-week blackout ahead of the July 30-31 FOMC meeting, $205 billion in Treasury auctions, some housing data, and the first estimate of 2Q19 GDP. There will be meetings to reach an agreement on US government borrowing and spending limits.
Monday – Treasury auctions $72 billion 13 and 26-week Bills
Tuesday – Treasury auctions $40 billion 2-year Notes
Wednesday – Treasury auctions $20 Billion 2-year Floating Rate Notes and $41 billion 5-year Notes
Thursday – Durable Goods expected to recover to +0.7% from -1.3% last month; Treasury sells $32 billion 7-year Notes
Friday – 2Q19 GDP expected to be 1.9%, a decline reflecting reduced net exports
July 15, 2019
Chairman Powell Signals Rate Cut
In testimony before Congress, Jay Powell reiterated the Fed’s intention to “act as appropriate to sustain the expansion.” That confirmed market expectations for at least a 25 bps cut with the impact felt by shorter dated securities, steepening the 2/10 Treasury curve by 10 bps. It seems market sentiment now fully embraces the thought that it no longer is if the Fed will cut rates, but when and by how much.
The current range of Fed Funds rates is 2.25% - 2.50% (2.375% mid-point) and this Financial Times chart shows that financial futures contracts have already assumed a mid-point for future policy to be around 1.75% by January, meaning 50 bps in cuts is expected over time, and possibly more.
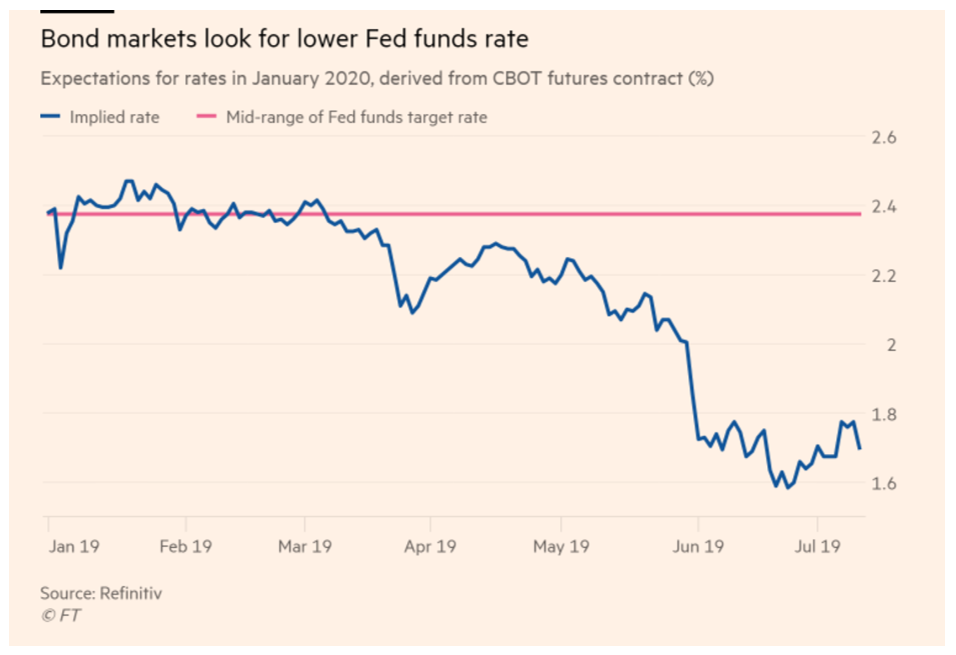
The best performers on the week were short-term Treasuries (which benefit most from a rate cut) and equities where the S&P 500 Index closed above 3,000 for the first time and the DJIA above 27,000, also for the first time. Major indexes are up 2.4% in July, adding to large gains in June, even as worries about the global economy remain.
Lower Still
July’s debenture rates for the SBA 504 program continue to reflect the change in Fed policy, producing impressive ongoing, effective cost of funds to small business borrowers.
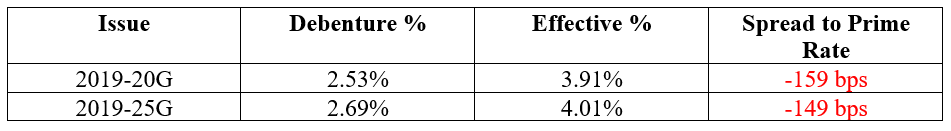
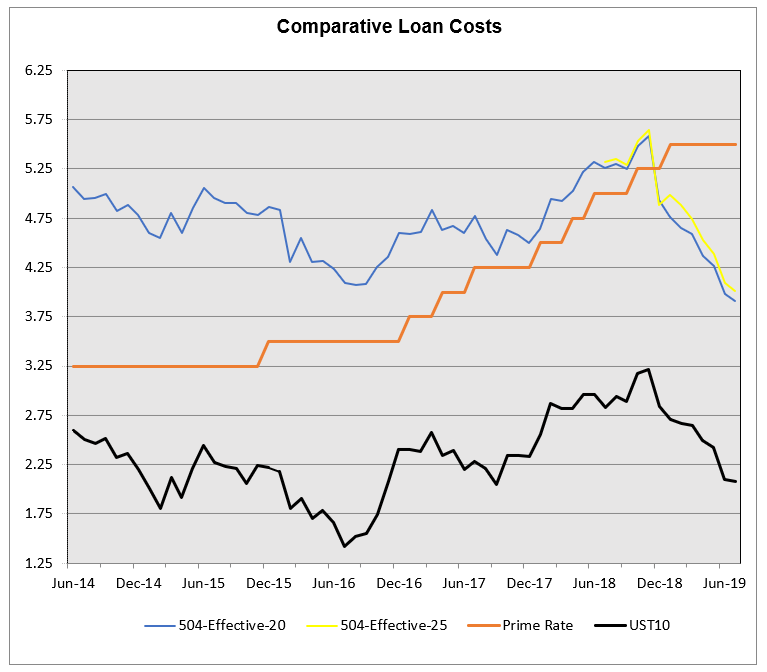
Should you Fight the Fed?
Because falling rates are good for stocks it is easy to see why investors are bullish. Of concern is softening economic data, projections for lower GDP, unresolved trade disputes, and Brexit. If economic growth is slowing faster than Fed estimates, investors may want to reconsider which side of the fight to be on between the Fed and a possible recession.
The Week in Review
Both core CPI and PPI came in 0.1% higher than expected at 2.1% and 2.3% respectively, y/y. Globally, Singapore’s trade dependent economy contracted 3.4% in Q2 and China’s exports declined 1.3% in June, indicating the trade war is starting to have an impact. Additionally, imports fell 7.3%.
The Week Ahead
Fed speak, some economic data, and Treasury to sell $112 billion of debt
Monday – Treasury auctions $72 billion 13 and 26-week Bills; China announces 2Q19 GDP, expected to decline to 6.2%
Tuesday – Treasury sells $26 billion 52-week Bills
Wednesday – Retail Sales and Industrial Production are both projected to be 0.1%; 504 debenture sales fund
Thursday – Treasury sells $14 billion ten-year TIPS
July 8, 2019
On Course, Maybe a Bit Slower
A holiday shortened week saw robust trade activity change course after Friday’s stronger than expected jobs report. A gain of 224,000 with increased labor force participation was not forecast and pushed the benchmark ten-year Treasury yield back above 2% to close the week at 2.04%. The 9 bps move was the largest one-day increase in rate since January 4, and while the reason for it lessens optimism about Fed policy a dramatic further increase is unlikely unless the Fed reverses course again.
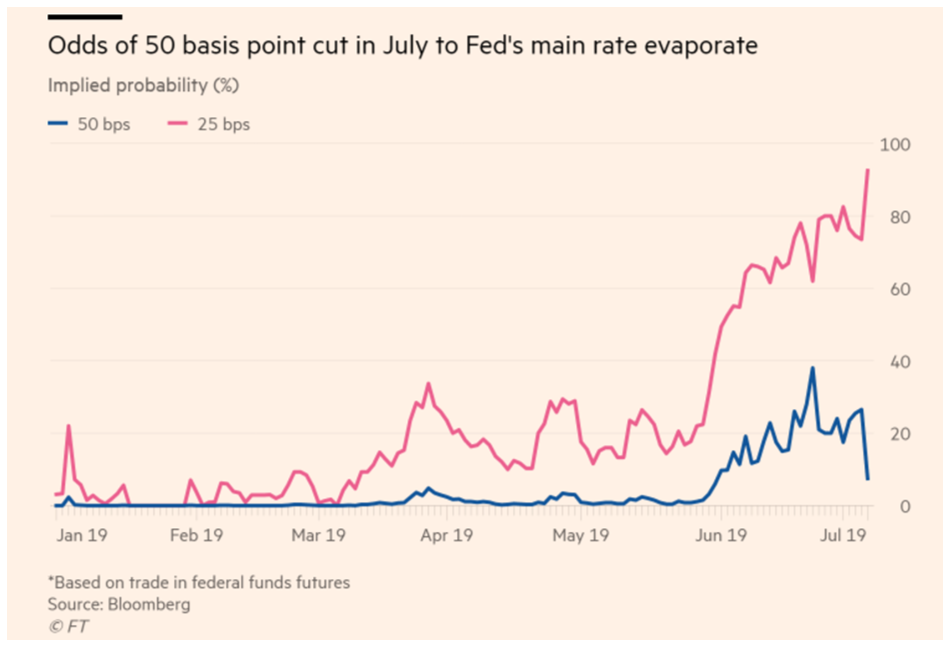
This Financial Times chart shows expectations of a 50 bps cut this month have now declined to a 11% probability while the chances of a smaller 25 bps cut have increased to 89% from 70%. Even with Friday’s selloff, the benchmark ten-year Note remains 6 bps lower than it was for last month’s 504 debenture sales.
Stocks maintained their parallel performance with bonds by slipping on Friday but registering weekly gains from 1.2% for the Dow to as much as 1.9% for NASDAQ.
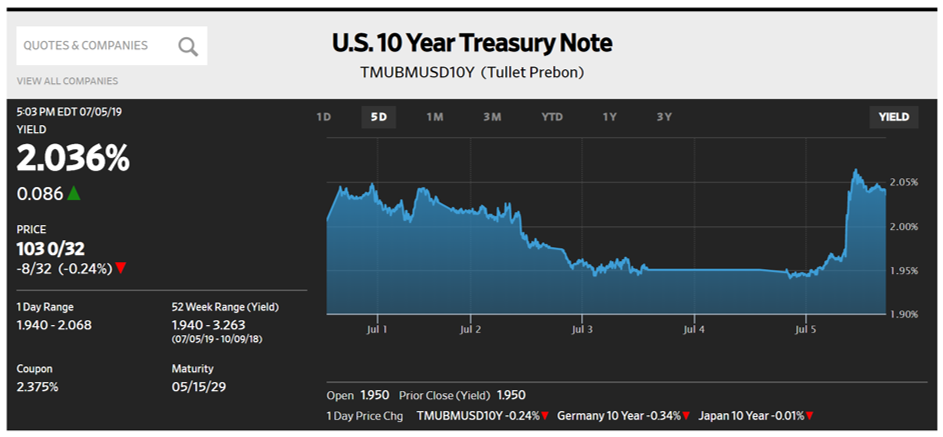
Friday’s jobs report was strong throughout: +224,000 jobs, Participation Rate up 0.1% to 62.9%, and average hourly earnings +0.2%, +3.2% y/y. Through the first six-months average monthly gains are 172,000 vs. 223,000 for the previous year and it is that slowdown that the Fed is closely monitoring. The only other report of note last week was Institute of Supply Management showing at 51.7, slightly lower than the previous month but not as weak as forecast.
The Week Ahead
The SBA 504 program prices its 10, 20 and 25-year debentures, a lot of Fed speak with Minutes from the last meeting, some inflation data, and Treasury’s quarterly refunding.
Monday – Treasury auctions $72 billion 13 and 26-week Bills
Tuesday – Treasury sells $38 billion three-year Notes
Wednesday – Minutes of the June 19 FOMC meeting are released; Treasury sells $24 billion ten-year Notes
Thursday – CPI core expected to be 0.2%, 2% y/y; Treasury sells $16 billion thirty-year Bonds
Friday – PPI core expected to be 0.2%, 2.2% y/y
July 1, 2019
Trade Tension Reduced, a little
Last week saw the S&P 500 Index close its best first half year performance in 22-years and US stocks had their best June since 1955. After a meeting with President Xi of China, President Trump halted any increase on Chinese tariffs and relaxed the ban on American companies doing business with Huawei while China agreed to increase its purchase of farm products. A positive step for sure, but a final agreement is what markets seek.
It is not only stocks that have been robust:
- US Treasuries continue to hold gains in anticipation of a possible rate cut this month, partly driven by a surge of $25 billion into fixed income exchange traded funds in June
- Oil has gained 15% from its June low
- Gold has asserted itself as a safe-haven trade, gaining 6% in June and 10% YTD
- For the first time since March 2015 the ten-year Treasury rate has declined for three consecutive quarters, ending last week at 2.01% in full anticipation of a 25 bps rate cut later this month by the Fed, and possibly a cut as large as 50 bps
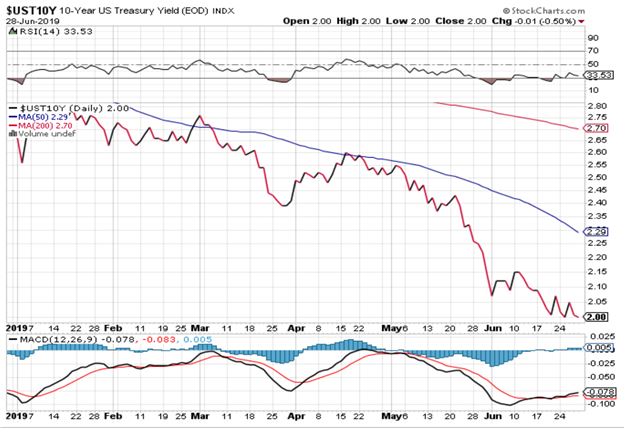
So, the stage is set for the Fed at its meeting that ends the last day of this month, and the above YTD Stockcharts.com chart shows just how much this policy change is already in place.
Greater Fool Theory
According to Investopedia, “The greater fool theory states that it is possible to make money by buying securities, whether or not they are overvalued, by selling them for a profit at a later date. This is because there will always be someone (i.e. a bigger or greater fool) who is willing to pay a higher price.” Austria just sold €1 billion of 100-year bonds at a yield of 1.2%, so at least the yield is positive, even if not fully realized in an investor’s lifetime. Presently, there is $12.5 trillion of sovereign debt trading at negative yields, and as a Financial Times columnist points out “if you hold to maturity, there are no number of lifetimes in which you recoup your initial capital. You just lose less than you might elsewhere, which, conceivably is a kind of gain, depending on what happens to everyone else.”
Bank of England President Mark Carney identified what can happen to everyone else when he identified funds that “have pushed into a host of risky investments that are built on a lie,” and possess scant liquidity. In previous statements Mr. Carney estimated $30 trillion is at risk in this “Wall of Worry,” the result of investors seeking yield in a low interest rate environment.
Economic reports were again mixed; New Home Sales came in far below consensus with median price down 8.1% to $308,000 and the third estimate of 1Q19 GDP was unchanged at 3.1%, with retail consumer spending below forecast.
The Week Ahead
The holiday shortened week is light on Fed speak, Treasury and ACMBS supply, and reports.
Monday – Treasury to auction $72 billion in 13 and 26-week Bills; Institute of Supply Management expected to be down slightly
Thursday – Happy Independence Day!
Friday – Non-Farm Payroll forecast to be 165,000, recovering from the May report of 75,000. Unemployment to be unchanged at 3.6% and Average Hourly Gains to remain 3.2% y/y
June 24, 2019
Last week some new records were set in the global bond market. The primary catalyst was the formal shift to dovish stance by the US and European central banks. With few exceptions most global central banks are easing or leaning that way. The European Central Bank kicked things off with the indication on Tuesday that it was leaning towards easing. That was followed by the same message from the Fed on Wednesday. On Thursday, the benchmark 10-year Treasury yield broke below 2% before retracing a little bit. Yet equity markets rallied, presumably because with sharply lower global interest rates money will have to flow back towards equities in an effort to generate acceptable returns.
This week let’s take a look at non-US government bond yields since that’s where very interesting action has been in the global bond market. To start, the chart below shows selected 10-year government bond yields that are all trading below zero. As well, last week, for the first time French and Swedish 10-your benchmark yields fell below zero. In the German yield curve, everything is below zero from 19 years inward, and the benchmark 10-year Bund traded at a record-low yield of minus 33 bps. In the Japanese yield curve we have negative yields from 15 years inward.
The Italy 10-year government yield is only about 10 basis points above the US 10-year yield. Italy is in its usual political chaos, having (again) threatened to break its budget agreement with the EU. Italy’s deficit is 132% of GDP, highest next to Greece in the EU. Political chaos seems to be the normal situation for most major Western countries right now. That also helps push yields so low that investors in many major government bond markets, like Germany and Japan, are willing to accept a loss on their money in the interest of maintaining liquidity.
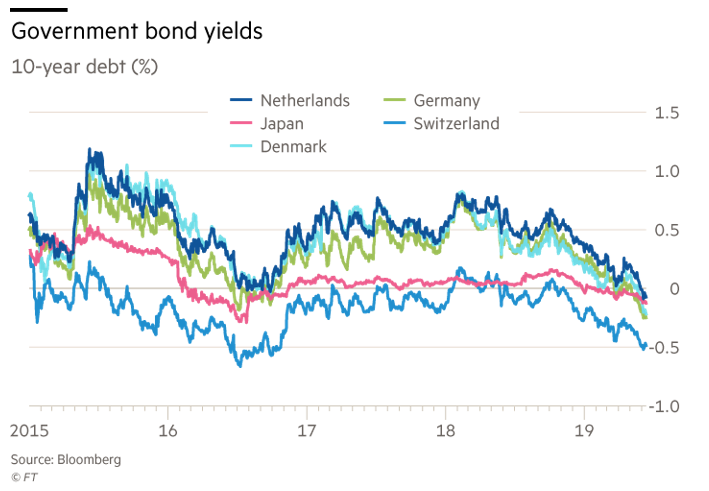
The next chart shows that last week a new record $12 .5 trillion of global bond yields were below zero, 22% of the entire global bond market (including investment- and below-investment-grade debt). The $57 trillion Barclays Multiverse index yield, which includes all of those negative-yielding government bonds, is just 1.7%, 30 basis points above the record low set in 2016.
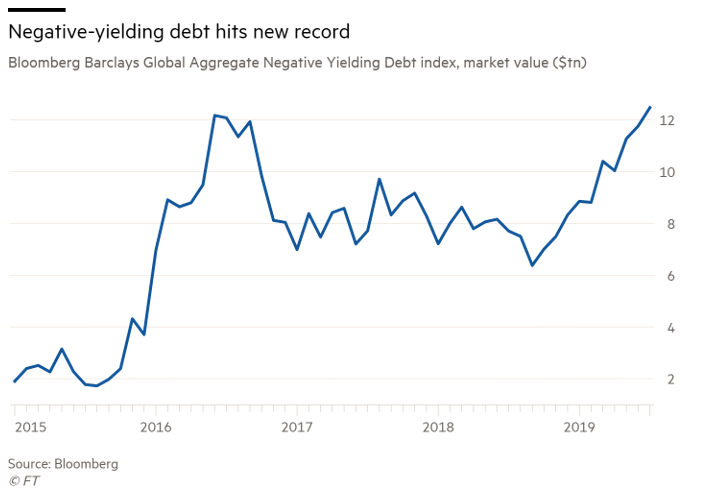
If as a result of this you ask yourself how equities can be rallying in the face of negative yields, with central banks leaning towards easing because of weaker economic data on a global basis, then you are with the many other investors with a fundamental bent, and probably on the sidelines. But the impact of central banks in the post-crisis era on market liquidity is difficult to overstate, and when the yields on more liquid assets fall sufficiently, investors react by moving into riskier asset classes. And that could fuel the risk-on rally for a while. A surprisingly strong US employment report for June, though, could calm the party, at least for a while. But we will have to wait a few weeks for that possibility.
This week markets will remain focused on the fluid situation with Iran, any news on upcoming trade talks, and whether the various market rallies will stall out or resume. The economic data is not top tier. On Tuesday the Case/Shiller housing indices, residential home sales and consumer confidence will be released. Durable goods and the EIA petroleum reports will come out Wednesday and the last revision of Q1 GDP will hit screens on Thursday.
June 17, 2019
Add Iran and India to China Dialogue
Stocks managed to end the week with marginal gains after weathering a mid-week slump due to rising tensions in the Middle East. As a result, US Treasuries reversed course and the ten-year benchmark closed unchanged on the week, benefitting from a risk-off mindset for investors
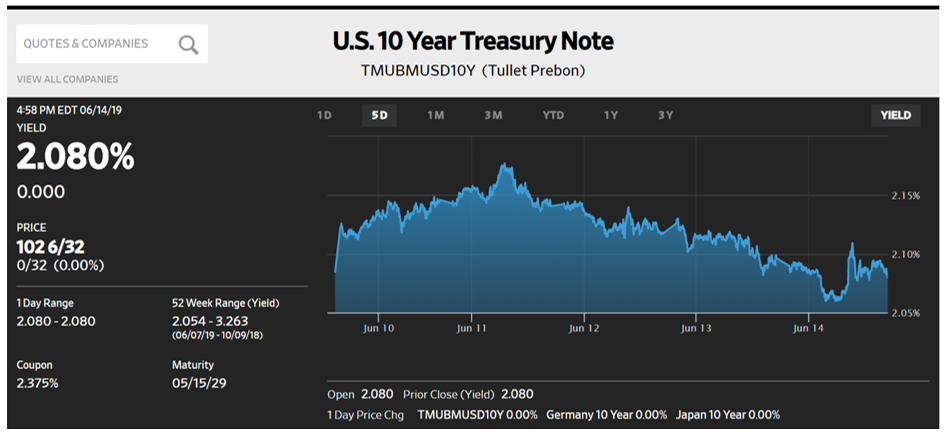
Treasuries seemed headed to seek their next level of support ahead of this week’s FOMC meeting before that safe-haven trade asserted itself. It is unlikely that a rate cut could result from this meeting and strong economic reports on Friday may guide the Committee to exercise more patience while carefully phrasing their statement and rate forecasts. It seems that right now the markets are more in need of a rate cut than is the economy.
Inflation poses little threat with both CPI and PPI coming in as expected; Core PPI was 0.2% (2.3% y/y) and core CPI was 0.1% (2% y/y). The Fed’s preferred gauge, PCS, is at 1.6%, far below its 2% target.
Iran was identified by the Administration as being responsible for the attack on two oil tankers in the Strait of Hormuz, escalating an already tense relationship while increasing fear in the region along with insurance costs. Ironically, the price of oil showed only a small gain after an initial surge and its recent weakness reflects the lack of demand resulting from the US-China trade dispute.
India now has joined the trade wars by retaliating for its loss of preferential trade status with the US by hiking tariffs on its goods
Other news items reflect the good news/bad news that seems to be so perplexing to market analysts:
- National Federation of Independent Businesses reported a gain in small business optimism, with six of ten categories positive and only one negative
- The United Nations Conference on Trade and Development said foreign investment in the US declined by 9% in 2018 as countries are wary of trade tensions and signs of economic weakness, with money going to Asia instead
- US budget gap widened 39%
- SIFMA (Securities Industry and Financial Markets Association) survey of economists projects 2.2% GDP growth, with a 25% chance of recession in twelve-months, as judged by the median participant
- Gold continues as a safe-haven investment, reaching a 14-month high
- China’s industrial output hit a 17-month low
- Global sovereign debt now has almost $12 trillion trading at negative yields, with ten-year German bunds now at -0.27%
- Retail Sales rose 0.5% as expected, and with a strong +0.5% revision to April’s number
- Industrial Production was +0.4%
The Week Ahead
Some housing data, $113 billion in Treasury debt, and no Fed speak until Wednesday’s FOMC announcement, with their forecasts and a Jay Powell press conference
Monday – ECB begins a three-day forum; Treasury auctions $72 billion 13- and 26-week Bills
Tuesday – Treasury sells $26 billion 52-week Bills
Wednesday – FOMC announcement with forecast, and a press conference
Thursday – Treasury auctions $15 billion 5-year TIPS
June 10, 2019
Weak Jobs Report Caps a Strong Week for Equities and Bonds
In a week that saw domestic equities find buyers and the DJIA rally 4.7%, Treasury debt also rallied as both markets benefited from comments by Jay Powell that the Fed is considering cutting rates. Such a sentiment was reinforced by ECB President Mario Draghi who said the bank expects to keep rates on hold until mid-2020, which means a refinance rate of Zero and a deposit rate of -0.40%. Additionally, the ECB is even more challenged with inflation than the Fed, as the Eurozone rate rests at 1.2%.
The possibility of a rate cut at the FOMC’s June 19 meeting is about 20% and a 70% chance of at least one cut by the meeting after that, on July 30-31. The effect of this on bonds was felt most sharply in the front end of the curve, as seen in Friday’s steep decline in Treasury’s two-year Note.
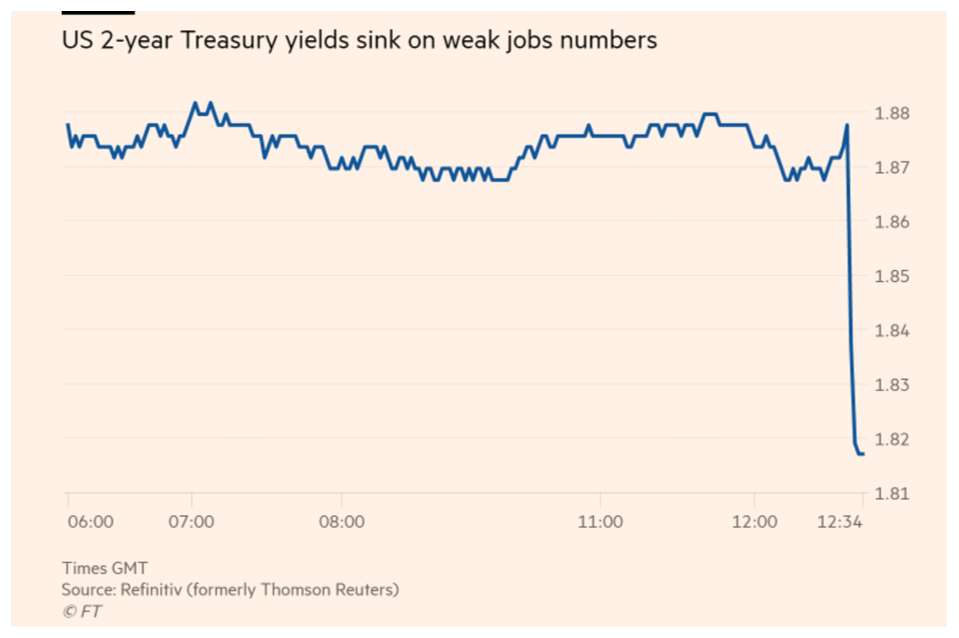
For the week, the 2/10 Treasury yield curve steepened from +15.7 bps to +23.4 bps but still helped the SBA 504 program price its monthly debentures at rates significantly lower than in May. At 2.60%, 2019-20F is 28 bps lower than last month and 100 bps lower than in June 2018. 2019-25F is 30 bps lower m/m and 91 bps lower than the inaugural 25 year offering in July 2018.
This chart displays the dramatic performance in the rates market and the emphatic value of 504 loans as measured by the ongoing Effective Rate to small business borrowers.
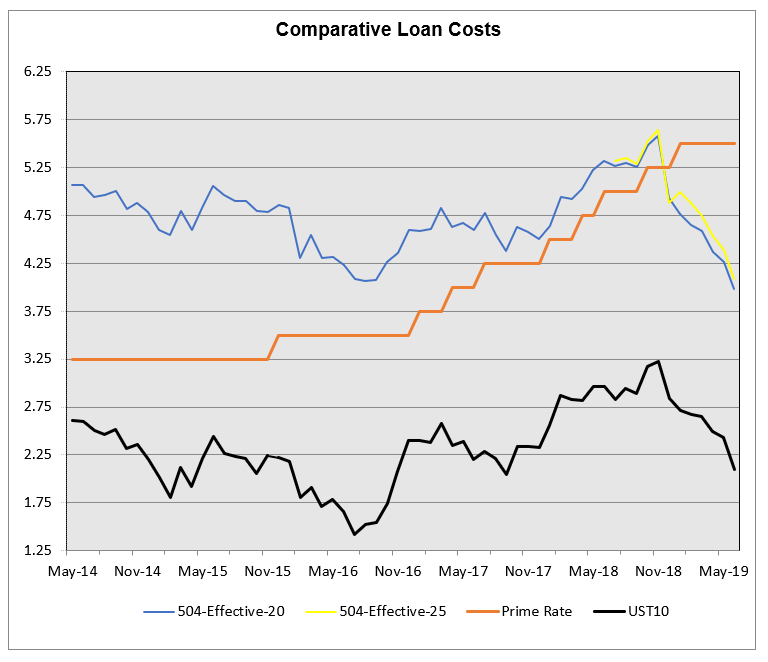
This cheapness to Prime Rate will change with any rate cut but even with that, 2019-25F’s ongoing effective rate of 4.09% (Prime -141 bps) will remain quite cheap by comparison.
Late on Friday President Trump “indefinitely suspended” the planned tariffs on Mexican goods that were to take effect this week. Enhanced security concerning immigrants and Mexican care of asylum seekers are part of the agreement which both parties hope to finalize within the next 90 days. As such, market reaction will determine if it is viewed as a temporary settlement or more permanent, though some op-ed columnists believe this simply affirms prior agreements.
The Week Ahead
No Fed speak during the blackout period ahead of the June 18-19 FOMC meeting; Treasury to auction $150 billion in debt, and some economic reports.
Monday – Treasury auctions $72 billion 13- and 26-week Bills
Tuesday – Producer Price Index expected to be +0.2%; and Treasury sells $38 billion three-year Notes
Wednesday – Consumer Price Index consensus is +0.2%; and Treasury sells $24 billion ten-year Notes
Thursday – Treasury sells $16 billion thirty-year Bonds
Friday – Retail Sales expected to rebound to +0.7% from -0.5% in April; and Industrial Production also expected to rebound to +0.2% from -0.5% in April
June 3, 2019
Increased Tariffs Batter Stocks and Rally Treasuries
Trade tension between the US and China continues, as do recent trends in the markets. Investors seek safety and that has propelled the benchmark US Treasury ten-year Note to end the week at a 20-month low of 2.13%. As the SBA 504 program prepares to price its June debentures this week, the benchmark is 29 bps lower than it was for the May sale and 16 bps lower than it was before the Fed raised short-term rate 225 bps beginning in December 2015.
So, the thought of additional rate hikes is gone, and the market is now anticipating at least one rate cut by the Fed before year-end. The January Fed Funds contract implies a rate around 1.92%, and with Fed Funds currently at 2.38% a reduction of 50 bps seems built into expectations. That prospect has again inverted the 3 month/10-year Treasury curve -21 bps, and while such a condition is identified as a predictor of recession, it is a long-range indicator and with lower yields now expected a lower cost of borrowing could help equities. Then again, there could be a recession as soon as nine months, according to Morgan Stanley’s Chetan Ahya, if another $300 billion of Chinese goods see a 25% tariff and China retaliates in kind. Friday’s move in Treasuries also reduced the rate on US two and five-year Notes below 2% and saw German ten-year Bunds trade at -0.21%.
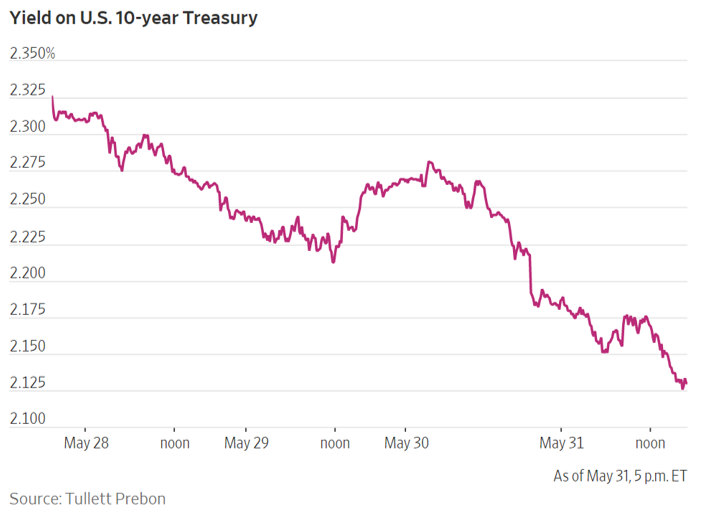
“Sell in May and go away” is an old saw for stocks and it held true as the S&P 500 index had its worst month in seven years and second worst since the 1960’s. For the month it was down 6.6% and dip buyers are not to be found, yet.
Adding to the anguish in stock markets was the President’s Thursday night announcement of a tariff on Mexican imports, starting at 5% this month and increasing to as high as 25% in October if action is not taken to relieve the border crisis. This adds another level of complexity to the use of tariffs and creates concern over future measures. The announcement’s impact was a continuance of the sharp drop in Treasury yields as seen in the above chart, and another down day for stocks in a month that has had many of them. Major indexes declined 1% on the day and all were down 6.5% or more for the month.
The question might be asked – at what point do the increased costs resulting from tariffs get passed on to consumers, and increase inflation? Producer prices have consistently outpaced consumer prices as producers have opted to absorb much of that expense, but that cannot last forever.
Economic reports came in as forecast and offered some stability until Thursday night:
- 1Q2019 GDP was 3.1%, down slightly from the first estimate
- Personal Income was +0.5% and the Fed’s preferred inflation gauge, Personal Income & Expenditures, was 0.2%, 1.6% y/y, well below its 2% target
The Week Ahead
Fed speak, light Treasury issuance, the jobs report, and the 504 program’s sale of 20 and 25-year debentures in an Agency CMBS market that will see heavy supply from Fannie Mae and Freddie Mac.
Monday – Treasury sells $72 billion 13 and 26-week Bills; President Trump begins a five-day visit to the UK
Tuesday – Factory Orders expected to be +1.5%
Thursday – SBA 504 program prices its June debenture sales, and the 75th anniversary of the D-Day invasion
Friday – Non-Farm Payroll expected to be +180,000 after an April increase of 263,000
May 28, 2019
More of the Same
Trade tension continues to send both interest rates and stocks lower. On Thursday, after more headlines on trade tariffs and a weak European purchasing managers’ report, the benchmark ten-year note traded at its lowest level (2.29%) since October 2017, before easing back at the end of the week. At 2.33% this benchmark is just 4 bps higher than it was the day before the Fed began its recent cycle of interest rate increases in December 2015. Nine rate hikes totaling 225 bps have been erased as minutes from the Committee’s May 1 meeting stated they may leave rates unchanged for the rest of the year. Weak export reports from Asia and a reduced growth forecast in Europe find the ten-year German bund back in negative territory at -0.12%.
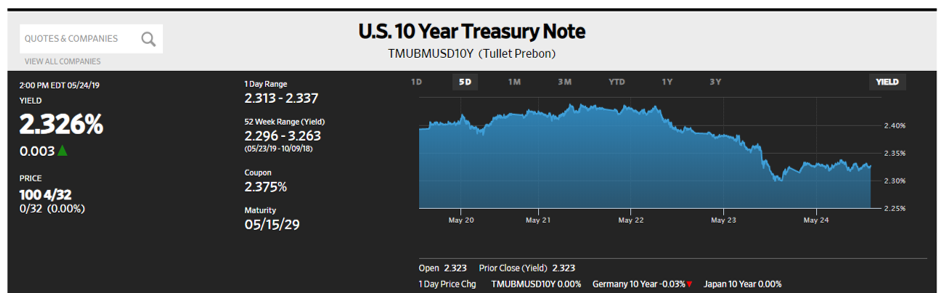
There is reduced confidence that a US-China trade agreement can be reached and falling expectations for inflation have helped spur this Risk Off trade that is hurting equities. The one economic report of significance last week, Durable Goods, showed an as expected decline of 2.1% as manufacturing continues to slump, leading the DJIA to fall for the fifth consecutive week. That is its longest streak since 2011, leaving it at -3.5% for the month. Its counterpart in China, the Shanghai composite Index, is now down 17% for the month.
Contributing to equity weakness was the US Purchasing Managers Index that continued its downward trend, coming in far below consensus forecast. This WSJ chart shows it at a 9-year low due to trade war worries, further strengthening the safe-haven Treasury rally and forcing Agency CMBS slightly wider.
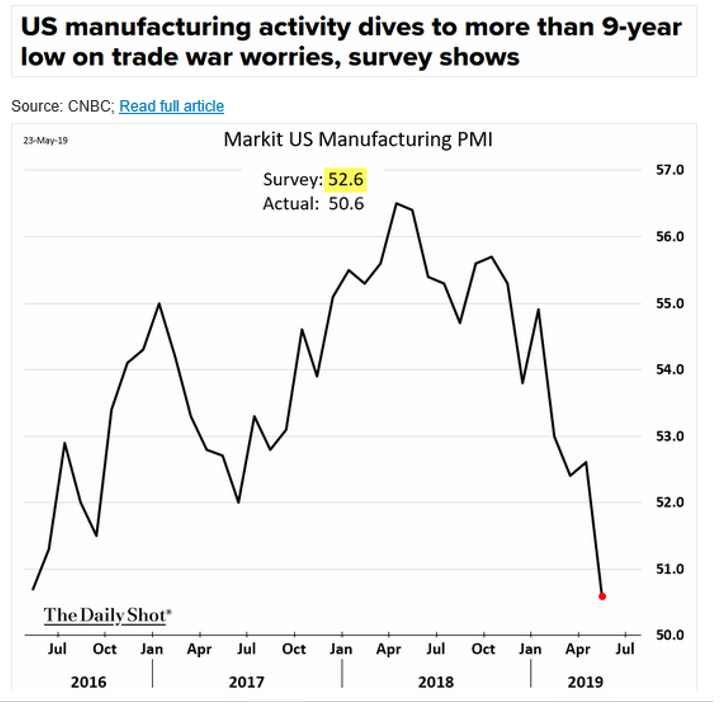
The Brexit vote that Theresa May did not support but whose mandate she tried to implement is finally forcing her out as Prime Minister. Three years after its vote the event almost seems inconsequential, but she will be succeeded by a hard-liner whose advocacy for Britain could be disruptive for the European Union, Ireland in particular.
The Week Ahead
$203 billion in Treasury auctions, light Fed speak, and PCE, the Fed’s preferred inflation indicator on Friday.
Tuesday – $72 billion in 13 and 26-week Bills, $40 billion in 2-year Notes, and $41 billion in 5-year Note
Wednesday – $18 billion in 2-year Floating Rate Notes, and $32 billion 7-year Notes
Thursday – Second estimate of 1Q19 GDP expected to drop to 3.0%
Friday – Personal Income & Outlays: Personal Income expected to be 0.3%, and Core Personal Consumption Expenditures expected to 1.6% y/y, remaining below the Fed’s 2.0% target
May 20, 2019
Risk Off
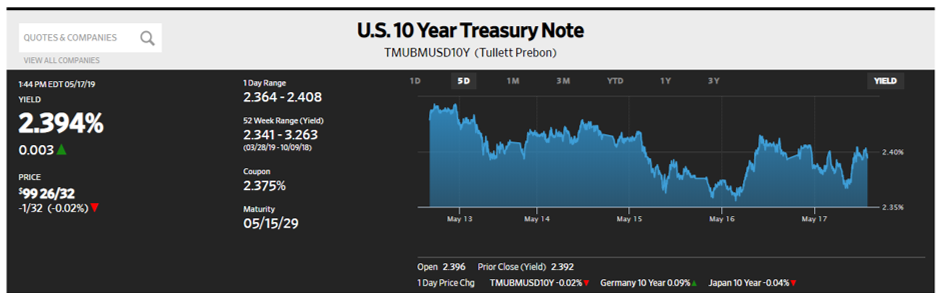
Investors continue to pile into US Treasuries because of trade tension fears that may lead to an economic slowdown. The ten-year benchmark yield ended the week at its lowest weekly close in two-months while analysts now assign a 77% probability of a rate cut this year. Additionally, Fed officials expressed concern over low inflation, and one, Philadelphia bank President Patrick Harker, stated he did not see the need for any rush to raise rates, reversing previous comments he had made. This market strength continues even with China having been a net seller of $20 billion of US Treasury debt in March. Usually that type of trade is done to support its currency (sell US$, buy Renminbi), but the Renminbi has been static, not in need of support, and ten-year Treasuries have declined 31 bps since the beginning of March.
A cautionary article in the Financial Times identified the concern of some people that China might use its significant US Treasury holdings as a tool in trade negotiations. While that $1.1 trillion amount is substantial its utility as a bargaining tool was discounted as any large scale sale of that debt would create global financial instability in an already uncertain environment.
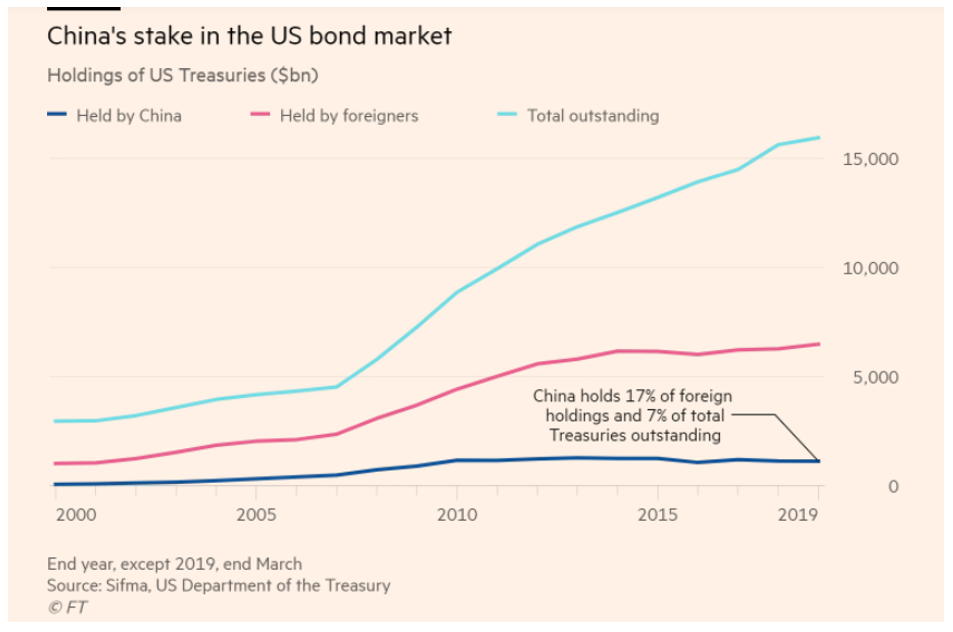
Equities performed well mid-week, but soft economic data and trade concerns drove some indexes to their fourth consecutive weekly loss, and China announced reciprocal tariffs on $60 billion of US good in response to President Trump raising the tariff on $200 billion of Chinese goods to 25%. For now, the impact of these tariffs is affecting Chinese investors more severely – since April 19th the Shanghai Composite Index has declined 12.4% vs. a 1.6% decline in the S&P 500 Index.
Additional items that contributed to the weakness in stocks were:
- Trade negotiations possibly are paused until the G-20 summit next month in Japan
- China’s report of Retail Sales came in 1.5% lower than expected, increasing fears their consumers are not spending enough to offset the higher costs from tariffs
- US Retail Sales came in at -0.2%, after a forecast of +0.2%
- US Industrial Production was -0.5%, vs. a prediction of flat, but with some positive revisions
The Week Ahead
Heavy Fed speak with a light economic calendar and just $109 billion of Treasury auctions.
Monday – Treasury auctions $72 billion of 13 and 26 week Bills
Tuesday – Treasury sells $26 billion of 52 week Bills
Wednesday – Minutes of the FOMC meeting ended May 1 are released
Thursday – Treasury sells $411 billion of ten-year TIPS (Treasury Inflation Protected Securities)
Friday – Durable Goods report expected to be -2.0%
May 13, 2019
President Trump shook up the financial markets last week with first the threat of, and then the imposition of, a new round of trade tariffs on China, at a time when the Chinese trade delegation traveled to Washington DC to finalize a trade agreement. Of course, the talks stalled. While stocks fell over 2% on the week, one might consider this a mild response compared to the way the markets reacted earlier in Trump’s term to similar situations. Treasury yields fell, the benchmark 10-year note yield declined eight basis points on the week to 2.45%. Credit spreads held through the middle of the week but started to widen as equity volatility levels remained elevated and prices down into the weekend.
Way Sub-Prime. Sub-Prime is not a bad word when used in the context of the SBA 504 program. Last Wednesday interest rates were set on the monthly SBA 504 debenture offering. The resulting effective rate for the 20-year maturity was 4.27%, the lowest since October 2016. That effective rate was 123 basis points below the Bank Prime Rate. A chart showing these interest rates since 2004 is below. The last time the 504 effective rate was this far sub-Prime was in September 2007, well over a decade ago.
We are now six months into this new cycle of sub-Prime SBA 504 effective rates. With the Fed expected to be on the sidelines for quite some time, the wide gap between the effective rate and the Prime rate should persist. The prior cycle lasted 32 months (we are not predicting that the current cycle will last that long). With the Fed on the sidelines, inflation expectations low, and the economy doing reasonably well, it is a great time for 504 fixed-rate funding.
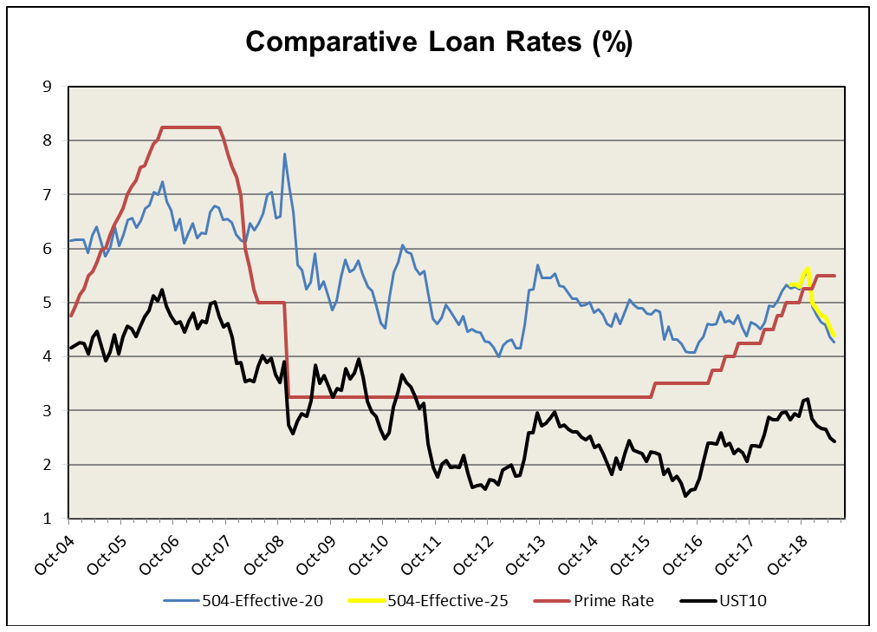
The Week Ahead – Mainly second-tier economic data, a lot of Fed speak.
Monday – Three Fed speakers – Kashkari, Clarida, Rosengren
Tuesday – Three Fed speakers – Williams, George, Daly plus NFIB small business survey, import prices
Wednesday – Retail sales, industrial production, inventories, NAHB builders indices, SBA 504 funds
Thursday – Housing starts, Philly Fed index, two Fed speakers – Kashkari and Brainard
Friday – Consumer sentiment, leading indicators
May 6, 2019
Lowest Rate in Nearly Half a Century
With a jobs gain of 263,000 the report was positive for the 103rd consecutive month and the Unemployment Rate declined to 3.6%, matching a number last seen five months after Apollo 11’s moon landing. Additionally, the previous two months’ reports were revised upward, and average hourly earnings rose 3.2% from a year earlier. Since the US has more job openings than unemployed people it is considered to be at “full employment,” yet this strong economic data seems to have little impact on inflation, something that was alluded to in Chairman Powell’s comments after the FOMC meeting concluded on Wednesday with no change in policy.
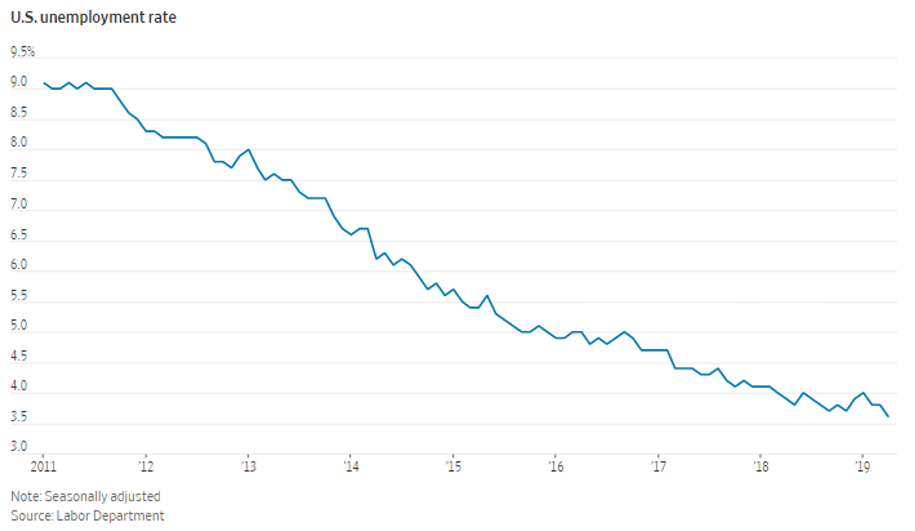
In addition to leaving the Fed’s target rate for Federal funds at 2.25-2.50%, the Committee reduced its rate for IOER (Interest on Excess Reserves) from 2.40% to 2.35%. This does not change their monetary policy but does seem to reflect their previously discussed patient approach to increasing interest rates by lowering its rate on bank deposits.
Move the Goalpost?
It is perplexing for the Committee, as well as all economists, why such strong economic data is having little impact on inflation, persistently tracking below the Fed’s 2% target rate. In his comments Mr. Powell noted the Fed does not see a strong case to move rates higher or lower and that its forecasts on inflation generally miss on the downside, creating a risk that “over time inflation expectations could be pulled down.” This WSJ chart offers some alternative measures to the 1.6% core rate for the Fed’s preferred gauge of Personal Consumption Expenditures should the Fed either lower its target or change the measure that it follows. Last Monday’s release for this report included a 0.9% increase in consumer spending, well above consensus and another perplexing element to why inflation is so tame.
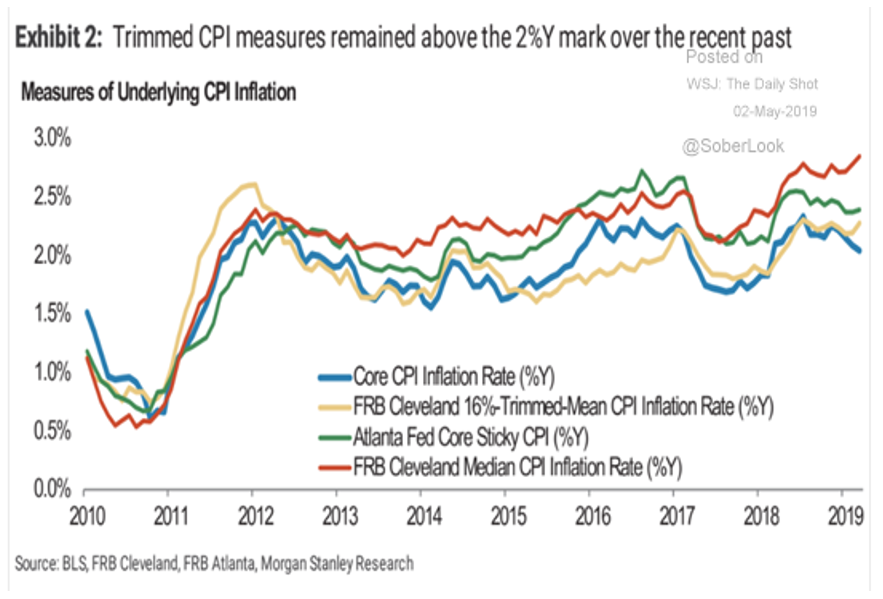
At week’s end equities were strong and Treasuries a bit soft, but all that changed when President Trump tweeted that he was dissatisfied with Chinese trade talks and intended to impose a 25% tariff this Friday. Ahead of today’s open equities are off sharply and the benchmark ten-year note has returned to where it was when the April debentures were priced – 2.48%. Headline news will dominate activity this week.
The Week Ahead
Light on economic data, a lot of Fed speak, some Treasury and ACMBS supply, plus the SBA 504 program prices its 10, 20 and 25-year May debentures.
Monday – Treasury sells $75 billion 13 and 26-week Bills
Tuesday – Treasury sells $38 billion three-year Notes
Wednesday – Treasury sells $27 billion ten-year Notes
Thursday – the SBA 504 program prices its May debentures and Treasury sells $19 billion thirty-year Bonds
April 29, 2019
Defying Expectations
1Q2019 growth came in at an annualized rate of 3.2%, far above expectations and overcoming fears that the 35-day government shutdown would have caused a slump. Ironically, the report had a reverse effect on markets as equities were basically unchanged and US Treasuries rallied. The reason for that was identified as the core price index report of 1.3% being weaker than the consensus forecast. That type of weak inflationary data substantiates the recent reversal in Fed policy that has helped the S&P 500 index gain 17% YTD and hold at its record high.
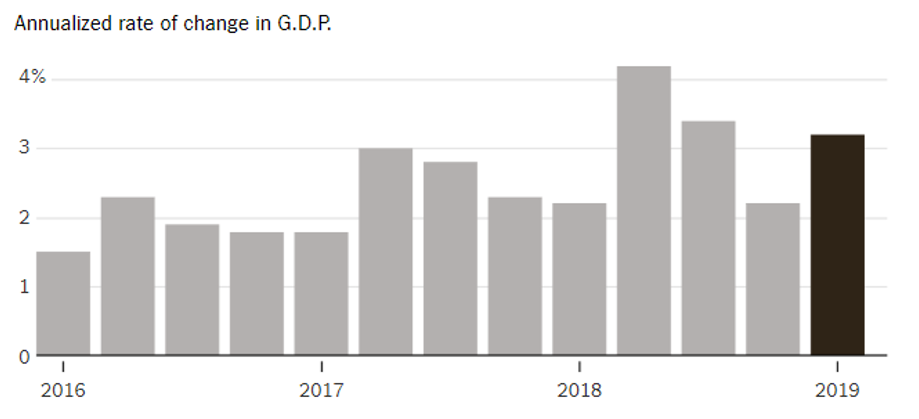
Since there is always a caveat to an economic report, the GDP cautionary note was its growth resulted from trade and increased inventories, two categories that are expected to reverse in future quarters. Trade improved because exports exceeded imports and it is felt that occurred because firms boosted imports in 2018 in anticipation of an increase in trade tariffs that did not occur. Also, consumer spending which makes up two thirds of the economy rose just 1.2% in the first quarter, down from 2.5% in the fourth quarter.
Other economic reports showed Existing Home sales declined, New Home Sales rose, and Durable Goods came in far above forecast at 2.7%.
Things You Don’t Hear About Anymore
- Détente
- Balanced budgets
- Inverted yield curves
The first two items are unlikely to get much air time anytime soon and while number three may return, its brief appearance a few weeks ago was temporary and its reliability as a recessionary forecaster may be in doubt. Benchmark Treasury rates are range bound, in sync with a patient Fed and with a market that assigns a 66% probability of a rate cut this year, it’s possible short-term rates could decline faster. Helped by Friday’s weak inflation data the ten-year Treasury benchmark yield moved lower on the week, closing just 4 bps higher than when the 504 program priced its April debentures.
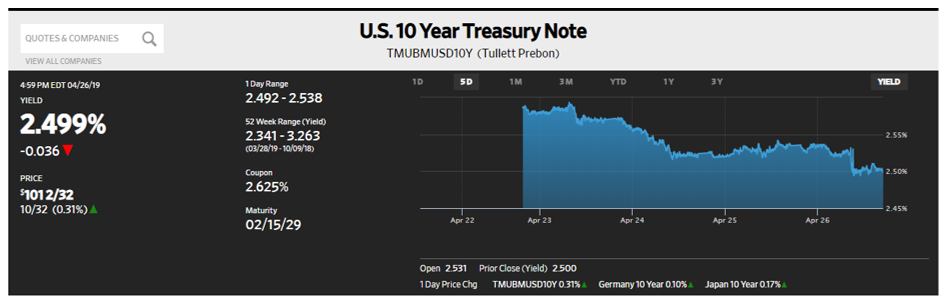
The Week Ahead
A light Treasury calendar, some Agency CMBS issuance, and an FOMC meeting and announcement.
Monday – Treasury sells $75 billion 13 and 26 week Bills; Personal Income & Outlays, including the Fed’s preferred PCE inflation gauge, expected to remain below target
Tuesday – FOMC meeting begins
Wednesday – The meeting concludes with an announcement that likely will keep policy unchanged, and a press conference
Friday – Non-Farm Payroll is expected to be 180,000 with average hourly earnings increasing .01% to 3.3% Y/Y
April 22, 2019
Unchanged, in Light Trading
Markets ended the holiday shortened week where they started. Stock indexes were flat, and the ten-year Treasury benchmark remained at 2.56%, up 7 bps from when the SBA 504 program priced its April debentures two weeks ago.
Recent reports of unified central bank policy supporting economic growth amidst downward revisions to forecasts indicate interest rates may remain in current ranges for an extended period. It has been noted recently that foreign buyers have accounted for fewer purchases of US Treasury debt even though ten-year Treasuries are 253 bps cheaper than comparable German debt, the European benchmark. One reason for this lack of demand is currency risk should the buyers not hedge their investment. Leaving the purchase unhedged against currency fluctuations would reap that additional yield but if $US should weaken vs. the Euro or Yen, then that additional income is lost.
This Financial Times chart shows how the currency hedging cost of buying US ten-year debt results in that 2.56% yield turning to -0.50% for European investors, and for Japanese buyers it is only slightly improved at -0.30%. The FT article does identify firms who are willing to take the risk, noting that Nippon Life has made recent purchases unhedged and expects to add even more in the coming year.
The risk of this is not confined only to the investor as a weakening $US could spur unhedged investors to sell, further weakening the $ and possibly promoting more selling in a vulnerable bond market.
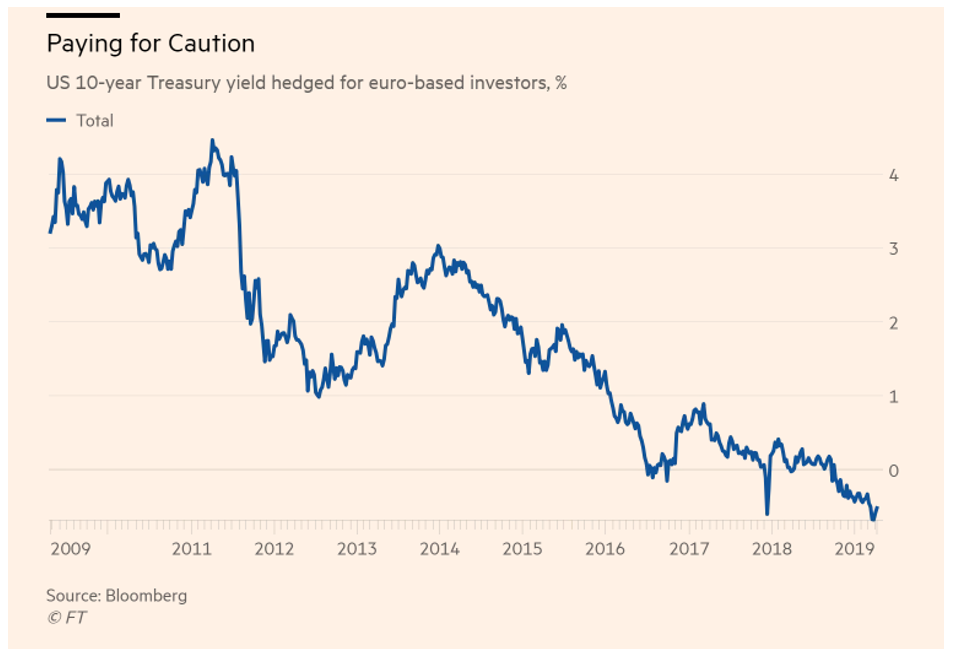
The Week in Review
Reports last week were again mixed, with Industrial Production at -0.1% vs. a forecast of 0.3%; and Retail Sales was 1.6%, exceeding even an optimistic 0.8% forecast; Housing Starts and Permits were both weaker than forecast.
One other report was that the Administration might withdraw the names of two recent nominees to the Federal Reserve Bank’s Board of Governors. Criticism of their selection was very strong as even Republicans believed their focus was too strongly political.
The Week Ahead
$237 billion of Treasury debt, a light economic calendar with housing data, and no Fed speak in advance of the April 30 FOMC meeting.
Monday – Treasury auctions $78 billion 13 and 26 week Bills
Tuesday – Treasury auctions $26 billion 52 week Bills, and $40 billion 2 year Notes
Wednesday – Treasury auctions $20 billion 2 year Floating Rate Notes and $41 billion 5 year Notes
Thursday – Treasury auctions $32 billion 7 year Notes
Friday – 1st estimate of 1Q19 GDP expected to be 2.0% vs. 2.2% in 4Q18
April 15, 2019
SBA 504 Loan Performance
In a week that saw continued strength in equities and a late spike in Treasury rates, it is important to note how the 504 loan program is delivering fixed rate funding for small business borrowers at rates significantly below the Prime Rate.
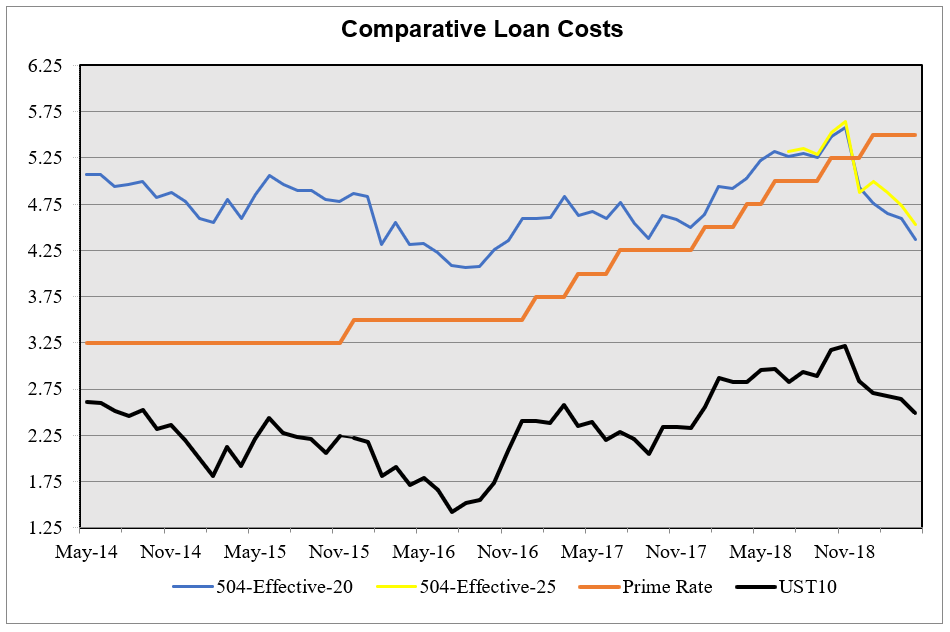
On Thursday the 504 program priced its 20 and 25 year debentures at rates that continue to decline and more importantly, at ongoing effective rates that are dramatically lower than banks’ base lending rate. Of particular interest is that 46% of the $360,347,000 total that was funded was in the program’s relatively new 25-year maturity. The growth in demand for this maturity has steadily risen since its introduction in July 2018, and now totals 940 loans for $786,957,000
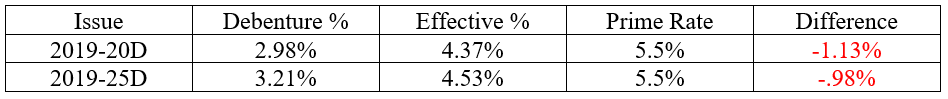
The week in Review
Economic reports were weaker than forecast with core CPI coming in at 0.1%, and Factory Orders at -0.5%, with a slight downward revision to January. Core PPI was about as expected at 0.3% but was 0.6% when including energy prices, its biggest increase since October.
- Companies like Walgreens, Apple, 3M and FedEx have cut profit forecasts while earnings reports from banks have been mixed.
- 2019 US budget deficit is expected to reach $950 billion, 4.5% of GDP, and the buyer base for funding this debt has evolved. As of December 2018, foreign holders of Treasury debt represented 35.3%, the lowest share since 2004; domestic investors now represent 52.9%, the largest share since 2009. Thankfully, this low interest rate and low inflation environment means the servicing cost of this debt as a percentage of GDP is near its lowest in four decades.
- Central bank comments included Mario Draghi acknowledging a growth slowdown, saying it is the result of the “persistence of uncertainties and tepid external demand related to geopolitical factors.”
- Release of the FOMC minutes from its March meeting affirmed pausing further rate increases this year but did hedge by indicating rates could go in “either direction.”
- Fed Chairman Powell continues to hear presidential criticism about interest rates not being low enough.
- European Union pushed back the date for a decision on Brexit to as late as October 31.
This WSJ chart shows that late spike in benchmark rates which fortunately came the day after the 504 program priced its debenture sales, when CT-10 was trading at 2.493%. A reason given for the selloff was a large March increase in Chinese loan activity that can be interpreted as expanding their economy; a simpler reason might be the market was overbought.
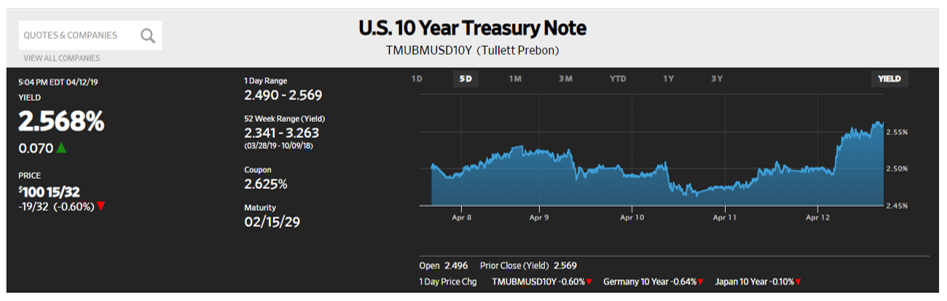
The Week Ahead
A light calendar for Treasury debt, Fed speak, and economic reports.
Monday – Treasury auctions $78 billion 13 and 26-week Bills
Tuesday – Industrial Production expected to be 0.1%
Wednesday – SBAP 2019-20D and 25D are funded
Thursday – Retail Sales forecast to be -0.2%; Treasury auctions $15 billion 5-year TIPS (Treasury Inflation Protected Securities)
Friday – Housing Starts expected to be 1.16M
April 8, 2019
Mixed Signals
In a week that saw the S&P 500 index rise for the seventh straight day (+3.1%), Treasury yields rose 10 bps from the ten-year Note’s overbought level, but still sits 16 bps lower (2.49%) than when the 504 program priced its March debentures. Trading volumes in both markets are reduced as investors continue to be concerned about the usual suspects – trade tension with China, Britain’s unresolved exit from the European Union, and inconsistent global strength. It is that last item that is captured in the chart below, a tracking index created by the Brookings Institute and the Financial Times. This tracking index compares indicators of real activity, financial markets and investor confidence with their historical averages for the global economy and individual countries.
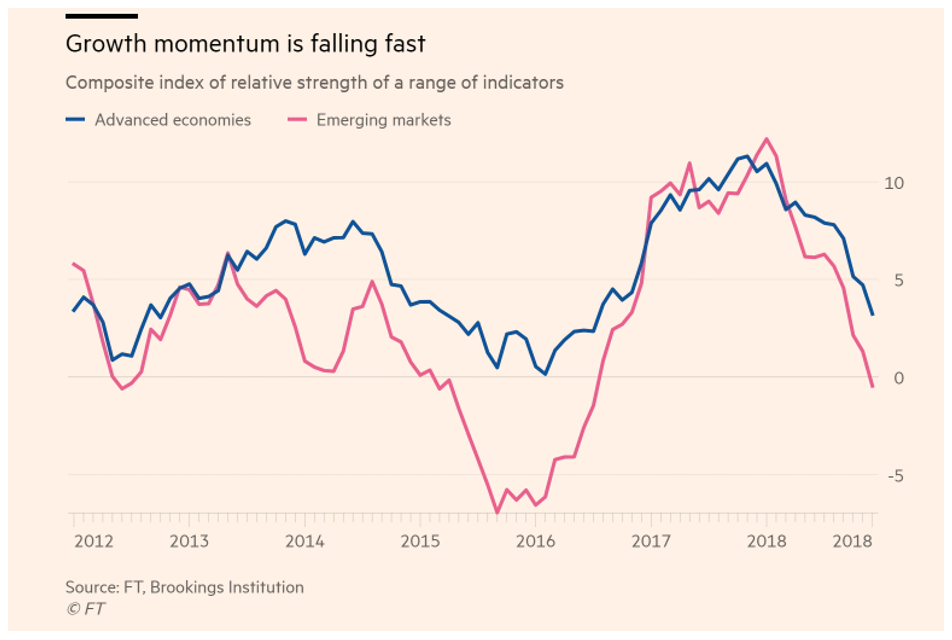
The report identifies a “synchronized slowdown” and states that although sentiment remains high in advanced economies it is plummeting in emerging markets, led by fears that a slowdown in China will lead to more weakness. Other points of concern are:
- Growth indicators in Europe have been disappointing
- Italy is in a recession, Germany narrowly avoided one, and the positive impact of President Trump’s 2017 tax cuts has passed
- Uncertainty caused by trade tensions are likely to leave a scar on economies
- Conventional monetary policy remains constrained by already low levels of interest rates, meaning central banks have little room to aggressively lower rates to spur expansion
- That condition leaves measures like new rounds of Quantitative Easing as policy alternatives, yet such measures may be limited by high levels of public debt
The topic of Quantitative Easing has become part of President Trump’s critique of Federal Reserve Bank policy, including more QE with his repeated request for the bank to lower interest rates. To further such policy, he signaled an intention to appoint two supporters, Stephen Moore and Herman Cain, to the Board of Governors.
The Week in Review
- Economic reports were as expected, slightly negative with the exception of Non-Farm Payroll, which came in above consensus and with an upward revision to February’s report. Unemployment remained at 3.8% but average weekly earnings declined 0.1%
- Retail Sales was -0.2% but January was revised upward by 0.5%
- Institute of Supply Management Manufacturing was greater than expected, helping equities strengthen
- Durable Goods orders were -1.6% as forecast but February was revised down by -0.3%
The Week Ahead
A lot of Fed speak, especially Chairman Powell speaking at a Democratic caucus over three days late in the week; Treasury to sell $156 billion of debt, some inflation numbers, and the SBA 504 program sells 20 and 25-year debentures.
Monday – Treasury sells $78 billion in 13 and 26-week Bills; Factory Orders expected to be -0.5%
Tuesday – Treasury auctions $38 billion 3-year Notes
Wednesday – Core CPI expected to be 0.2%, 2.2% y/y; Treasury sells $24 billion 10-year Notes; minutes of the March 30 FOMC meeting are released
Thursday – Core PPI forecast to be 0.2%, 2.5% y/y; Treasury sells $16 billion 30-year Bonds; SBA 504 program prices its April 20 and 25-year debentures
Friday – Chairman Powell concludes his comments
April 1, 2019
Lower for Longer
Sovereign debt continues to rally as central banks capitulate to the reality of softer than expected global growth, the ongoing concerns over trade tariffs, and the uncertainty surrounding Britain’s exit from the European Union.This WSJ chart shows the sharp decline in the yield of the benchmark ten-year Treasury note for March, a move that parallels German debt now trading at -0.07% as risk averse investors continue to seek safe-haven assets. This 29 bps decline also marks the Note’s best March quarterly performance since 2016. Investor demand has pushed $10 trillion of global government debt to negative yields, meaning those buyers guarantee themselves a loss on their purchase unless they sell at an even greater negative value before maturity. Even more confusing is corporate issuers in Europe being able to sell their non-government guaranteed debt at negative yields as demand for new issues is robust.
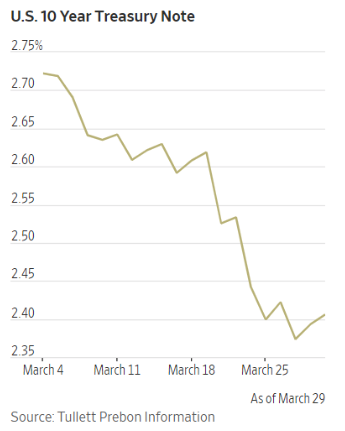
This reversal in central bank policy began with the Fed announcing it would be patient about further rate increases, then stating it was unlikely the proposed 2019 rate hikes would take place and finalized by reducing the cap on reinvestments for its portfolio. Taken together with the ECB delaying plans to raise rates, investors are resigned to a low rate environment, something that helps small business borrowers continue to fund fixed rate, long-term debt at low rates.
Still Lower but Better
It is rare for equities and bonds to rally concurrently, but US stocks have just finished their best quarter in nearly a decade, fueled by the revised central bank policies to keep rates low and promote economic growth.
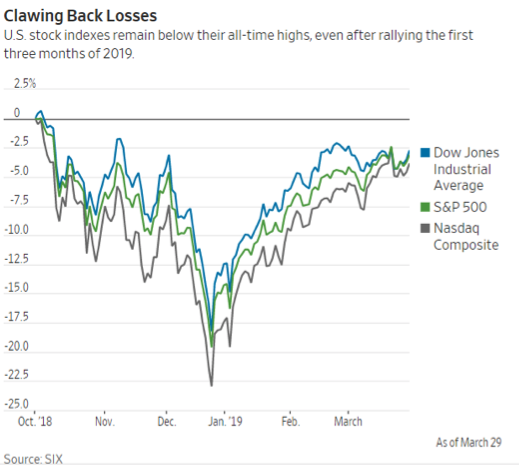
Just as investors are mysteriously buying negative yielding bonds, equity buyers have their own quirks, as displayed by Lyft’s IPO on Thursday. A company that lost almost one billion dollars last year priced its offering at $72 a share, only to see demand drive its price up 9% on its first day of trading.
Last week’s economic reports were either as expected, or weaker than forecast.
- 4Q18 GDP was 2.2%, down from the previous estimate of 2.6%
- Personal Income was 0.2% as forecast
- Core PCE was below forecast at 0.1% and also lower y/y at 1.8%. This puts the Fed’s preferred inflation gauge even further from its 2% target
- Housing Starts continued to be soft, not yet benefitting from mortgage rates inching closer to 4%
The Week Ahead Fed speak continues, Treasury issues just $84 billion in debt while ACMBS issuance increases, and economic reports include the March jobs numbers.
Monday – Treasury auctions $84 billion in 13 and 26-week Bills; Retail Sales expected to be 0.3%; ISM Manufacturing should be flat
Tuesday – Durable Goods forecast to be -1.9%
Friday – Non-Farm payroll estimated to be 170,000, with unemployment at 3.8% and Average Hourly Earnings at 0.2%
March 25, 2019
Patient Fed, and Then Anxiety!
Any thought that Wednesday’s FOMC annuncements would be the focal point of the week was erased by a much weaker than expected German Purchasing Managers report on Friday that caused the biggest one-day drop in US equities since January. It also rallied the ten-year Treasury to close at 2.44%, virtually unchanged from its January 2018 level. What is significant about that timeline is that the Fed had raised interest rates by 100 bps since then, yet now this benchmark rate is unchanged. Additionally, this has resulted in a yield curve inversion, where long-term rates fall below short-term rates; an event that has signalled every recession over the last 60 years. This NY Times chart shows the trend of this inversion whose development caused equities to turn negative for the week, with the NASDAQ index off as much as 2.5% on Friday alone. Such concern is global, only heightened by ongoing trade tensions, low inflation, and uniformly weak economic reports. Whether or not long-term rates continue to decline and enhance the inversion will determine the likelihood of a recession and its obvious impact on Fed policy. A pause may occur this week as Treasury auctions $244 billion in dedt and there could be a pullback.
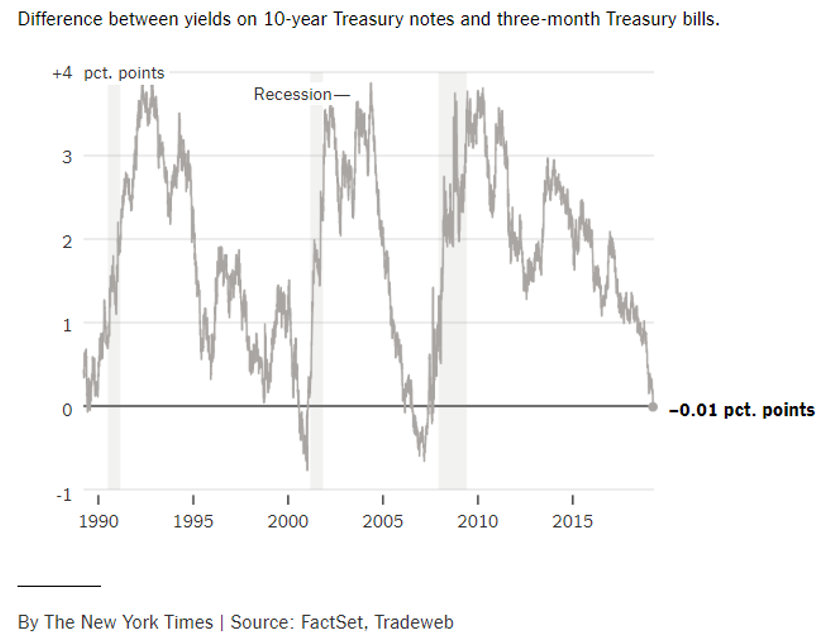
Earlier in the week the FOMC announcement spurred a relief rally in both stocks and bonds as the Fed update focused on the word no, as in:
- No change in policy
- No more rate increases this year (likely)
- No more Balance Sheet runoff
The patient approach to further rate increases has given way to a more dovish stance as possible rate hikes in 2019 were removed from the Committee’s forecast, and just one is expected for 2020, though some analysts now predict a possible rate cut. The cap on reinvestments of interest payments and matured debt in their portfolio will be lifted in stages, with no cap on reinvestments as of September. The Committee does intend to allow its holdings of Mortgage Backed Securities to decline with the objective of holding primarily US Treasuries in the longer run. This statement drove the initial improvement in Treasury prices this week and Friday’s weak reports from Europe extended their gains in anticipation of large buyer reentering the market.
Specific forecasts from the Fed reflect their concern about the health of the economy, with economic growth and the cost of money being lowered, while Unemployment is expected to rise.
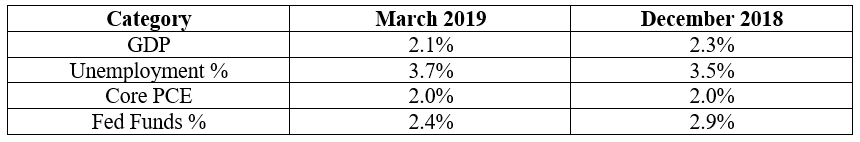
The only category that remains unchanged is the stubborn inflation gauge that has yet to reach its 2.0% objective, and that report is due this week.
The Week Ahead
Fed speak resumes, Treasury to auction $244 billion in debt, a light economic calendar, and Brexit continues to unravel, endangering Theresa May’s leadership as support grows for a second referendum.
Monday – Treasury auctions $87 billion 13 and 16-week Bills
Tuesday – Housing Starts expected to be flat; Treasury auctions $26 billion 52-week Bills and $40 billion two-year Notes
Wednesday – Treasury auctions $41 billion five-year Notes and $18 billion two-year FRN’s
Thursday – 4Q2018 GDP expected to be revised down to 2.2% from 2.6%; Treasury auctions $32 billion seven-year Notes
Friday – Personal Consumption Expenditure expected to maintain a core rate of 0.2%, 1.9% y/y; Personal Income forecast to be 0.3% after a -0.1% report last month
March 18, 2019
Weak Data = US Treasury Strength
After processing lower than consensus inflation numbers earlier in the week, the safe-haven trade gained momentum on Friday when Industrial Production came in at 0.1%, far below the expected 0.4% increase. That pushed the ten-year benchmark yield through its 2.61% resistance level, allowing it to close at its lowest yield since January 3, and significantly lower than its 3.25% rate last November.
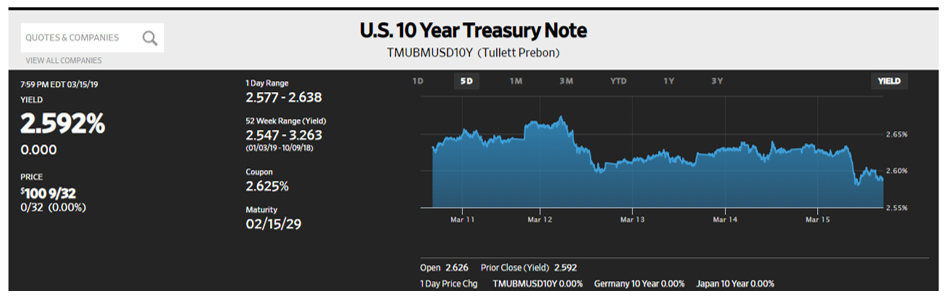
The usual suspects of weakening global growth, low inflation, and trade tensions continue to drive market performance, and expectations for any rate increases this year continue to wane. Helping this performance in US Treasuries was good demand for its recent debt sales.
Ironically, the economic weakness that is identified as creating demand for Treasury debt did not affect demand for domestic equities as the tech heavy NASDAQ gained 3.8% on the week. This performance seems to reflect confidence that the Federal Reserve Bank will be more than patient and actually look to support growth by cutting rates. On Thursday, analysts at JP Morgan announced they expect no increases this year, and Fed Funds futures contracts now assign a 26% probability of a rate cut.
As always, market participants will be paying close attention to the FOMC announcements on Wednesday, especially their forecasts and Chairman Powell’s press conference.
The Long Goodbye
The anticipated March 29 deadline for final terms of the UK’s exit from the European Union has been delayed; revised date to be determined. Parliament has voted twice to reject Theresa May’s negotiated terms and now they will wait for her to get EU approval for a new date.
The Week Ahead
FOMC announcement on Wednesday is the primary Fed speak, Treasury calendar is light, as are economic reports.
Monday – Treasury auctions $87 billion in 13 and 26-week Bills, and $11 billion in ten-year Treasury Inflation Protected Securities (TIPS)
Tuesday – FOMC meeting begins
Wednesday – FOMC announcement, forecasts, and press conference
Thursday – Leading Indicators expected to be 0.1%
Friday – Both Purchasing Managers Index and Existing Home Sales forecast to show slight declines
March 11, 2019
Odd Jobs Report
A gain of just 20,000 jobs in February added to earlier reports that contributed to equity weakness and lower interest rates in capital markets. Friday’s jobs report was the weakest since September 2017 and reflects possible fallout form the 35-day government shutdown. There were positive signs however, with the Unemployment Rate falling to 3.8% and average hourly earnings increasing 0.4%, 3.4% y/y, for its best performance since 2009.
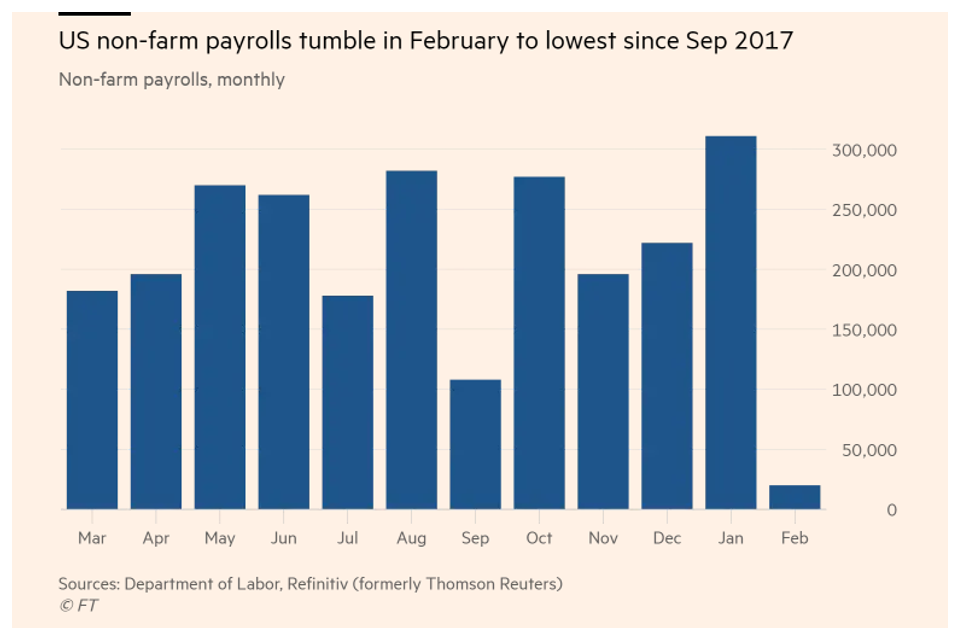
In comments later in the day, Fed Chairman Powell removed any lingering uncertainty about how patient the bank intended to be. He cited the usual suspects – restrained price pressure, a strong labor market and slower global growth – as reasons for why there is no need to change its paused interest rate policy now.
Friday’s negative performance for equities extended their poor week as domestic indexes declined 2.5% and global indexes like the Shanghai Composite dropped as much as 4.4% on Friday alone. That weakness was triggered by a report that Chinese exports dropped 20.7% in February, while imports fell 5.2%, also a bigger decline than forecast.
Earlier in the week the shutdown delayed report from the Commerce Department identified 2018 to be the largest ever merchandise trade deficit at $891.2 billion, with $419 billion of that representing trade with China alone. The failure to resolve trade negotiations continues to erode investor confidence while continuing to promote safe-haven trades.
The white towel seen wafting over the European Union was the European Central Bank’s surrender, admitting that it would keep its deposit rate at -0.40%, as it will continue to reinvest proceeds from its QE portfolio and resume auctions of collateral at low interest rates to promote growth. This U-turn, coupled with its downward revision for growth to 1.1%, will make it very difficult to end its dovish policy by year-end, as it had hoped.
Good News
Benefitting from this vacuum that Treasury rates have been locked in, the SBA 504 program continues to fund fixed-rate, long-term small business loans cheap to the Prime Rate. 2019-20C and 2019-25C in particular, represent 20 and 25-year loans that are funding more than 75bps below Prime.
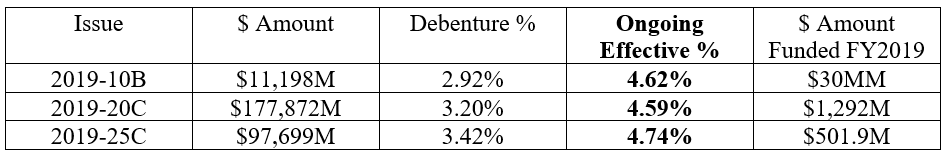
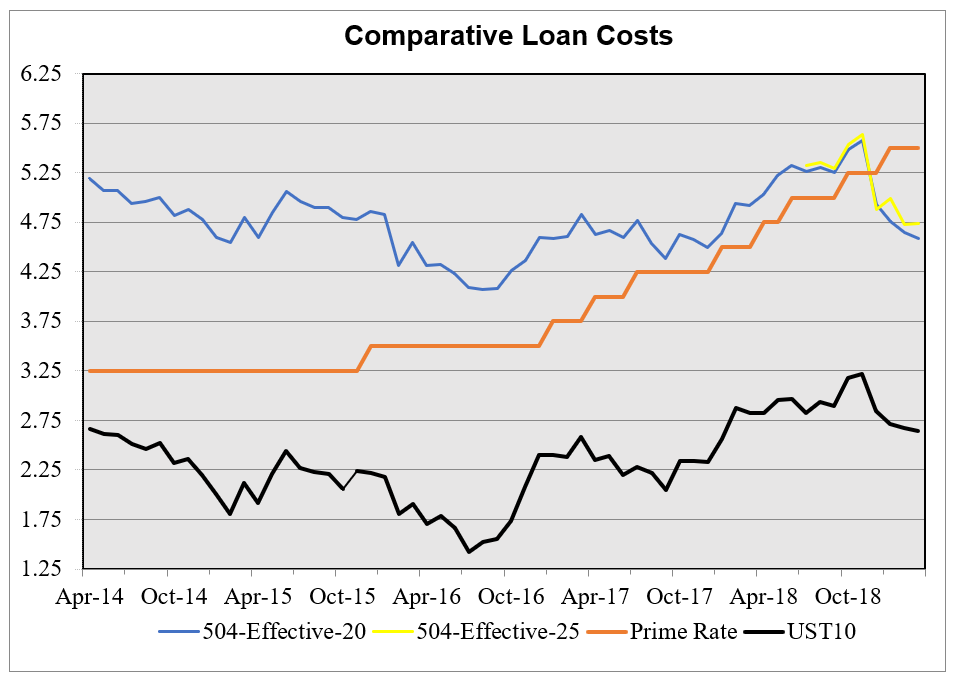
The Week Ahead
No Fed speak as we enter the blackout period ahead of the March 19-20 FOMC meeting, Treasury to auction $165 billion in debt, and some inflation and manufacturing reports.
Monday – Treasury sells $87 billion 13 and 26-week Bills and $38 billion 3-year Notes
Tuesday – CPI expected to be 0.2%, 2.2% y/y, Treasury sells $24 billion 10-year Notes
Wednesday – Durable Goods forecast to be -0.8% after a 1.2% gain in December; PPI consensus is 0.2%; Treasury sells $16 billion 10-year Notes
Friday – Industrial Production expected to be 0.4%
March 4, 2019
Slower, but Not Slow
The economy slowed in 4Q2018 to 2.6% from a robust 3.4% the previous quarter, but still finished the year with growth at 2.9%.
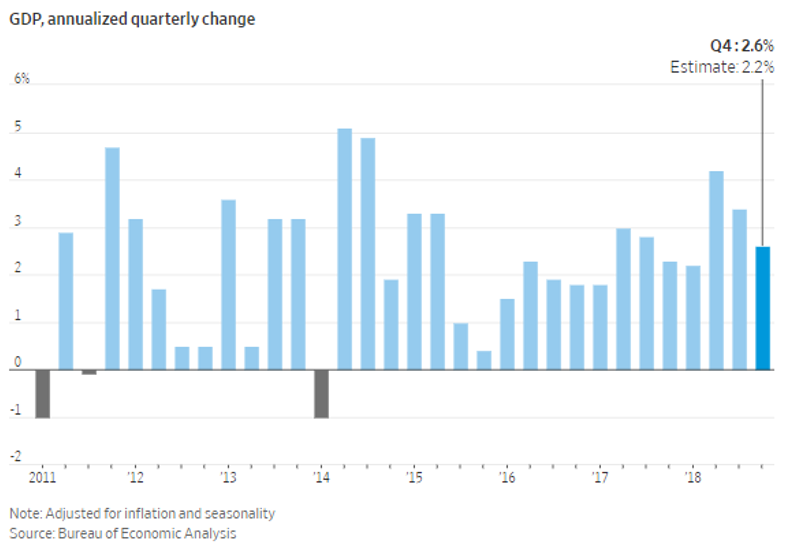
The decline can be attributed to the mid-year surge resulting from the 2017 tax cuts and increased government spending. With the positive effects of those measures fading, the Federal Reserve Bank forecasts 2019 growth to be even lower, at 2.3%. Such a forecast, coupled with overall global concerns, reflects the patient approach to interest rate hikes that Jerome Powell reinforced during his Congressional testimony last week.
The new year has started with reports of slowing growth as measured by declines in both the Purchasing Managers Index and the Institute of Supply Management Manufacturing Index. Personal Income declined 0.1% and the core Personal Consumption Expenditure inflation gauge was 0.2%, 1.9% y/y.
Market performance ranged from equities being flat on the week while the rates market saw a 9 bps increase in the ten-year benchmark, as seen in this 5-day WSJ chart. At 2.75% the benchmark is at its highest level in five-weeks and 8bps above where the 504 program priced its February debentures.
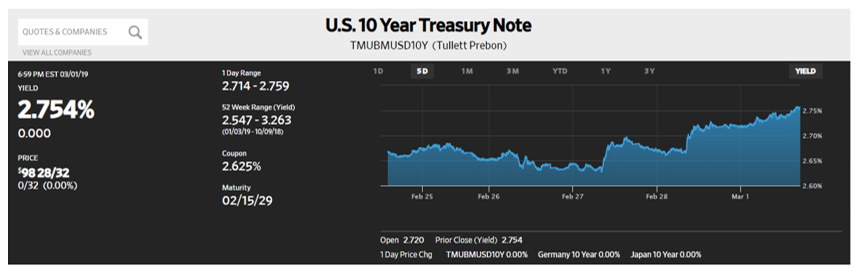
The Week Ahead
At $22 trillion the government has reached the limit that it can spend to fund operations. An increase in the debt ceiling is needed as Treasury employs extraordinary measures to conserve cash and make payments to bond holders, federal benefit recipients and others. Scheduled issuance for the week is limited to $87 billion 13 and 26-week Bills; the SBA 504 program will sell 10, 20 and 25 year debentures, some Fed speak, and the February jobs report.
Monday – Treasury sells 13 and 26-week Bills
Tuesday – New Home Sales
Thursday – 504 program prices its March debentures
Friday – Housing Starts, and Non-Farm Payroll expected to be 178,000, with average hourly earnings +0.3%
February 25, 2019
The Week in Review
Deal or No Deal?
As of now, there is no deal on US-China trade negotiations, but persistent reports of progress continue to provide hope to the equity markets, even after being rocked by a $15 billion impairment announced last week by Kraft Heinz Co., driving down its stock price by 27%. Indicative of overall investor confidence is the YTD performance of the S&P 500 index, which is +11%.
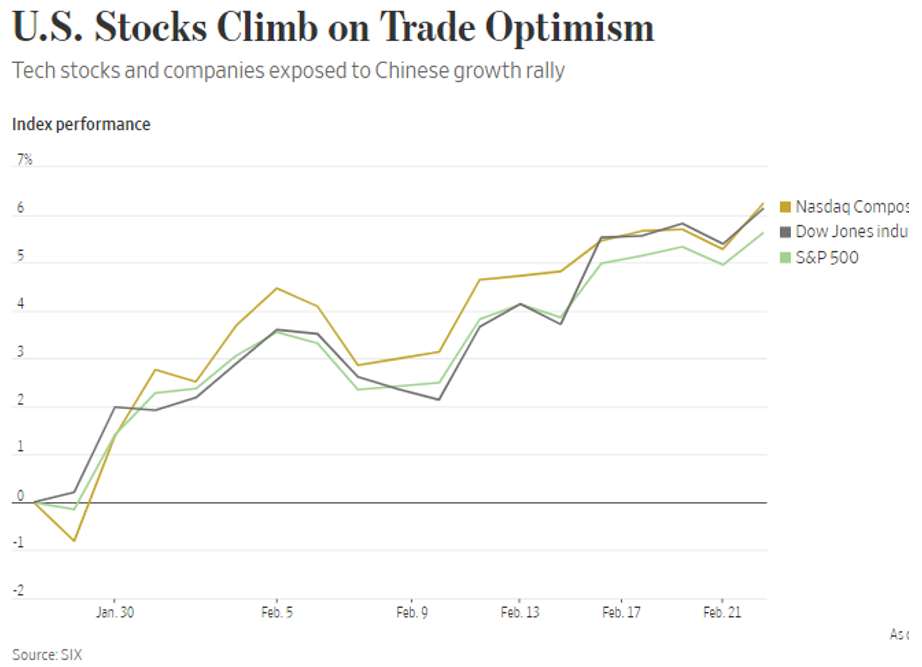
All three US indexes gained at least 0.5% on the week, helped not only by a less aggressive monetary policy from the Fed, but also in anticipation that trade negotiators can achieve an agreement to avoid increased trade tariffs. A March 1 date for implementation of the tariffs has been extended, and while that is helpful, a final agreement would best serve all parties. The effect on Treasury rates has been minimal as the benchmark ten-year Note was unchanged on the week, closing at 2.66%, virtually unchanged from when the SBA 504 program priced this month’s debentures on February 7, and down 8 bps from the January debenture sales.
The European Central Bank’s deposit facility rate of -0.40% is intended to discourage borrowers and consumers from keeping money in a bank or other financial institution, yet there it sits. Failing to promote increased consumption, markets now have 23% of outstanding global, sovereign debt at negative yields.
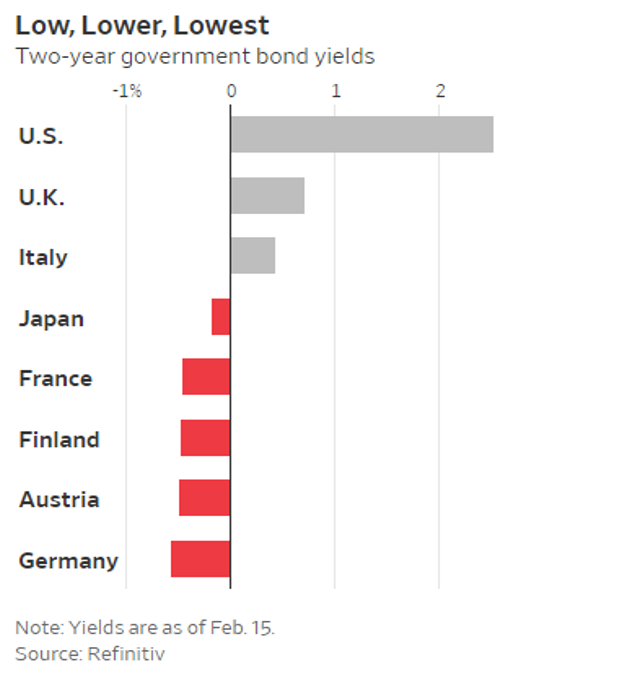
Insurance companies, mutual funds, banks and other institutional investors are compelled to match liabilities or an index, so a monetary policy intended to discourage this type of investment supports it instead.
Wednesday’s release of minutes from the January 30 FOMC meeting confirmed that the Committee looks for its balance sheet contraction to end later this year. A portfolio that stood at $900 million before the financial crisis grew to $4.3 billion in 2014, and now sits at $3.8 billion. This is another reason why Treasury rates are sitting in a vacuum as the Fed will remain engaged with some reinvestments of cash payments. The minutes also identified there are “few risks” that might result from pausing planned rate hikes as inflation remains stubbornly lower than its projected models. Low unemployment and rising wage growth have not lifted the Fed’s preferred inflation gauge, which will be updated this Friday. Economic reports were conflicted as above consensus Durable Goods at+1.2% was in contrast to Existing Home Sales that remain weak at -1.2%.
The Week Ahead
Treasury to auction $226 billion in debt, Fed speak is focused on Jerome Powell’s Congressional testimony, and major economic reports are 4Q18 GDP and Personal Consumption Expenditure.
Monday – Treasury sells $87 billion 13 and 26-week Bills, $40 billion two-year Notes, and $41 billion five-year Notes.
Tuesday – Jerome Powell testifies before the Senate, and Treasury sells $26 billion 52-week Bills and $32 billion seven-year Notes. President Trump meets with Kim Jong Un in Hanoi .
Wednesday – Jerome Powell testifies before the House, and Factory Orders are forecast to be 0.6%.
Thursday – initial 4Q18 GDP expected to be 2.4%vs. 3Q18 report of 3.4%.
Friday – Personal Income forecast to be 0.2%, Core Personal Consumption Expenditure to be 0.2%, and 1.9% y/y, and Institute of Supply Management expected to hold its steady gains.
February 19, 2019
The Good
- A second government shutdown was averted when Congress passed its spending package and it was signed by the President even though it provided just $1.38 billion for a border wall. That resulted in a National Emergency being declared, where the President will attempt to fund his initiative without Congressional approval and probably face a constitutional challenge.
- Another positive was the recent performance of domestic equity markets, with NASDAQ exiting its recent bear market, posting its eighth consecutive weekly gain and closing up 18% over the last two-months.
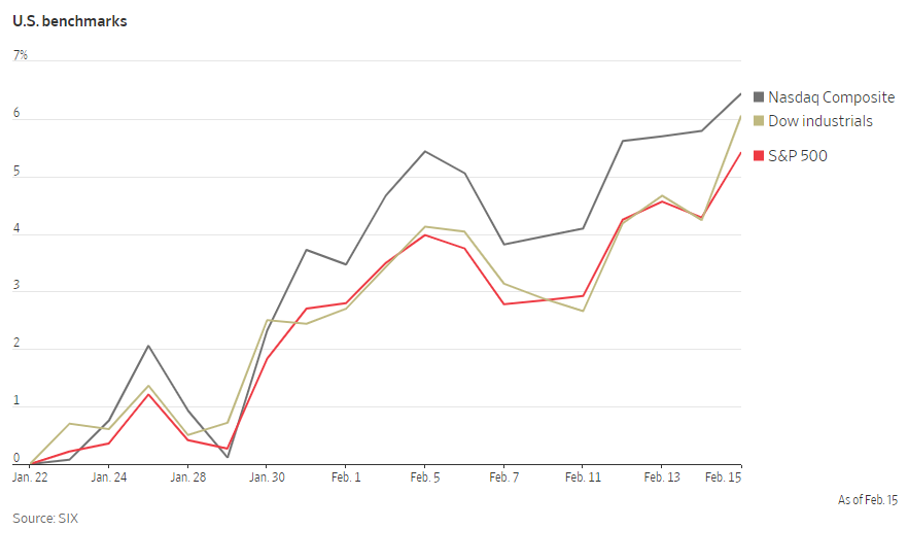
- Fed Chairman Powell continues to stress the economy is growing at a solid pace with strong employment.
- Foreign investors sold a record $77.4 billion of US Treasuries in December, taking advantage of a rally that saw the benchmark ten-year Note decline 31 bps on the month. The largest region of sellers was the Cayman Islands, indicating hedge funds located there may have been booking profits before year-end. Why is that good? The market absorbed that selling plus heavy Treasury issuance in January, holding most of those gains and closing the week at 2.66%.
The Bad
- Retail Sales declined 1.2% in December, the steepest decline in ten-years, and ex-autos' the decline was 1.8%.
- CPI was 0.0%, unchanged for the third straight month and PPI was -0.1%, vs. a forecast of +0.2%.
- Factory output fell sharply in January, declining 0.6% vs. a consensus forecast of 0.1%. Softening the disappointing number was the y/y gain of 3.9%.
- A Reuters poll of 110 economists assigns a 1 in 4 chance of a recession in the next twelve-months, while predicting just one rate increase in 2019, after which the Fed is expected to halt its tightening policy.
The Ugly
- A record 7 million Americans are 90-days or more late on their car loan payments. Per a quote from this NY Fed report: “the substantial and growing number of distressed borrowers suggests that not all Americans have benefited from the strong labor market.” The bank also said this figure is 1 million more than in 2010 when unemployment was 10%.
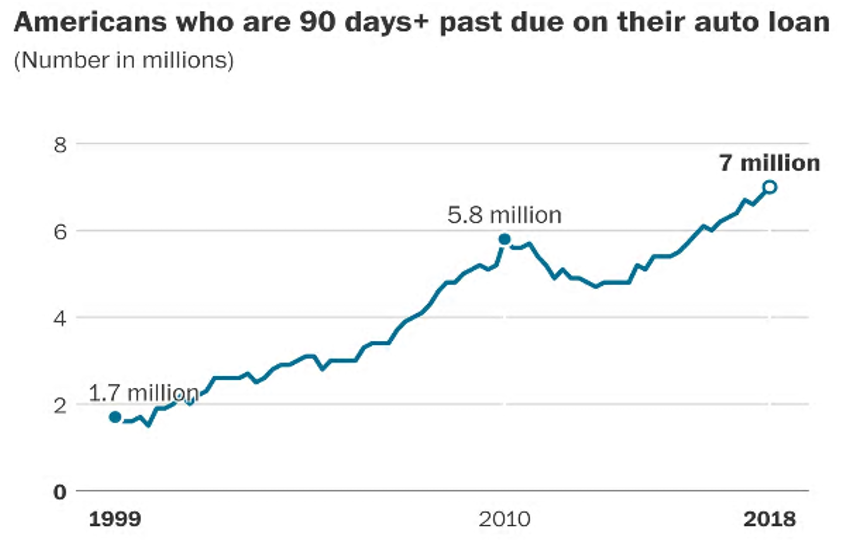
The Week Ahead
A lot of Fed speak is scheduled, Treasury to sell $110 billion in debt, and a light economic calendar.
Monday – Treasury to sell $84 billion in 13 and 25-week Bills
Wednesday – Treasury auctions $18 billion in 23-month Floating Rate Notes; Minutes from the 1/30/2019 FOMC meeting are released
Thursday – Treasury auctions $8 billion 30-year Treasury Inflation Protected Securities; Purchasing Managers Index composite flash expected to hold steady
February 11, 2019
No Pause in Rate Rally
Capital markets continue to embrace the Fed’s patient approach to rate hikes, with the ten-year benchmark ending the week 9 bps lower than its December 19 close, the same day the central bank raised rates for the eighth time in this cycle.
What it means for the 504 program is continued low funding costs for small business borrowers, with both February issues’ effective rates dramatically below the Prime Rate.
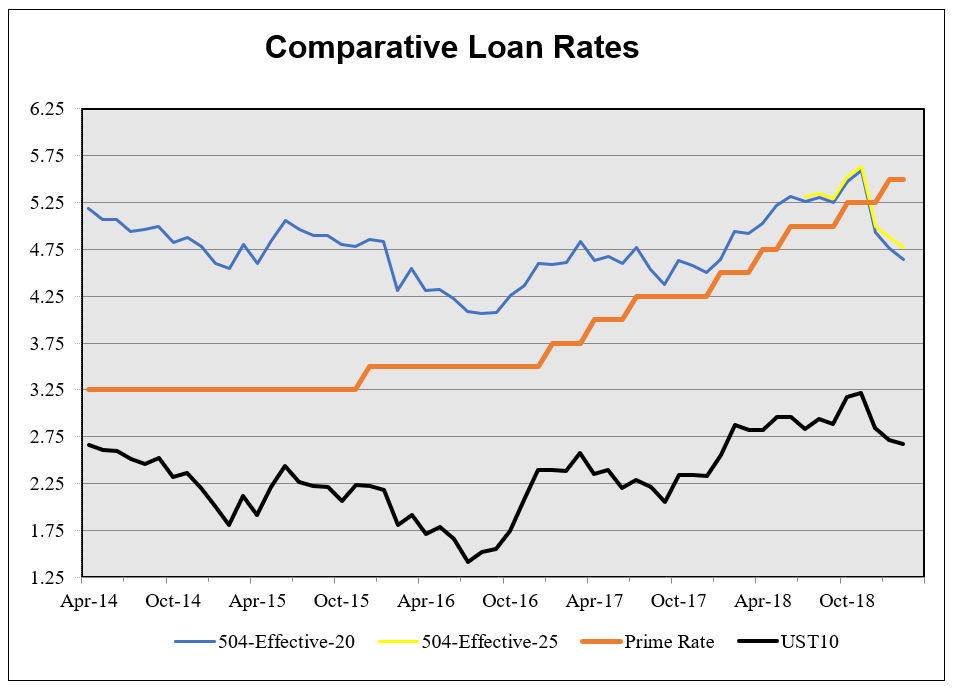
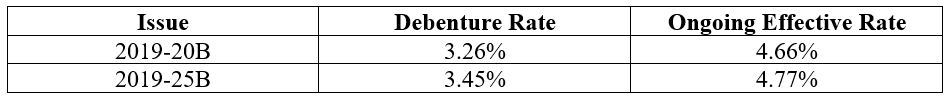
Part of the reason for these low rates is the caution that has followed recent downward revisions for global economic growth, reversing projections that have been proved to be too optimistic. This Financial Times chart displays the decline in American imports, especially from China, that is driving a slowdown in trade and compelling other central banks to reverse previously planned rate increases. There is a March 1 expiration date for the tariff truce and negotiations are as shaky as the budget negotiations.
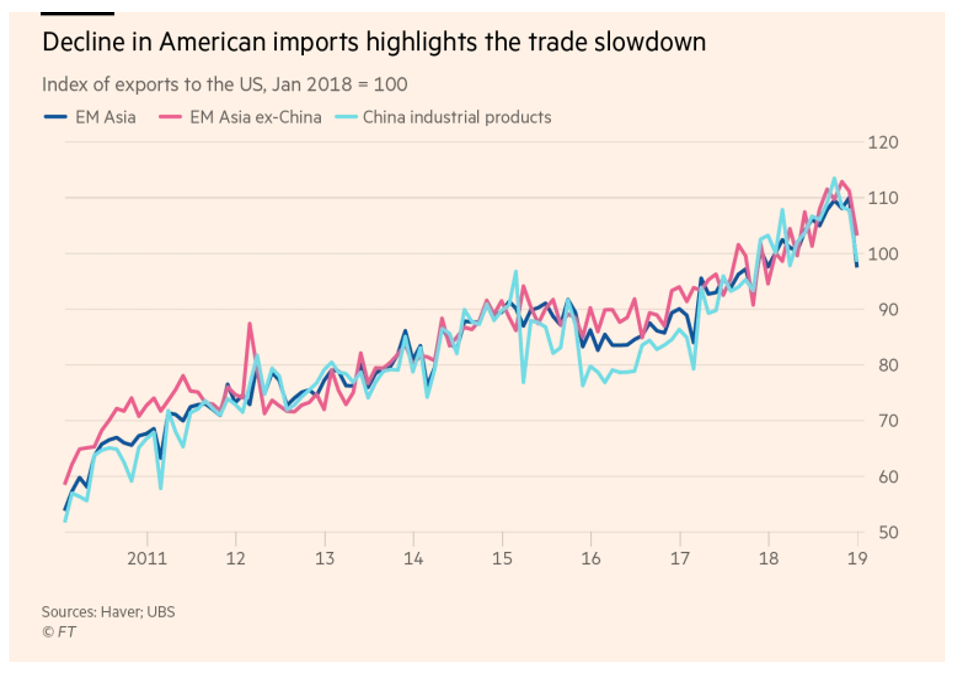
Following Chairman Powell’s announcement to pause rate hikes, and amplified by Trump administration comments, the Reserve Bank of India cut short-term rates by 25 bps, and the Bank of England revised its near-term growth lower to 1.2% and is stepping back from its plans for a tighter monetary policy. The contentious Brexit talks are also a cause for this revision.
Caution on Treasury Debt
The private sector Treasury Bond Advisory Group commented on reduced holdings of Treasury debt by non-American entities as being at 36%, down from 45% in 2009, and identifying $12 trillion of debt that will need to be funded over the next ten years. For now, domestic accounts, helped by household savers, have filled the gap.
The Week Ahead
Hopes for a budget agreement to avoid another government shutdown will dominate the next five days since weekend negotiations were unproductive. Treasury financing is light at $84 billion of short-term Bills, Fed speak is relevant, and there are some economic reports.
Monday – Treasury sells $84 billion of 13 and 26 week Bills
Wednesday – CPI expected to be 0.1%; Pitchers & Catchers report
Thursday – PPI expected to be 0.2%; Retail Sales forecast is 0.1%
Friday – Industrial Production expected to be 0.2%
February 4, 2019
U-Turn
As described in a Financial Times article, the Fed seems to have pivoted on its monetary policy and is prepared to embrace a more accommodative stance in response to weaker global indicators. Chairman Powell’s affirmation on Wednesday that the Committee will pursue a patient approach provided the expected comfort to the equity market as all three domestic indexes gained at least 1.3% for the week. In announcing that the Fed is standing pat, he emphasized three items that drive policy:
- The Fed Funds rate (2.25-2.50%) is the active monetary tool;
- The Committee will not hesitate to make changes in light of financial developments;
- While Fed Funds is the main tool, the economy could create a situation where it is not sufficient, like when they initiated Quantitative Easing by aggressively increasing its balance sheet with the purchase of billions of dollars of Treasury and Mortgage Backed securities.
Speaking of the bank’s balance sheet, its reduction also will be slowed, a contributing factor to the benchmark ten-year Note improving 7 bps on the week, and even more before a strong Institute of Supply Management report on Friday scaled back some of its gains.
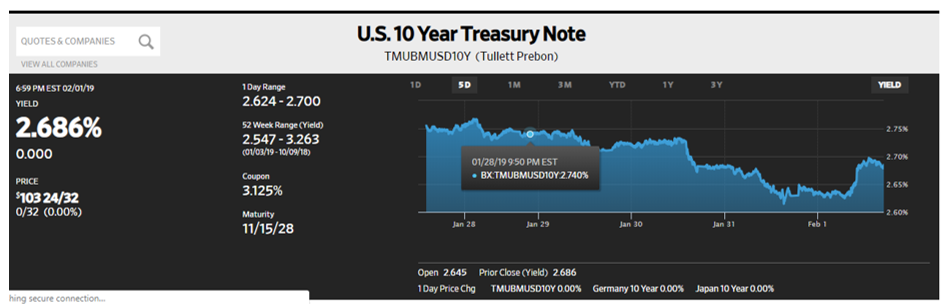
That effect of that report was enhanced by a much stronger than expected jobs gain of 304,000, the 100th straight month of increased employment as the private sector shrugged off the government shutdown. The report did contain some ambiguous items, like December’s report being revised down by 90,000 and the Unemployment Rate increasing to 4.0%, while the Labor Force Participation Rate increased to 63.2%. The modest average hourly wage gain of 0.1% (3.6% y/y) does support the belief that inflation is subdued, remaining just below the Fed’s target of 2%.
European Weakness
Possessing the largest economy in the world, as well as its reserve currency, the Fed’s actions have a profound effect on global economies, and its announced pause reflects that. Some recent, and other ongoing issues they consider are:
- Italy slipped back into an official recession, its third since 2008, when it announced 4Q18 GDP was -0.2%.
- China’s slowing economy is dragging down its European trade partners.
- UK’s exit from the European Union remains messy, and its resolution is important as it will establish precedent should other members, like Italy’s progressive leadership, also choose to withdraw from the Union.
- The European Central Bank is getting out of the market as the European Union economy is losing momentum, having grown at a 0.2% rate in 4Q18.
The Week Ahead
Treasury conducts its quarterly refunding as part of $218 billion in sales, the SBA 504 program prices its February 20 and 25-year debentures, much Fed speak, and possibly some economic reports delayed by the shutdown.
Monday – Treasury auctions $84 billion 13 and 26-week Bills; Factory Orders forecast to be 0.4%
Tuesday – Treasury auctions $38 billion three-year Notes
Wednesday – Treasury auctions $50 billion 18-day cash management Bills and $27 billion ten-year Notes
Thursday – the 504 program prices its 20 and 25-year debentures, Treasury auctions $19 billion thirty-year Bonds, and the Fed’s Balance Sheet is released
January 28, 2019
It’s Over (for now)!
Friday’s announcement that the partial government shutdown would end helped equity markets recover from losses earlier in the week, proving their resilience in the wake of shaky data from China. This WSJ chart shows how Friday’s recovery helped equities close flat on the week as encouraging domestic corporate results were offset by reports like the International Monetary Fund, stating that global activity is weakening at a faster than expected pace. Trade tensions remain high with contradictory statements adding to confusion about negotiations.
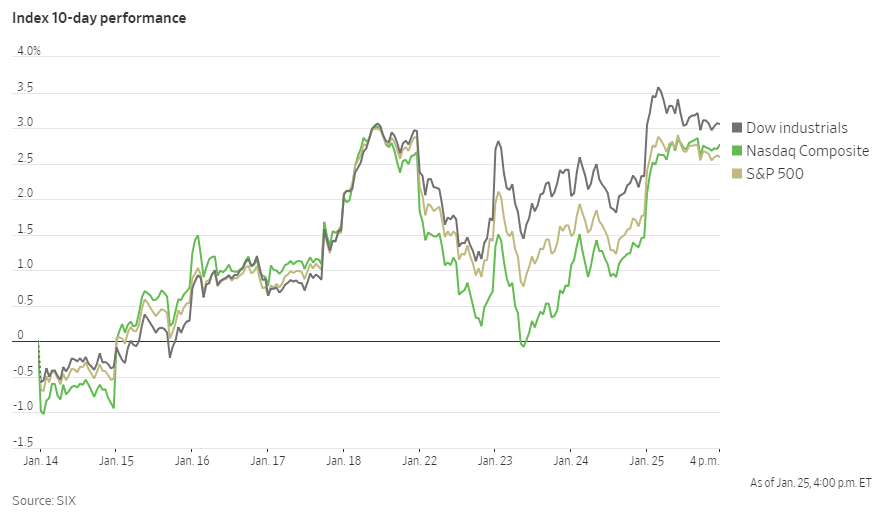
Concerns over economic growth have been evidenced by recent Fed official comments hinting at a pause in planned rate hikes, joined by comments now about the bank holding a larger portfolio of securities, a topic that may command more attention at this week’s meeting. The drawdown in their balance sheet holdings has been referred to as Quantitative Tightening, as the bank’s holdings have declined from $4.3 trillion to about $3.9 trillion, reducing reserves and making credit spreads and equities less attractive. Besides debating the size of its portfolio, consideration will be given to the maturities it holds, currently weighted with longer dated debt.
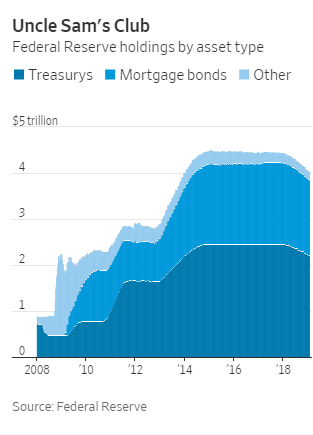
The impact on the Treasury market has been to stabilize rates, with the benchmark ten-year note closing Friday at 2.76%, just 5 bps higher than when the 504 program priced this month’s debentures on January 10.
Decisions
These will take place in two locales over the next few weeks – domestically and the UK. The three week reprieve for the government shutdown hopefully will result in a conclusive agreement re: immigration; a border wall to be restrictive and a permanent solution for immigrants already here as part of the DACA program, plus related issues. Funding through FY2019 should be the goal of these negotiations.
In the UK, Parliament will vote again on Theresa May’s updated Brexit plan, which is almost identical to the initial proposal. That vote is Tuesday, and the country’s March 29 deadline to leave the European Union does not allow much time for an alternative solution.
The Week Ahead
A very active week with Treasury to auction $240 billion in debt, the FOMC to meet, the Committee will get its preferred inflation gauge on Thursday, and then the December jobs report ends the week.
Monday – Treasury to sell $81 billion in 13 and 26-week Bills; $40 billion two-year Notes; and $41 billion five-year NotesTuesday – FOMC meeting begins; Treasury to auction $26 billion 52-week Bills, and $20 billion two-year Floating Rate Notes; UK Parliament to vote on a “revised” Brexit plan
Wednesday – Treasury auctions $32 billion seven-year Notes; first estimate of 4Q GDP expected to be 2.6%; FOMC announcement at 2:00 is expected to have no change in policy, followed by a press conference at 2:30
Thursday – Personal Income forecast to be 0.4%, and core PCE to be 0.2%, 1.9% y/y
Friday – Non-Farm Payroll forecast to be 158,000
January 22, 2019
Trade Tensions Reduced
Hopes that the US would scale back some of the tariffs imposed on Chinese imports and China rumored to be committing to additional purchases of US goods were aided by strong quarterly earnings to boost equities last week. The S&P 500 index gained 2.9% w/w, with its Financials Index even stronger with a 6.1% gain, its best weekly performance since November 2011.
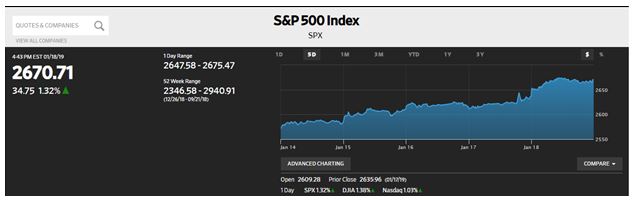
With increased confidence in equities, US Treasuries lost ground with the benchmark ten-year Note closing at 2.79%, its highest yield since just before Christmas, but just 16 bps higher than on this date one-year ago. That performance speaks to the building market sentiment for the Fed to pause its tighter monetary policy by reducing or eliminating previously planned rate increases for this year. A stronger than forecast Industrial Production report of 0.3% helped investors increase their risk appetite, helping to offset a dramatically lower reading for Consumer Sentiment earlier in the week. That reading was 90.7, down from 98.3 in December and the lowest reading since October 2016. An additional cautionary note is China’s report of a third consecutive quarterly decline in GDP, stirring an ongoing concern that such continued weakness could damage global econimic growth.
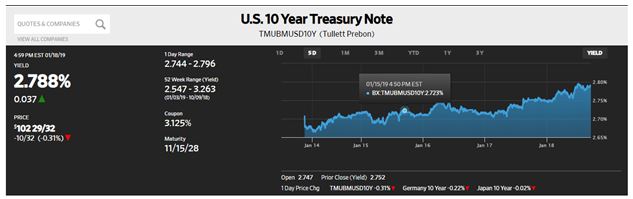
Deal, or No Deal?
The Brexit debate lingers after Theresa May’s proposed plan to leave the EU was rejected by Parliament, though her government did survive a vote of no-confidence; barely. An adjusted Brexit deal is scheduled for debate in the House of Commons on January 29, just two-months before the departure is to take effect, while fears of a no-deal Brexit are increasing.
Definitely No Deal
An offer to extend protections for DACA immigrants in exchange for the $5.7 billion wall construction was summarily rejected by Democrats, calling the offer a “non-starter.” Included in the offer were proposals for additional humanitarian assistance, drug detection measures, and increased staffing for border patrols and immigration judges. Presidential advisors described the offer as the most aggressive one the President could consider, so it appears ending the shutdown first is the only way Democratic leaders will resume negotiations.
The Week Ahead
A holiday shortened week has a light Treasury calendar, no Fed speak ahead of the 1/29-30 FOMC meeting, and the one economic report of note, Durable Goods, may be affected by the government shutdown.
Tuesday – Treasury to auction $81 billion 13 and 26-week Bills
Thursday – TBD amounts of 4 and 8 week Bills to be auctioned
Friday – Durable goods orders forecast to be 1.8%
January 14, 2019
If the Fed Pauses, Which Pause Will It Be?
This Financial Times chart shows two recent tightening cycles, in 2006 and 2016. In the first, the pause led to rate cuts necessitated by the financial markets turmoil. In the second, after the first rate hike in December 2015, the Fed paused for a year in response to market conditions, then followed with seven additional rate hikes. In both instances, equity markets rallied and that may explain why those markets have been up 10% since their December low, while the ten-year Treasury benchmark has stabilized more than 55 bps lower than its 4Q18 high yield. Now, it seems the markets have settled in expecting a reduced number, if any, rate increases this year as expectations are for a slowing economy and the central bank has expressed how it intends to be patient with its tightening policy.
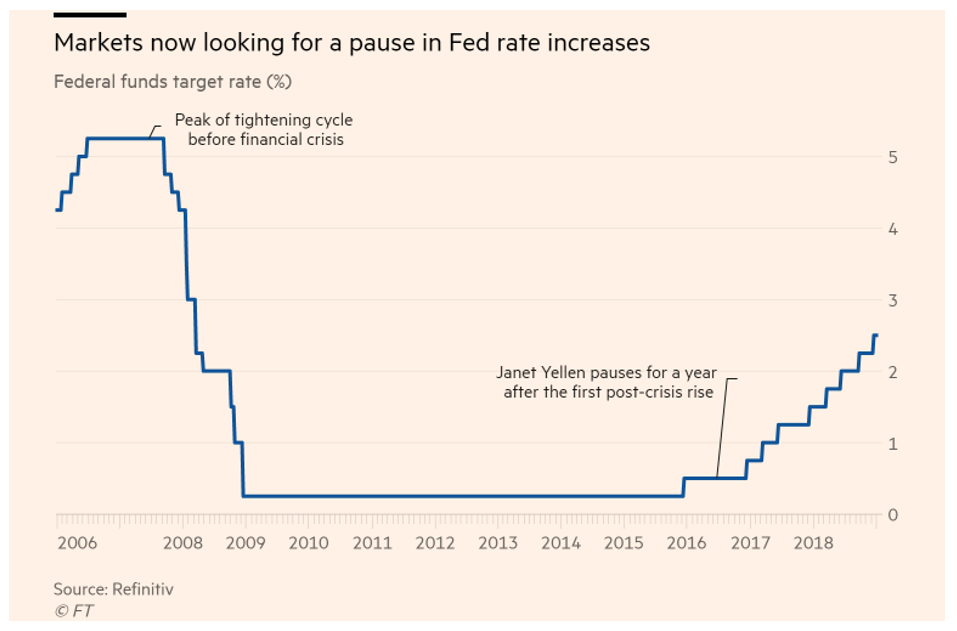
Adding to this sentiment was additional commentary from Chairman Powell re: the damage a continued government shutdown could have on the economy, and then reports from Macy’s and Apple concerning their lackluster performance, plus China reporting sharp declines in both imports and exports for December.
Rates Rally
Speaking of that 55 bps move in Treasury rates, here is a WSJ chart tracking the 3-month performance of the ten-year benchmark; a period that includes the eighth, and most recent increase on December 19th. Helping rates rally late last week was a weaker than expected Consumer Price Index report of -0.1%, its first decline in nine-months.
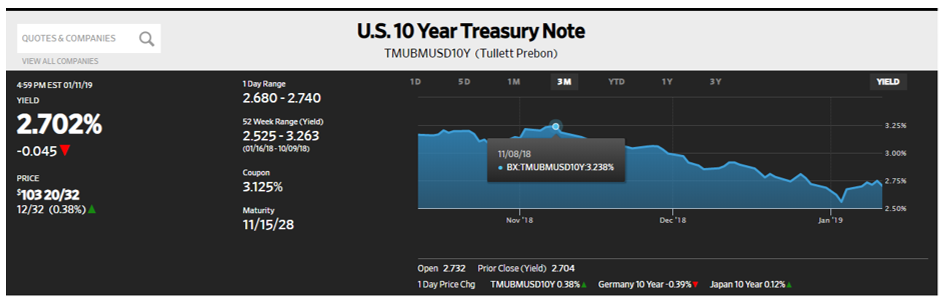
With the drop in rates, credit market spreads have been pressured, but are now stabilizing as market participants seem to be heeding Chairman Powell’s mantra of patience. Amidst the market turmoil and the inability of High Yield issuers to come to market, the SBA 504 program priced its January debentures at lower rates m/m. Most dramatic is the decline in the ten-year series from its November 8 sale date which pre-dated the most recent rate hike. As a result of this tightening cycle that has had the most impact on short-term rates, all three January debentures represent an ongoing effective rate to small business borrowers well below the Prime Rate of 5.50%.
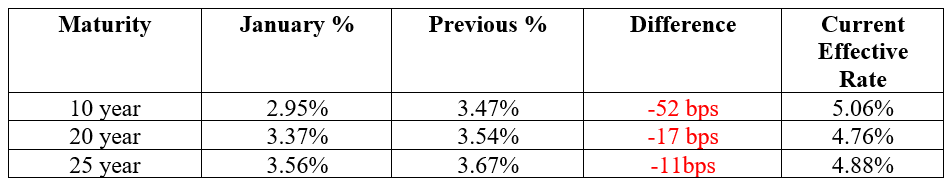
The New Record
At midnight Saturday, this government shutdown ended its 22nd day, making it the longest one in American history, and in need of a sudden shift in sentiment for things to change. Across the Atlantic, Britain continues its struggle to amicably exit the European Union as the Prime Minister’s proposal for its European Union agreement is likely to be defeated in Parliament. That vote could set the stage for a no-deal Brexit, whose prospect is already pressuring British financial markets.
The Week Ahead
Some economic reports, a light Treasury calendar, and a Parliament vote on Brexit.
Monday – Treasury auctions $75 billion 13 and 26-week Bills
Tuesday – PPI expected to be 0.1%, and the Brexit vote
Wednesday – Retail Sales forecast is 0.1%
Thursday – Treasury sells $13 billion ten-year TIPS, and a TBD amount of 4 and 8 week Bills
Friday – Industrial Production expected to be 0.3%
January 7, 2019
Patience
A noun: the capacity, habit, or fact of being patient, and a word used by Fed Chairman Powell on Friday after the release of December’s much stronger than expected jobs report. “US data seem to be on track to sustain good momentum into the new year,” adding the Fed would take a “patient” approach to monetary policy tightening, further stating the bank is “prepared to adjust policy quickly and flexibly if necessary.” That last comment expands past possible rate hikes to include a possible adjustment to its balance sheet policy. It was only three weeks ago that he stated that policy was on auto-pilot, meaning the bank would continue to shrink its portfolio by running off maturing securities and not reinvest proceeds in Treasury and mortgage backed debt. At the time, that comment resulted in another equity decline in excess of 2%, like last Thursday’s decline of almost 3% after Apple reduced its guidance for the current quarter. Adding to that pressure was a soft Institute of Supply Management report that was the weakest in two-years. This WSJ chart shows how Friday’s employment report and Mr. Powell’s comments helped reverse that move, with the DJIA gaining almost 750 points.
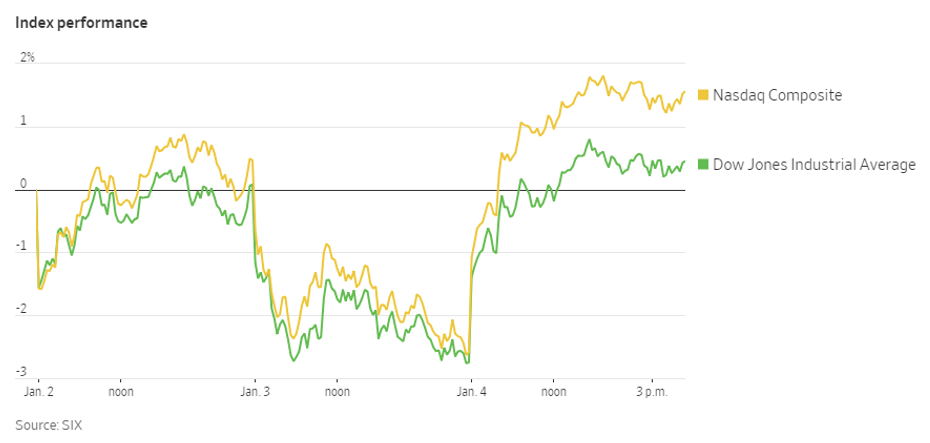
Key features for the December report were:
- 312,000 jobs filled, almost double the estimate of 170,000, with upward revisions to prior months
- Average hourly earnings grew at 0.4% m/m, and 3.2% y/y
- Unemployment rate increased to 3.9%
- The Labor Force Participation Rate increased to 63.1% and that is identified as a reason why the unemployment rate increased – more discouraged people coming off the sidelines to seek work
Safe-haven trade
The effect on capital markets was an increase in Treasury rates with the benchmark ten-year Note increasing 11 bps to 2.66%. Even with that move, Treasuries retain a safe-haven characteristic for investors as that rate is 18 bps lower than when the 504 program priced its December debentures, and prior to the most recent Fed rate hike on December 19.
Government Shutdown
The shutdown drags on into its third week with 800,000 federal workers on leave without pay, but it will not interfere with the 504 program’s ability to fund on schedule this month. The program will price 10, 20 and 25-year debentures on Thursday, to close on January 16.
Additionally, SBA has been pro-active in getting ahead of the curve regarding the February sale and anticipates that will pricing occur as scheduled on February 7, for closing on February 13. SBA has provided staffing at key sectors and extended deadlines for several of its funding participants.
Significant dates are:
Friday, January 11, which represents the day that federal workers miss checks and the federal court system runs out of money, forcing curtailment or postponement of some cases. Saturday, January 12, makes this the longest federal shutdown.
The Week Ahead
Treasury will sell $153 billion during its quarterly refunding and there are a couple of economic reports.
Monday – Treasury to auction $75 billion in 13 and 26-week Bills; Factory Orders expected to be 0.4% vs. last month’s -2.1%
Tuesday – Treasury will auction $38 billion three-year Notes
Wednesday – Treasury auctions $24 billion ten-year Notes, and FOMC minutes of the December meeting are released
Thursday – SBA 504 program to price its January debenture sales; Treasury to auction $16 billion thirty-year Bonds and Chairman Powell speaks at an economic forum
Friday – CPI expected to be 0.2%
January 2, 2019
Riding Out the Storm
This WSJ chart shows the one-month move in the benchmark ten-year Treasury note that has declined 35 bps in rate while the S&P 500 index has lost 10% in value. This shift was accomplished even as the FOMC raised interest rates on December 19 for the eighth time in this cycle, and the fourth time in 2018 alone.
This leaves the benchmark at a level not seen since January 2018 and it almost seems like the market is betting against the Fed raising rates this year, or, at least, less frequently.

Trade tensions, expectations for a global economic slowdown in 2019, and Fed Chairman Powell’s comment that Balance Sheet reduction would continue have been the main reasons for concern, but they were joined by upheaval in the President’s cabinet and then a government shutdown that is stretching into the new year.
In an attempt to calm the equity markets, Treasury Secretary Mnuchin tried to solve a problem that wasn’t a problem, when he announced that he had spoken to the leaders of the country’s six largest banks to confirm their liquidity. Bank liquidity is not a problem, investor confidence is frayed, resulting in most asset classes closing in the red for 2018 while the safe-haven trade into Treasuries has asserted itself. The Fed raised rates a total of 100 bps in 2018, yet the ten-year benchmark is higher by just 22 bps, and now short-tern Treasury Bills offer a guaranteed yield (2.40%) equal to the dividend yield of the S&P 500 index, which declined 6.2% for the year.
Government Shutdown
Prospects are grim as the President’s demand for $5 billion for a border wall is being stonewalled by the Democrats, who are about to take control of the House. Hundreds of thousands of federal workers are on leave while thousands more are working with no pay. Additionally, it must be noted that $5 billion is probably just a deposit on what such a wall will cost. Labor, land acquisition, and electronic surveillance systems will certainly swell that figure, leading to future Congressional conflicts over its funding. House Democrats have proposed a Thursday vote to end the shutdown, but it contains only a fraction of the demanded $5 billion.
The shutdown imposed a sense of immediacy for the 504 program to process loans for the January debenture sales, and the system has managed it very well. The January pricing will take place next Thursday, with funding on the following Wednesday, January 16.
The Week Ahead
What lies ahead is uncertainty, for sure. Treasury auctions took place on Monday, and economic reports are few, though the jobs report is always important.
Monday – Treasury auctioned $101 billion in 13, 26, and 52 week T-Bills
Thursday – Institute of Supply Management report and the House vote to end the shutdown
Friday – Non-Farm Payroll expected to be 185,000 with an unemployment rate of 3.6%
December 17, 2018
Nowhere to Hide
This NY Times chart shows how five major investment classes have dropped in unison this year, something that rarely happens, as the impact of rising rates, trade tensions, and weakening economic reports have taken their toll.
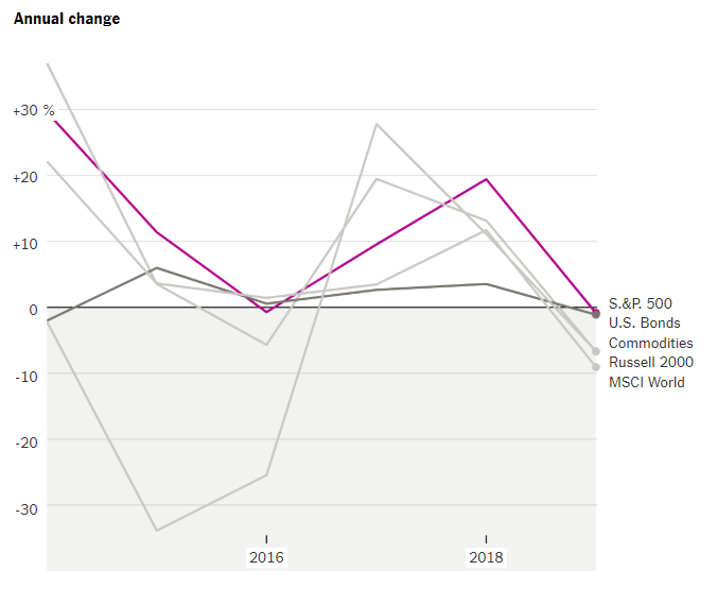
The article states that if this persists it can create a dangerous feedback loop with doubts about the economy hurting the markets, and trouble in the markets hurting growth. As recently as September 20th the NASDAQ was +15% and WTI crude oil was +20% for the year; those gains are gone and Thursday’s report that Chinese Industrial Production was just +5.4% for November was identified as a catalyst for Friday’s 2% decline in equity markets. This was its smallest gain in nine-years.
While a gain of 5.4% might sound positive, this WSJ chart shows the declining trend for the world’s second largest economy, a driving force for much of global trade. By comparison, the US gain for November was 0.6%, an improvement on the forecast of 0.3%.
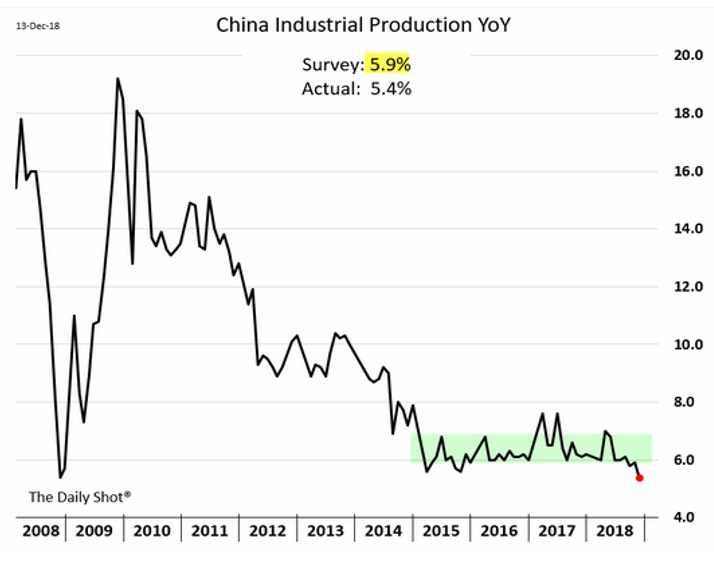
Adding to the week’s events was further confusion about Brexit, a downward revision for European Union growth to 1.9%, and confirmation from the European Central Bank that it would end its bond purchases this month, concluding its QE program that bought €2.6 trillion bonds. The bank did keep its overnight lending rate at -0.40%. Ending QE had been previously broadcast, and its termination was softened by the bank’s pledge to hold the purchased securities “for an extended period of time” until after its first rate hike, expected to occur in late 2019. Domestic Treasury rates maintained their safe-haven status, though the ten-year benchmark increased slightly in rate to 2.89%, just 5 bps above where the 504 program priced its December debenture sales. Suffering more than other credit products is High Yield, where rates have increased 100 bps since the September high in equities, and where for the first December since 2008 not one issue has been brought to market.
Some Sunshine
According to the National Federation of Independent Business, small business optimism continues its strong two-year trend, even with a modest decline in November. An increasing number of owners reported capital outlays and higher sales, with job creation rising to a net addition of 0.19 workers per firm. As positive at that is, most owners are cautious about the economy’s ability to improve.
The Week Ahead
All eyes will be on the Fed, widely expected to make its eighth rate hike, raising rates to a range of 2.25%-2.50%, a possible government shutdown is tentatively scheduled for a vote on Wednesday night, and Treasury to auction $72 billion T-Bills and $14 billion TIPS.
Monday – Treasury sells $39 billion 13-week and $36 billion 26-week Bills
Wednesday – 2:00 FOMC Announcement, followed by the Committee’s forecasts and a Jay Powell press conference
Thursday -Treasury to auction $14 billion 52-month Treasury Inflation Protected Securities
Friday – Durable Goods expected to be 1.5% after a 4.5% decline in October; third estimate of 3Q18 GDP expected to be unchanged at 3.5%; and the Fed’s preferred inflation gauge, Personal Consumption Expenditures, is forecast to be a 0.2% core rate, 1.9% y/y
December 10, 2018
Back into the Red
After early gains resulting from the temporary halt to increased tariffs, the stock market reversed course on Tuesday and accelerated its decline into the end of the week. Administration comments that it would take a tough stand, or increase tariffs, during the 90-day trade negotiations with China were identified as causes of the slump. The weekly selloff was the largest since March and the early December performance is the month’s worst in ten-years, pushing the major indexes into the red for the year. This WSJ chart shows the DJIA down 4.5% for the week and NASDAQ down 4.9%.
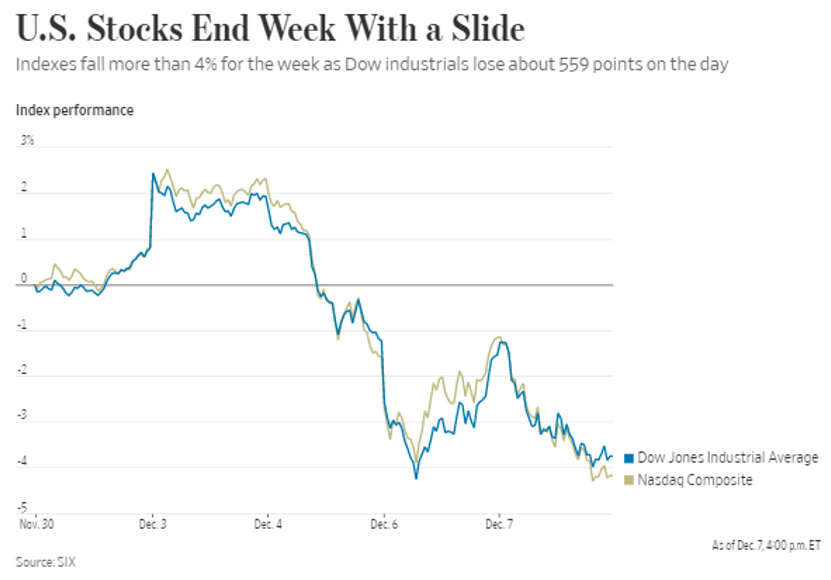
Analysts have identified at least three reasons for this seemingly sudden realization that economic growth may be waning:
- Three years of rate increases are pinching interest rate sensitive sectors of the economy
- The trade war between US and China has had a real impact on economic activity
- The tax cut that lifted corporate earnings and economic growth in 2018 will not be repeated in 2019, understandably pointing to slower growth.
With 2018 GDP surpassing forecasts and now expected to remain above 3%, the previous pessimistic forecasts for 2019 and 2020 may result in a bigger drop-off than predicted. Even Friday’s report of steady wage growth and low unemployment were overshadowed by a jobs gain of 155,000, below forecast but representative of the 98th consecutive monthly gain.
DCPC Sales
One market’s weakness leads to another market’s strength and that saw the SBA 504 program benefit from the safe-haven trade into Treasuries, pricing its December 20 and 25 year debentures 33 bps lower than in November. The 5 bps wider pricing spread reflects the widening of credit spreads in response to the safe-haven trade and continued flattening of the 2/10 Treasury curve. What is most impressive about these sales is that both have ongoing effective rates below 5% for any loans that were processed since October 1st.
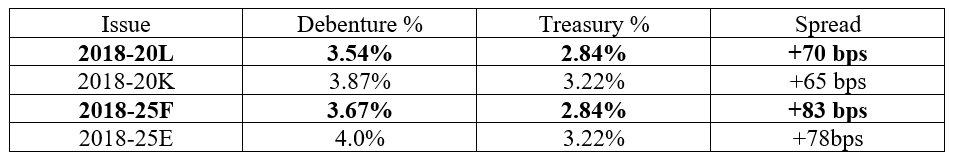
The Week Ahead
There is no Fed speak as we are in the blackout period leading up to the 12/18-19 FOMC meeting, some secondary inflation data, and the Treasury’s quarterly refunding.
Monday – Treasury auctions $75 billion 13 and 26-week Bills
Tuesday – Core PPI expected to be 0.2%, 2.8% y/y; Treasury auctions $38 billion 3-year Notes, and President Trump meets with Democratic Senate leaders to discuss budget plans ahead of a potential government shutdown
Wednesday – Core CPI forecast to be 0.2%, 2.2% y/y and Treasury sells $24 billion ten-year Notes
Thursday – Treasury auctions $16 billion 30-year Bonds
Friday – Retail Sales forecast to be 0.1% after a 0.8% gain in October; Industrial Production expected to be 0.3%
December 3, 2018
Quote of the Week – “just below” Neutral Rate
With those words Fed Chairman Jay Powell deftly gave support to those who hope to see the Fed pause their rate hikes while simply confirming that the Committee is on track to achieve a neutral rate. The S&P 500 index surged 2.3% on the day, its strongest performance since March, with the benchmark ten-year Treasury held firm, eventually declining to 3.01% to close the week. This neutral rate is a point where economists believe policy is neither helping nor hurting the economy and has always been the Fed’s objective, previously stated as being between 2.5% and 3.5%. With Fed Funds currently at 2.0%-2.25% a December increase would bring us to 2.25%-2.5%, technically reaching the lower end of their targeted range; so, Chairman Powell confirmed that we are approaching that level without saying the Fed might slow down. Wednesday’s comment does modify his October quote that we were “a long way away from neutral rate” which had been identified as a partial catalyst for equity market weakness, reinforcing the impact that “Fed speak” can have on markets.
Even Thursday’s release of the minutes of the November 7-8 FOMC meeting suggesting near unanimity for continued rate hikes had little negative impact on stocks or bonds. This StockCharts.com chart for the ten-year Treasury shows its rate decline over the last four weeks, threatening to break through 3.0% again, even as the market expects the Fed to increase rates at its December 18-19 meeting. A Bloomberg poll of analysts expects the Note to gently resume a sell-off, ending December near 3.21%, and serving as a reminder of how conflicted the markets are. The potential “Fed pause” trade is a 2019 possibility, so unless there is some additional headline news the benchmark note’s rally may have run its course.
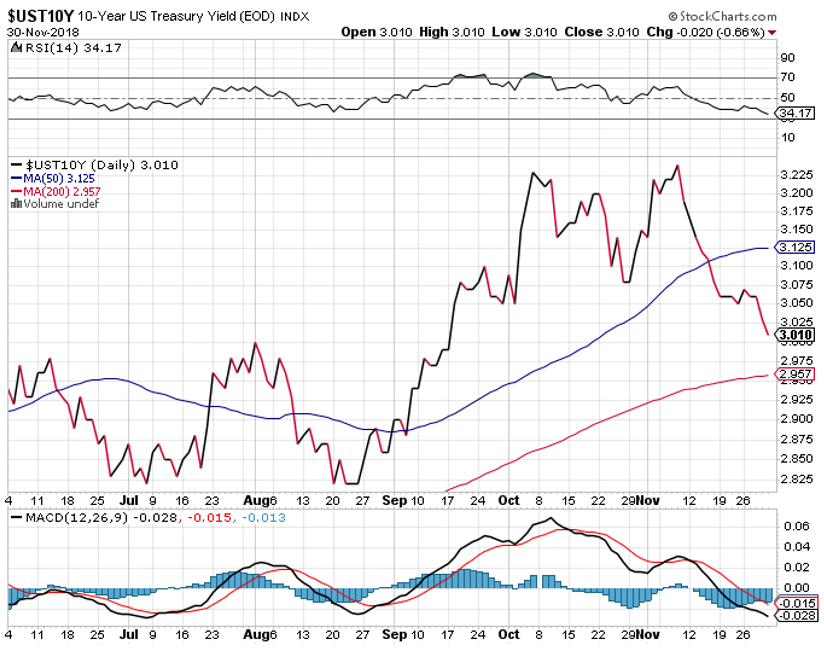
President Trump’s decision to delay increasing the 10% tariff on $200 billion of Chinese imports to 25% in January averts increasing trade tensions but does not resolve the issue. It is hoped that progress can be made so that some normalization can resume, though investors are wary. Economic reports came in below forecast, with New Home Sales continuing to slump and the Fed’s preferred inflation gauge was below forecast at 0.1%, with the core y/y rate declining to 1.8%.
Open or Closed?
U.S. financial markets will be closed on Wednesday in respect for former President George H.W. Bush. After discussions with the underwriters and SBA, we anticipate that the bond market closure, in particular, will not adversely impact the offering of 504 debentures this month. The marketing will commence on Tuesday, and debenture interest rates will be set on Thursday, as scheduled.
The looming government shutdown, however, will be affected by President Bush’s funeral. The current continuing resolution to fully fund the government will expire after this Friday and President Trump has threatened to partially shut down the government. The president has used the threat of shutdown to try and get $5 billion in funding for his Mexico wall but to no avail, even with his party controlling both chambers of Congress. He has backed off the threat to not sign spending legislation, which would have partially shut down the government. In light of President Bush’s funeral, however, the president is open to an up to two week continuing resolution past the Friday deadline. This probably will be agreed to early this week. Be ready for fireworks when the Democrats take over the House in January, as that will give the president even more reason to threaten (or follow through with) a shutdown.
The Week Ahead
Financial markets will close Wednesday to honor President George H.W. Bush; more Fed speak, including Jay Powell speaking before the Joint Economic Committee in Congress; Freddie Mac is active in the Agency CMBS market; the SBA 504 program prices its December 20 and 25 year debentures; and Treasury auctions are limited to short-term Bills plus the jobs report.
Monday – Construction Spending expected to show a modest bounce; Treasury auctions $75 billion in thirteen and twenty six week Bills
Tuesday – four and eight week Bill auction size will be determined, and $26 billion fifty two week Bills will be sold
Wednesday – Institute of Supply management report expected to decline after three strong months and Jay Powell speaks before Congress; markets closed
Thursday – Factory Orders expected to decline 2%
Friday – Non Farm Payroll expected to show an increase of 190,000 and Consumer Sentiment forecast to hold steady
November 26, 2018
Oil Leak
In a holiday shortened week that saw continued pressure on stock prices, Treasuries remained in demand and oil continued its slide. Down 30% since the beginning of October, oil continued its drop as President Trump wields political influence on Saudi Arabia to keep prices low even though it would prefer to cut production. Increased US supplies and a global economic slowdown are also contributing to this price decline. This Financial Times chart shows the sharp drop for last week alone, putting it at its lowest price since October 2017.
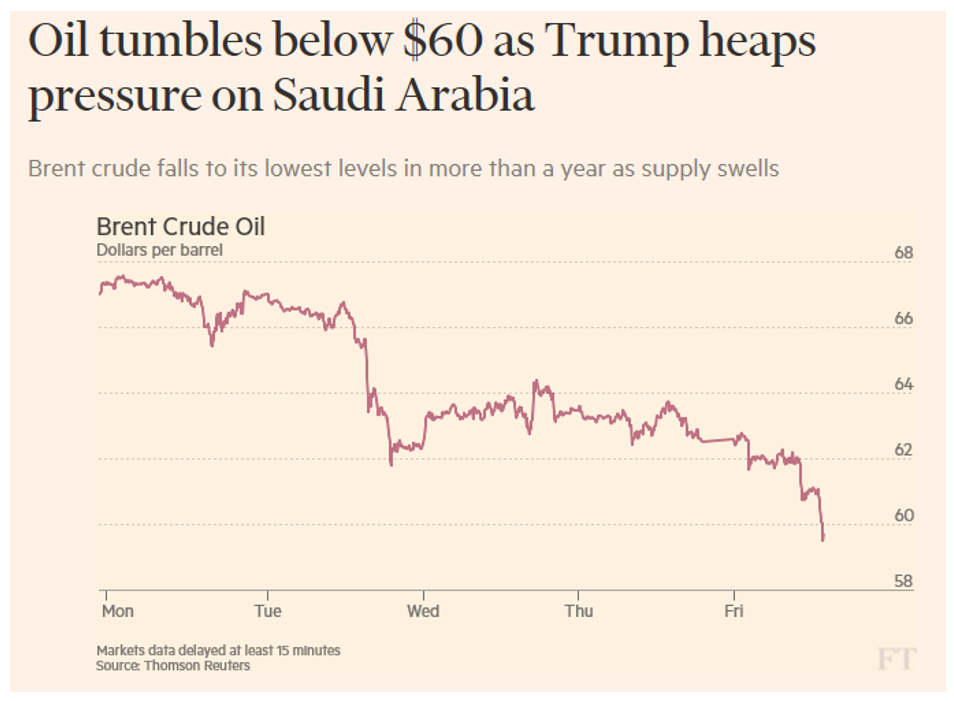
This WSJ chart shows the impact that trade tensions and weaker oil have had on equity markets over the last month, with the tech heavy NASDAQ suffering the most, down 4.3% last week alone.
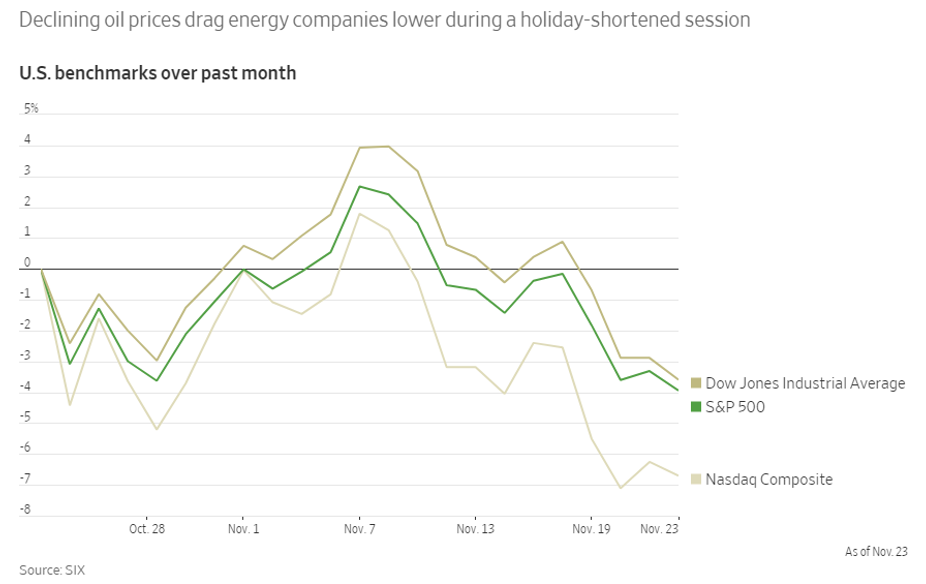
While equities and commodities have suffered, US Treasuries have been revisited by the standby safe haven trade, illustrated by the ten-year benchmark closing Friday at 3.04%, down from its intraday high of 3.24% in October, and lower by 14 bps since SBA 504 debentures were priced two weeks ago. Knowing there is a strong probability of rate hike next month, the back end of the Treasury curve has outperformed with the 2/10 spread declining from +29 bps to +23 bps over that time. This flight to quality was mentioned in a Financial Times article that identified the global financial system as being dollar centric and mentioning a “Fed pause trade” that could occur in 2019. Whether or not traders are getting a jump on that concept, such a move would benefit major asset classes that are now in negative territory for 2018.
Economic reports last week did nothing to support growth with Durable Goods being -4.4% and September revised down to -0.1% from +0.8%. Also, the Purchasing Managers index reported slowing growth in November.
Though passage in Parliament is not assured, the European Union and Britain have agreed in principle for the UK withdrawal from the Union. This is important not just for providing structure and guidance for the UK, but also for the EU to discourage additional defections.
The Week Ahead
There is Fed speak (most importantly Jay Powell speaking on Wednesday), Treasury to sell $204 billion in debt while the Agency MBS market picks up, and the Fed’s preferred inflation gauge on Thursday.
Monday – Treasury auctions $75 billion in 13 and 26 week Bills, and $39 billion two-year Notes
Tuesday – Treasury auctions $40 billion five-year Notes
Wednesday – Treasury auctions $18 billion two-year FRN’s and $32 billion seven-year Notes; second report of 3Q18 GDP expected to remain at 3.5%. Jay Powell speaks to the Economic Club of NY
Thursday – FOMC minutes of the November 8 meeting are released, Personal Income & Outlays report contains the core PCE gauge, expected to be 0.2% with the y/y rate possibly declining to 1.9%
Friday – G-20 Summit in Buenos Aires where President Trump is expected to meet with President Xi
November 19, 2018
Safe Haven Return
Stocks weakened in volatile trading as earnings and economic reports disappointed investors, sending them to Treasuries like the ten-year benchmark that improved almost 12 bps on the week. This was achieved even as it was reported that China, the largest holder of US Treasury debt at $1.13 trillion, has reduced its holdings for the fourth consecutive month. Theirs is not a one off event as all foreign investors in Treasury debt now hold 40% of outstanding balance, down from 50% just three years ago. During this period the Fed has raised interest rates eight times (200 bps), with the benchmark ten year Note rising just 80 bps as the rate curve flattened. This WSJ chart shows how the Treasury market strengthened into the weekend.
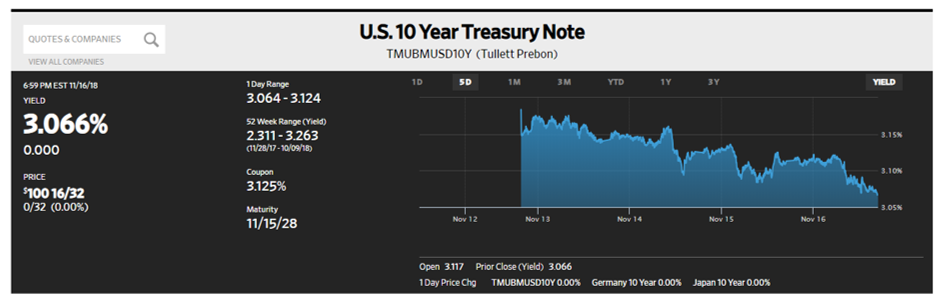
Headlines that gave equity and credit investors pause were:
- Domestic Industrial Production rose just 0.1%; perhaps weather related, but still disappointing
- High Yield Corporate index reached 7% yield for the first time since 2016 and the Investment Grade index hits 4.34%, its highest level since 2010. At the same time, recent issuance of DCPC debentures have outperformed comparable product
- US budget deficit jumps to $100 billion to start FY2019. This is a 60% increase y/y and is attributable to tax cuts and increased spending with an aging population
- German GDP shrunk 0.3%, for the first time in eight years
- Japan contracted 1.2% in the same period
- Eurozone economy grew just 0.7% in Q3
- Chinese credit growth grew at its slowest pace on record
US growth at 3.5% is not the only robust economy, but close to it as trade tensions are taking a toll on global economies, with Italy beseeching citizens to buy its debt as investors back away, and the UK coming closer to the possible catastrophe of a “no deal” Brexit. Rome is fighting with Brussels over its proposed spending plans and selling pressure has pushed its ten year debt higher by 167 bps this year while its German benchmark yield has risen just 4 bps. In London, Mrs. May has achieved cabinet approval for her proposed plan but Eurosceptics in Parliament are dissatisfied and threaten her governing coalition’s ability to achieve acceptance. On Friday, British bank stocks dropped more than 10% and other business sectors were hit hard, fearing no deal on Brexit and an uncertain future. Overall, the FTSE 100 index was down 1.7% on the week, close to the S&P 500 indexes decline of 1.6%.
The Week Ahead
Our second consecutive holiday shortened week has much Fed speak, more Treasury Bill auctions and a light calendar of economic reports.
Monday – Treasury auctions $78 billion in thirteen and twenty six week Bills, and announces size of Tuesday’s four and eight week Bill auctions
Tuesday – four and eight week Bill auctions
Wednesday – Durable Goods orders expected to be 0.8%, and Leading Indicators is forecast to be 0.5%. Treasury auctions $11 billion ten year TIPS (Treasury Inflation Protected Securities)
November 12, 2018
- Stocks chose black over red, S&P 500 index gaining 3% on the week
- Treasuries held firm as the market absorbed the quarterly refunding; actually declining 4 bps w/w
- Oil in bearish territory, WTI down 20% from its high
- The Fed leaves rates unchanged, stays the course for future hikes
- Mid-term elections as predicted – Democrats regain the House, Republicans hold the Senate = probable gridlock
- SBA 504 program prices $323,207,000 in ten, twenty, and twenty-five year debentures; a size that matches the program’s 12-month average
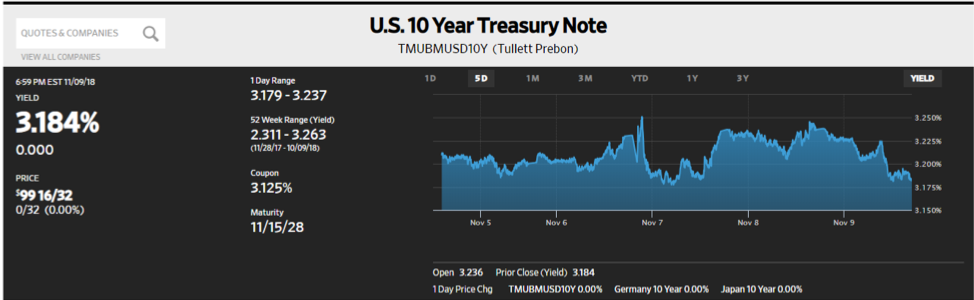
While stocks and oil continue to express concern over trade tariffs and economic strength, it is the election results that will set up clashes over a potential repeal of tax cuts, proposed infrastructure spending, and health care, a topic which voters identified to be a primary concern. All of these items require increased spending, meaning increased debt and that is of concern. The US pays $1.3 billion each day to service its public debt, benefitting somewhat from today’s relatively low interest rates. The annual cost, per the Congressional Budget Office, is expected to be nearly $1 trillion by 2028, assuming the long term average for rates like the ten-year Note are around 3.70%. Should rates be higher that cost will increase, and with Treasury continuing to focus on shortening its average maturity (currently six years) its need to refinance will be more frequent, incurring even greater expense at higher rates.
The Fed held short term interest rates steady, offering an upbeat assessment of the economy with no reference made to October’s price volatility. Comment was made about reduced business investment as corporate America continues to use tax cut related profits to repurchase stock. Such activity adds support to equity prices but does little to sustain economic growth. Gradual rate increases are still in the Committee’s plans, with the December meeting likely to produce the next change.
This Morgan Stanley chart that was posted in the WSJ shows the recent decline in business investment and is enhanced by regional Federal Reserve Bank surveys that project continued declines.
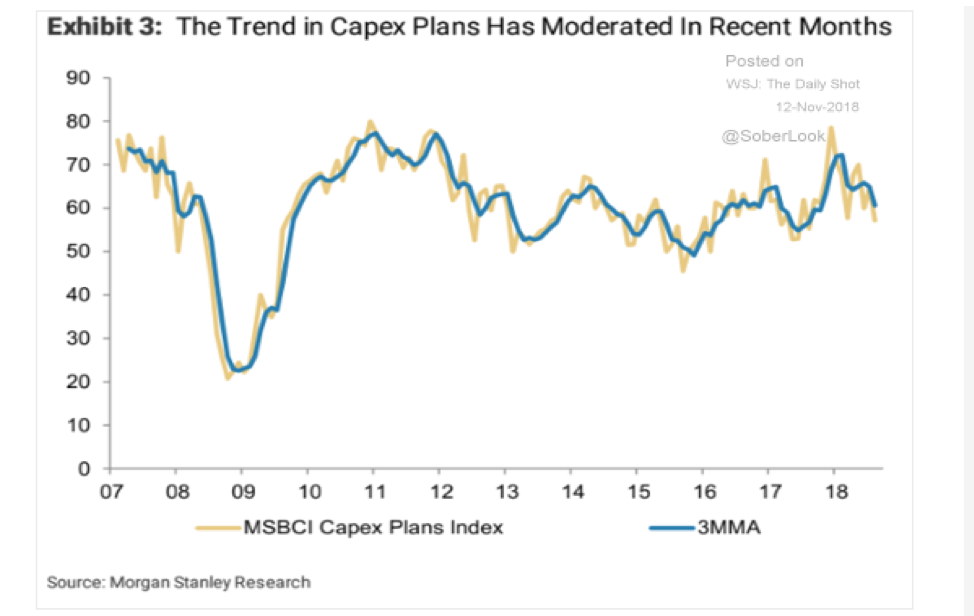
The one significant economic report was a much stronger than expected Producer Price Index gain of 0.6%, even 0.5% ex food & energy, and 2.6% y/y.
The Week Ahead
There is much Fed speak, Treasury to sell $164 billion, all in short-term Bills, and the SBA 504 program funds its November debenture sales.
Tuesday – Treasury to auction $50 billion 4-week Bills, $30 billion 8-week Bills, $45 billion 13-week Bills, and $39 billion 26-week Bills
Wednesday -The 504 program funds its sale of $323,207,000 November debentures
Thursday - Retail Sales expected to be 0.5%
Friday – Industrial Production forecast to be 0.2%
November 5, 2018
Red or Black?
Those are colors that are usually identified with roulette, but also identify how domestic stock markets flirted with being in the red this year, before rallying midweek to reflect marginal ytd gains. After a tumultuous October, the S&P 500 index showed a 2.4% gain for the week, but negative 7% for the month. US Treasury yields might be expected to prosper from such a performance but Friday’s jobs report, and its healthy average hourly earnings increase, lend support to the Fed’s commitment to gradually raise rates and almost assures another 25 bps increase in December. That report of +250,000 was well above consensus and the 0.2% wage increase brought that category to +3.1% y/y, the highest rate since 2009 as seen in this Financial Times chart, and well above the Fed’s Personal Consumption Expenditures inflation rate of 2%.
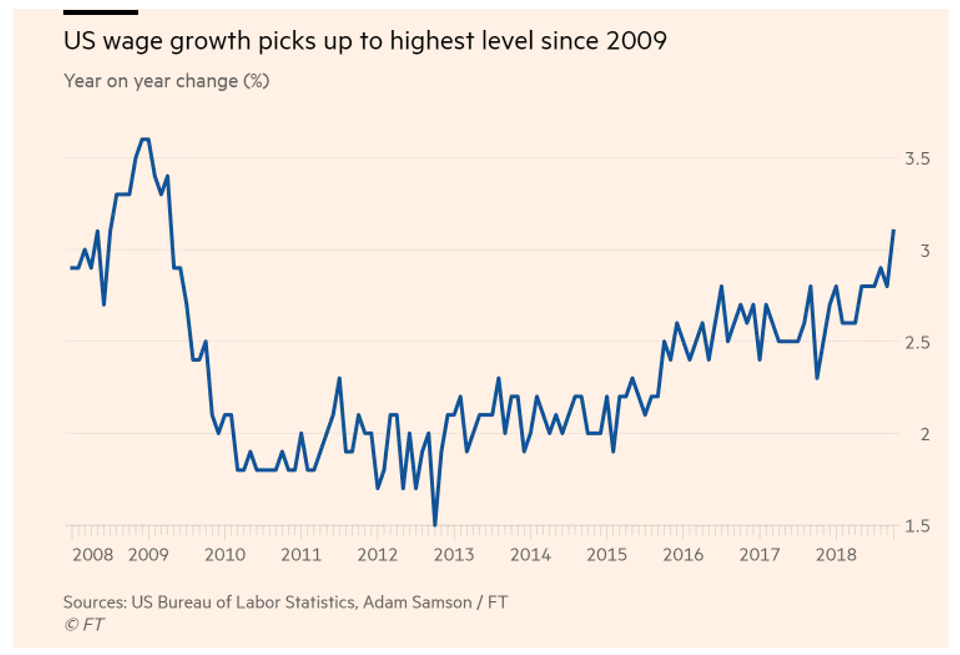
Health care, manufacturing and construction were the strongest categories of jobs growth, with the unemployment rate holding at 3.7%, and the labor force participation rate increasing to 62.9%, perhaps lending credence to the belief that more discouraged workers are actively seeking jobs. Another report that supported rising costs was the Employment Cost Index that gained 0.8% last quarter, its fastest pace in a decade.
Other reports of interest were the previously mentioned PCE figure of 2.0%, reflecting a monthly increase of 0.2%, and a weak reading from Institute of Supply Management, reflecting slow growth as a result of recently imposed tariffs amidst conflicting reports of a thaw in US-China trade war rhetoric.
These tariffs, coupled with Treasury’s recently announced plans to increase the size of its funding schedule, concern about highly leveraged Corporate debt, and the Fed’s reduction of balance sheet are all negatively impacting capital markets, raising rates and pushing funding spreads wider. Here is the WSJ chart reflecting the weekly move in the benchmark ten-year Treasury note.
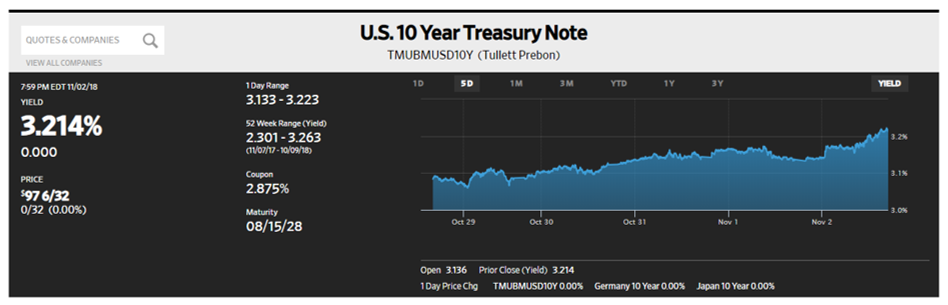
Janet Yellen, no longer restricted by the blackout period in advance of FOMC meetings, spoke last week about her concern regarding a “huge deterioration” of lending standards on corporate debt. Over the last thirty years this lending has shifted from banks to the bond market, where one half of Investment Grade debt is now rated BBB, the lowest level before junk and if downgrades took place it could force holders of that debt to sell because of rating limits. Such additional supply would not be a welcome addition in a defensive, rising rate environment.
The Week Ahead
Ordinarily, the FOMC meeting and its policy announcement, which is expected to signal no change, would be the foremost event but Tuesday’s midterm elections will garner the most attention. Treasury will sell $193 billion in debt, the Agency CMBS market will be active, including the SBA 504 program pricing its November debentures on Thursday. Economic report activity is light.
Monday – Treasury auctions $84 billion in 13 and 26 week Bills, and $37 billion in three year Notes
Tuesday – Treasury auctions $26 billion in 52 week Bills and $27 billion ten-year Notes
Wednesday – FOMC meeting begins and Treasury auctions $19 billion thirty year Bonds
Thursday – SBA 504 program prices ten, twenty, and twenty-five year DCPC’s; FOMC announcement is scheduled for 2:00 PM Eastern
Friday – Producer Price Index expected to be 0.2%
October 29, 2018
Market Movers: The October Bear Is Everywhere
October has earned its reputation as a difficult month for the financial markets as this year the bear continues to roll through global fixed income and equity markets. It seems troubled most everywhere at the moment, not just in markets but in politics and society. The backdrop for this is the major central banks’ withdrawing of liquidity from the global system. Coordinated easing from the major central banks over a number of years covered up any number of potential problems in the markets. It was a record large injection and maintenance of global liquidity that has run its course.
Historically, withdrawal of liquidity has meant problems for emerging markets as the supply of dollars tightened up, and indeed this has been the case in 2018. But investor concerns have steadily moved up the investment food chain as the world became a more uncertain and less friendly place. Investing in the post-war era has been an increasingly global exercise no matter where you live. When the global outlook dims investment returns broadly take a hit. Late economic-cycle fiscal stimulus allowed the U.S. to delay participating in the global market correction this year, but that reprieve seems over.
Since surfing the liquidity wave is out as a sport, investors now must look even more to the fundamentals. In the U.S. fundamentals are less bullish but not bearish, but the post-crisis expansion has gone on long enough that macro-economic speculation now centers on how soon it will be to the next recession. The Goldman Sachs Financial Stress index is back to March 2017 highs. Europe has not even had much of an expansion and is already facing head winds. China lately appears to be unable to fight its way out of a paper bag thanks to internal imbalances and the tariff war. And Great Britain, well, we know what’s happening there.
Fixed income, typically the place where investors hide when worried, is not really safe during Fed hike cycles and posts a negative return (U.S. Aggregate index -1.7% ytd). This was followed last week by the tech-heavy S&P 500 which is now down 0.7% on the year. Junk bonds (per iShares HY) are hanging onto a small and diminishing positive return. Not only disappointing earnings from tech companies, but earnings warnings from core industrial companies such as Caterpillar last week reminded investors that the U.S. market is not immune from a bear attack.
But it has been worse offshore, the Global Dow is down 7.9% in dollar terms. The yen has beaten the dollar in the recent haven trade (yup, Japan is considered a safe haven in the post-GFC world), but the dollar index is up 5% this year. Correlations between global financial markets are broadly and highly positive, meaning that they have been more likely to trend in the same direction, which of late has tended to be down.
Last week, Treasuries did benefit from the fear trade. The chart below shows the benchmark ten-year T-note yield fell steadily during the broad risk-off trade, from 3.20% to 3.08%. Market-implied odds of a Fed rate hike in December fell from 4 in 5 to 2 in 3.
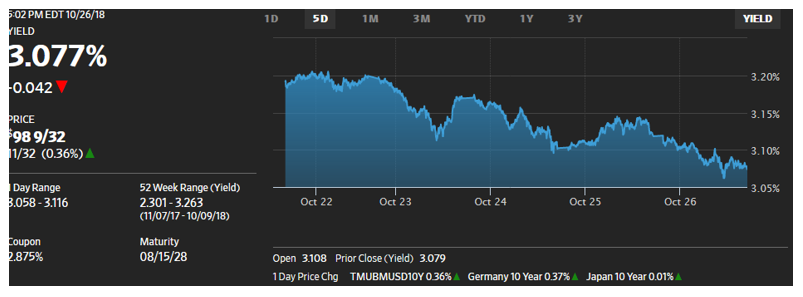
Closer to home, in the agency CMBS market heavy new issue supply, and an overall widening of credit spreads, pushed spreads in that sector out 7-9 bps, including for SBA 504 debenture pools.
Economic reports were mixed:
- New Home sales were much weaker than expected
- Durable Goods were stronger than expected
- Q3 advance GDP was near expectations
The Week Ahead
Looking ahead, there appear to be no deep and potentially destabilizing new problems set to surface soon in the financial markets. Declines in the markets, while broad, have been orderly and fairly predictable based on less rosy fundamentals, uncertainty about economic policies and politics in China, Europe, and the U.S., and deteriorating technicals. Bearish sentiment is getting high enough that some stabilization and retrenchment would not be surprising in the risk markets. A Goldilocks-like U.S. Employment Report would be a good step.
Monday – Personal Income and Consumption
Tuesday – Consumer Confidence, Case/Shiller Indices
Wednesday – ADP employment data, ISM indices
Thursday – Jobless Claims
Friday – Employment Report for October
Of course true major financial crises typically come from areas that are overlooked by market analysts. As Rumsfeld would’ve said, they are the “unknown knowns.”
October 22, 2018
Market Movers
In the US it was the release of the minutes of the July 26 meeting which confirmed the vote to raise rates an eighth time was unanimous, leaving the markets with a sense the Committee is becoming more hawkish about the strong economy. The benchmark Treasury closed just 4 bps higher on the week but the move to higher rates was enhanced by comments from Fed officials like Randal Quarles, who said economic reports suggest “the economy will stay strong for a significant period into the future.” The vote from the last meeting, coupled with hawkish comments, reaffirm the Fed’s intent to maintain its gradual path of rate hikes, as advertised. Equities reversed a three week decline, eking out a small gain.
This WSJ chart shows how the benchmark ten-year Note yield increased after the FOMC minutes, only to decline somewhat heading into the weekend.
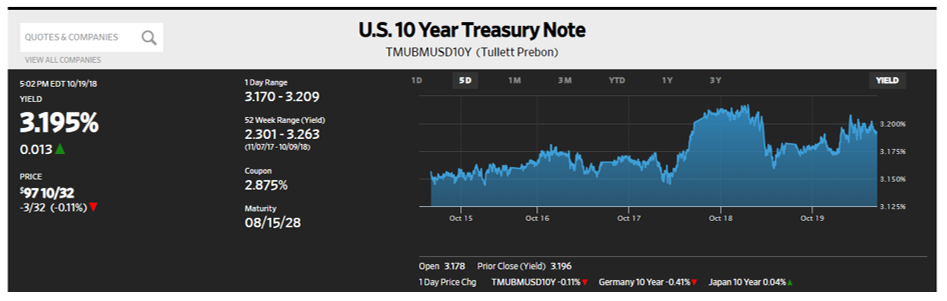
Globally, aside from concerns about the involvement of Saudi Arabia in the death of Jamal Khashoggi, it is Italy and China that are center stage. Italy is pursuing a progressive track that will require financing at a time its funding spread is +312 bps to the benchmark German Bund. That spread was +100 bps three years ago and this increased cost of funding could spread to other EU members like Spain and Portugal. For China, it is not debt but weakness in its currency and equity markets that was reinforced by a decline in its 3Q2018 growth. Hard to imagine a rate of 6.5% is considered weak, but that is testament to the global impact of its economy. Its currency weakness has prompted criticism of government policy, but Treasury has not charged them with manipulation and China is challenged by what sector it can support – currency or equities, which are down 29% year-to-date.
Economic reports were mostly weak:
- Retail Sales at 0.1% was far below the 0.6% consensus
- Industrial Production was slightly better than forecast at 0.3%
- Existing Home Sales fell 3.4%, below forecast for the sixth straight month as the housing market reels from rising mortgage rates, lack of inventory, high home prices, and a new tax law that reduces the incentive for ownership
The Week Ahead
A lot of Fed speak, Treasury to sell $211 billion of debt, an active Agency CMBS market, and some more economic reports.
Monday – Treasury auctions $84 billion 13 and 26 week Bills
Tuesday – Treasury sells $38 billion two-year Notes
Wednesday – Treasury sells $19 billion two-year Floating Rate Notes and $39 billion five-year Notes; New Home Sales expected to hold steady, with price discounting offsetting higher mortgage rates
Thursday – Treasury sells $31 billion seven year Notes; Durable Goods expected to decline 1.4% after a 4.4% increase in August
Friday – first estimate of 3Q2018 GDP expected to be 3.3% vs. 4.2% in 2Q2018
October 15, 2018
Higher rates roil stocks
The previous week’s increase in rates reversed itself, only after sending US stock markets down 4.1% for the week, and that is after a Friday rally of 1.4%. This Financial Times chart shows the sectors that were hardest hit by ongoing concerns about rates, oil prices being up 30% ytd, and trade tensions, especially with China.
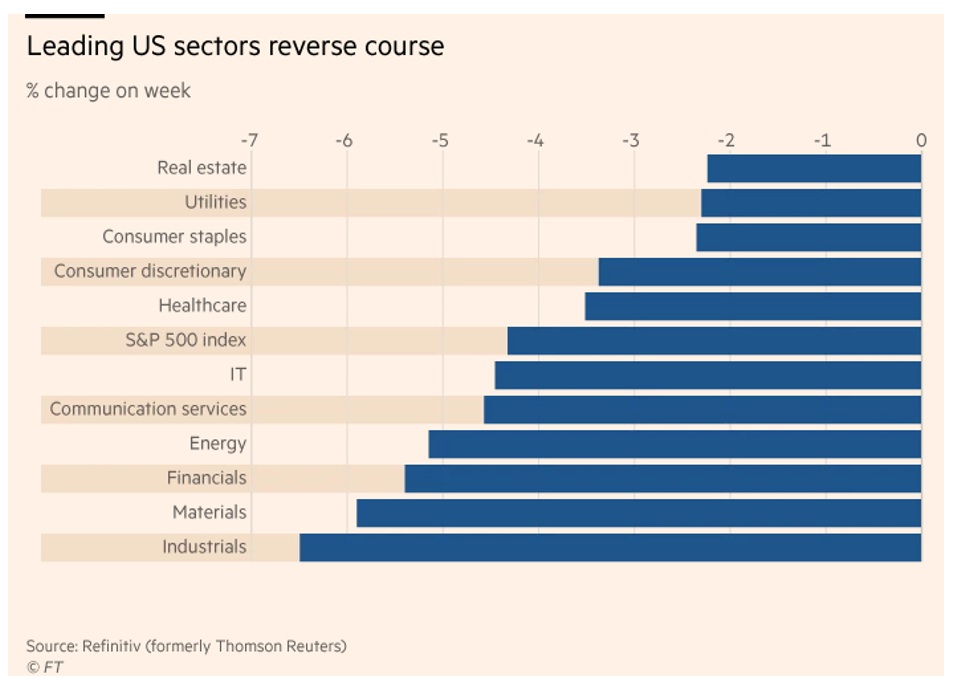
Some other items:
- President Trump stated “I think the Fed is out of control. What they’re doing is wrong.” He believes its rate increases are damaging stock valuations even though corporate earnings reports are strong, at least for now.
- Adding to rate concerns, the Fed is shrinking its balance sheet and the ECB is expected to end its QE program at year-end.
- The International Monetary Fund reduced its forecast for 2019 global growth to 3.7% from 3.9%.
- Germany reduced its GDP forecast to 1.8% from the previously reported 2.3% rate, citing “smoldering trade conflicts worldwide”.
- Italian ten-year yields have risen 70 bps (3.67%) in the two weeks since the coalition government proposed its progressive budget that is at odds with European Union guidelines. YTD the yield is +157 bps reflecting investor concern about the country’s credit and its ability to fund proposed initiatives.
- The safe-haven rally in Treasuries was relatively modest as stock prices tumbled. Ordinarily, such a rout in equities would produce a more significant move to lower yields, but that trade is being tempered by expectation of higher rates and trade tensions.
- That 7 bps weekly decline in the ten year UST rate did assist the SBA 504 program to price its October debentures at 3.77% and 3.89%, for its 20 and 25 year issues respectively.
In 4Q2017 the yield on the two-year Treasury broke above the dividend yield on the S&P 500 index. At 2.86% it now stands 100 bps above it, and though not mentioned by the President in his critique of Fed policy, it does provide an attractive risk free alternative to stocks, especially in this volatile period and with its yield expected to rise.
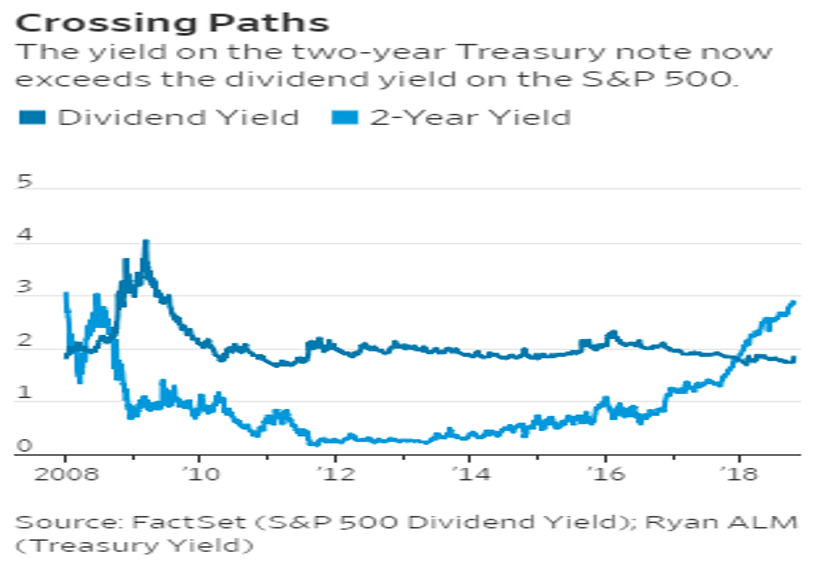
In addition to the successful DCPC sales, last week’s supply of debt saw good demand with as much as 65% of Treasury’s 10 and 30 year issues going to indirect/foreign bidders. The CPI and PPI reports were weaker than expected with PPI 2.5% y/y ex food & energy, and CPI at 2.2% y/y ex food & energy.
The Week Ahead
Fed speak continues, Treasury sells $89 billion of debt, and we get the FOMC minutes from the 9/26 meeting.
Monday – Treasury auctions $84 billion thirteen and twenty six week Bills. Retail Sales expected to be 0.2%
Tuesday – Industrial Production forecast to be 0.2%. European Union expected to post update on Brexit negotiations
Wednesday – Release of the FOMC minutes from the 9/26 meeting that raised rates an eighth time
Thursday – Treasury auctions $5 billion of 30 year TIPS (Treasury Inflation Protected Securities)
October 9, 2018
Breakout
As the Financial Times reported, “the quiet, low intensity 2018 bond selloff exited stealth mode this week.” The rates market had been complacent about the tighter Fed policy and was fairly benign until Wednesday’s Institute of Supply Management report registered its strongest reading since the index was created in 2008. The selloff was enhanced by comments from Fed Chairman Powell who said the US economy is in an “extraordinary period” and the Committee is “a long way” from raising rates to neutral (meaning more rate hikes).
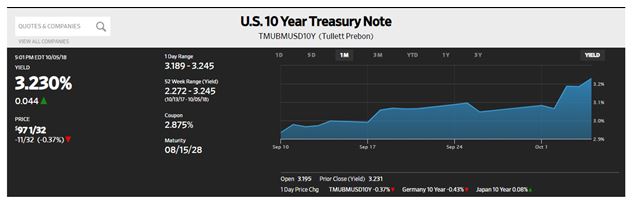
The benchmark ten-year Treasury ended the week 17 bps higher, and 34 bps higher than when the 504 program priced 2018 20I in September, as seen in this one month WSJ chart. It seemed as if people suddenly realized:
- Oil is at a four year high, cracking $80 a barrel
- Coupled with higher interest rates, that expense is a negative for corporate profit, sending stocks lower and propelling the tech heavy NASDAQ to a 3% weekly decline
- Long dated US Treasuries are at their highest level in seven years, with four more rate hikes projected
- The flattening trend of the 2/10 Treasury curve has reversed by 10 bps this month
- The Real Yield on the ten year Treasury (yield minus inflation) broke 1% for the first time since 2011
Even Friday’s weaker than expected jobs report, with the 3.7% Unemployment Rate at its lowest level since 1969, failed to inspire confidence. The report of 134,000 was below consensus, partly attributed to Hurricane Florence, but had upward revisions to July and August of 87,000 and represents a record 96th straight month of gains. The usually consistent leisure and hospitality category was identified as being 37,000 below average and that also helped keep it below its forecast.
The Week Ahead
Fed speak, $230 billion of Treasury supply, $1 billion of Agency CMBS, plus the SBA 504 program sells 20 and 25 year debentures on Thursday. Economic reports focus on inflation data that the Fed does not prioritize.
Monday – Columbus Day holiday
Tuesday – Treasury auctions $156 billion in 4, 13, 26 and 52 week T Bills
Wednesday – PPI, ex food & energy, expected to be 0.2%, 2.9% y/y; Treasury sells $36 billion three year Notes and $23 billion ten year Notes
Thursday – CPI, ex food & energy, expected to be 0.2%, 2.3% y/y; the 504 program sells 20 and 25 year debentures; Treasury sells $15 billion 30 year Bonds
October 1, 2018
As forecast, another 25 bps rate increase
There was no surprise that the FOMC raised short-term rates on Wednesday to a band of 2.0%-2.25%, its eighth increase since December 2015. In a release of the Committee’s policy statement their forecast calls for an additional rate increase this year, and three more in 2019. Below is a WSJ chart that identifies the changes in their median estimates that support their pursuit of gradual change. As real GDP is expected to decline, unemployment will remain low in a benign inflationary environment. Friday’s core PCE report of 0.0%, 2.0% y/y was as forecast with little expectation of rising.

The move had minimal impact on the rates market as Treasuries were unchanged on the week, more confirmation of the Fed’s success in communicating their policyplans. Other reports reflected positively on the economy:
- Consumer confidence is at an 18 year high
- Durable Goods orders were double the consensus at 4.5%, with an upward revision of 0.5% to July
- 2Q18 GDP’s third revision held firm at 4.2%. By comparison, the European Union reported a slight decline to 1.5% for 2Q18 growth
- Looking ahead, even a downward revision by FRB Atlanta for 3Q18 GDP shows a 3.8% rate
In other central bank news, the ECB reported that inflation in countries using the Euro has risen to 2.1% and that it does plan on ending its accommodative band buying this Fall. Within this European Union, concern about Italy is increasing as concerns about Greece abate. Italy, whose ten-year debt trades just 0.01% above US Treasuries, just passed a budget that will sustain its debt load at 130% of GDP, a level more than double what the ECB mandates. Its populist coalition government unexpectedly passed a budget which will increase spending and reduce taxes, though it will require final approval by the European Commission.
The Week Ahead
Fed speak resumes with a light economic calendar, save for the September jobs report. Treasury supply is light, but the Agency CMBS calendar is active.
Monday – Treasury auctions $98 billion in 13 and 26 week Bills
Wednesday – Institute of Supply Management report is expected to hold steady, a reflection of an expanding economy
Friday – Non Farm Payroll is forecast to be 180,000 with unemployment at 3.9% and earnings growth at 0.3%, 2.9% y/y
September 24, 2018
No Worry about Tariffs, Yet
Stock markets continue to surge, as this WSJ chart shows the DJIA closing Friday at its all time high of January 2018. Amid skepticism about the market’s ability to withstand pressure of increased trade tariffs, the exclusion of Canada from a renegotiated NAFTA agreement, and the UK’s uncertain Brexit, the equity market continuing its resilient performance is confusing analysts. There are some traditional concepts that are being challenged:
- Stocks should decline when bond yields increase, making fixed rate investments more attractive.
- Higher bond yields (especially compared to other sovereign names) should attract more foreign buyers, strengthening US$, but the currency has weakened recently. Of course, an offset to that is a weaker US$ makes exports more attractive to foreign buyers, a boon to the economy which helps corporate performance.
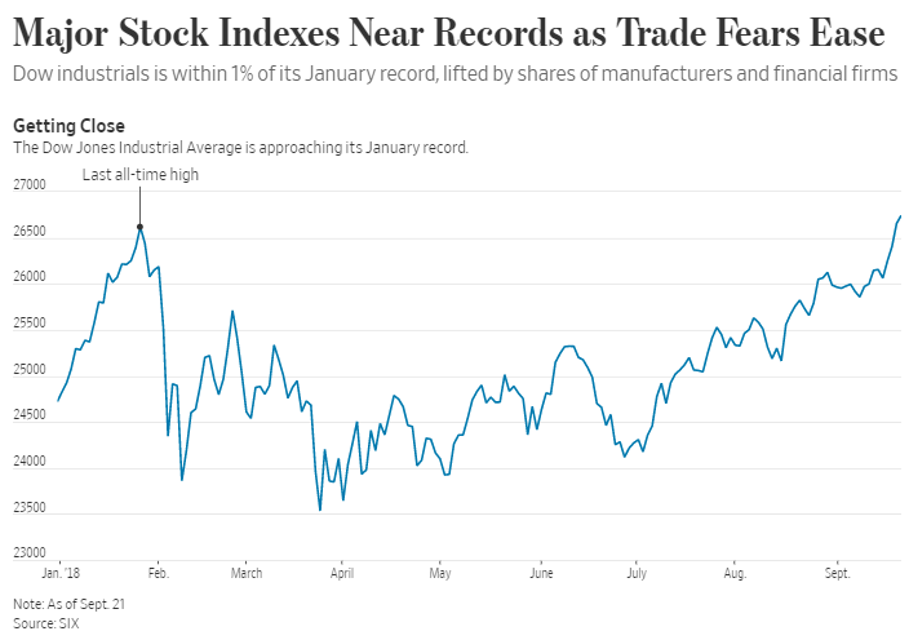
What may be most impressive is how investors are accepting of higher interest rates as the Fed is poised to raise its short-term target for overnight funds to the 2.0-2.25% range on Wednesday. Dating to December 2015, when the range was 0-0.25%, this WSJ chart shows how the two-year Treasury note, which is most sensitive to Fed policy, has matched the 175 bps increase in the Funds rate. The benchmark ten year Treasury note closed Friday’s session at 3.06%, up 7 bps on the week and just 77 bps since December 2015, a move that has benefitted small business borrowers who are active in the 504 loan program.
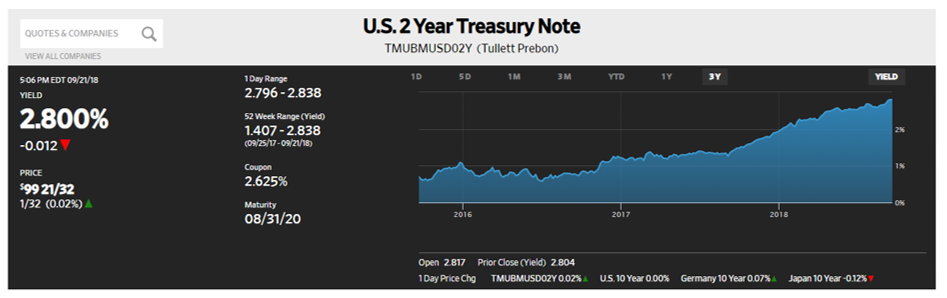
With no Fed speak, and minor economic reports last week, the rates market absorbed heavy issuance in the Corporate and ACMBS market as Treasury rates trended higher ahead of the Fed meeting and an active calendar this week.
The Week Ahead
Focus will be on Wednesday’s FOMC announcement, plus Treasury auctions totaling $213 billion, and some major economic releases that include the Fed’s favored inflation gauge, PCE, on Friday.
Monday – Treasury auctions $98 billion 13 and 26 week Bills and $37 billion three year Notes
Tuesday – Treasury auctions $17 billion two year Floating Rate Notes and $38 billion five year Notes
Wednesday – FOMC announcement, followed by Fed Chairman press conference and forecasts
Thursday – Treasury auctions $31 billion seven year Notes; Durable Goods report expected to rebound from July’s -1.7% report with a 2% gain; third revision of 2Q18 GDP expected to be 4.3%
Friday – Personal Income & Outlays forecast to show Income as 0.4% with the core Personal Consumption Expenditure report expected to be 0.1%, 2.0% y/y
September 17, 2018
The Week in Review
Benchmark Treasury rates approached 3% in advance of the expected rate increase on July 26, and a stronger than expected Industrial Production report on Friday. The 0.4% gain was as forecast, but the July report was revised up .03% to a similar 0.4% gain. Adding to economic confidence was a revision to 0.9% for July’s Retail Sales release.
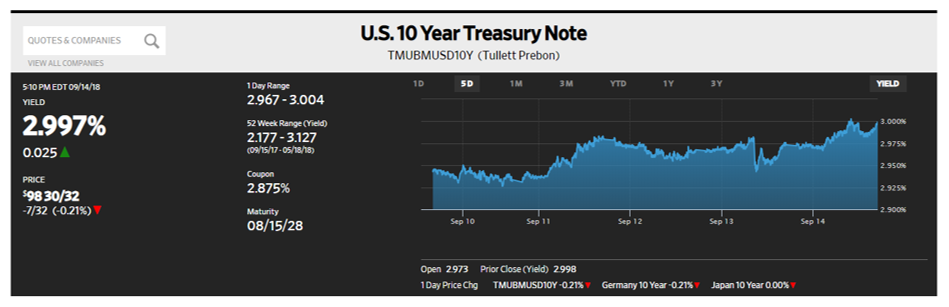
Other reports that focused on inflation were muted, with headline PPI coming in at -0.1%, and core CPI being just 0.1%, 2.2% y/y. Other items of interest were:
- A Financial Times article titled, “Market reckoning is coming after a decade of QE.” Its premise was that years of low rates have driven investors into riskier assets, and that low yields have enhanced the value of companies’ future cash flow, especially tech companies, thereby inflating their share prices.
- Turkey’s central bank defied its president by raising its official short-term rate to 24%, hoping to promote price stability. YTD, its Lira has lost 40% of its value, indicative of emerging market turmoil, and partly attributable to recent trade tariffs and sanctions.
An interesting take on median income is that it is at an all-time high of $61,372, sort of. The Census Bureau cautioned, as reported in a NY Times article, that a technical adjustment made in 2013 data meant the 2017 numbers are statistically the same as median household income from 1997 and 2007.
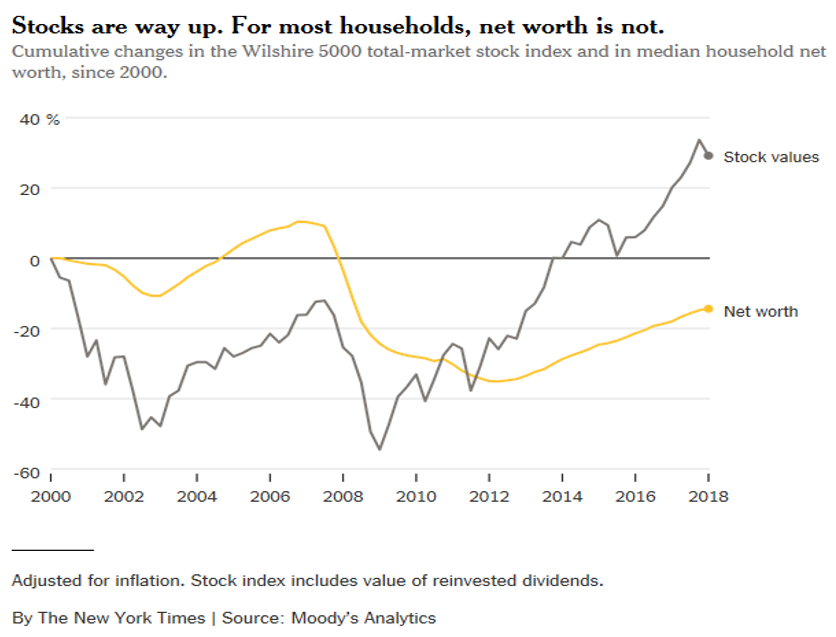
The stock market has fully recovered from its financial crisis level, worth about 60% more than its 2007 valuation. Unfortunately, those assets are held by wealthier households with median households, who are more dependent on their home values, showing a 20% decline. The article identifies this as a “lost decade” for the American middle class.
The Week Ahead
No Fed speak as we enter the blackout leading up to the July 25-26 meeting, light Treasury issuance, and some housing data will leave markets subject to headline news.
Monday – Treasury auctions $90 billion 13 and 26 week Bills
Thursday – Treasury auctions $11 billion ten year Treasury Inflation Protected Securities
September 10, 2018
The Week in Review
There was talk of increased tariffs on Chinese goods, no progress on NAFTA talks with Canada, a strong employment report that reflected solid wage growth, and the SBA 504 loan program had successful sales totaling $351,675,000.
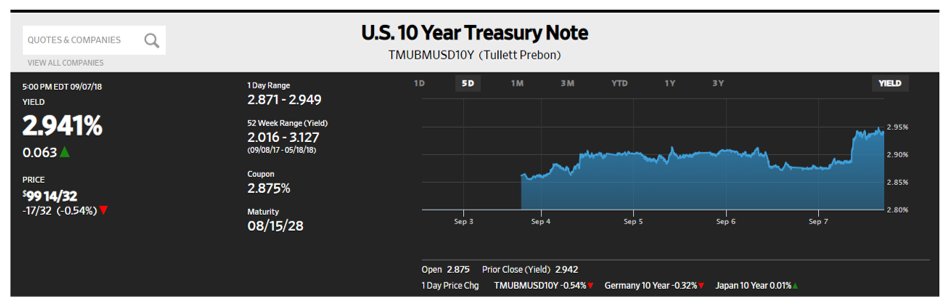
The tech heavy NASDAQ market suffered the most from the tariff talk, dropping 2.6% on the week as it would be more affected by China supply issues. The above WSJ chart shows how the benchmark ten-year Treasury weakened on Friday after the jobs report showed:
- 201,000 new jobs in August
- An unchanged unemployment rate of 3.9%
- Private sector wage growth of 2.9% y/y, the best growth rate in 9 years
- Another indication of labor market health is that initial jobless claims are at their lowest level since 1969
It was the wage growth component that best supports the Fed’s objective of gradual rate increases as increased wages in a tight labor market are believed to be a precursor to inflation, pushing yields higher on the week. With that in mind, the market assigns a 99% probability of a 25 bps rate increase on September 26, and a 74% probability of another hike after the December 19 meeting.
The September debenture sales for the 504 program included its third, and largest 25 year debenture ($58,273,000), priced at a rate of 3.65% and an ongoing Effective Rate to small business borrowers of 5.29%, just 29 bps above Prime Rate. Below is the historical chart for the 20 year debenture series, whose 3.53% debenture rate represented an ongoing Effective Rate of 5.25%.
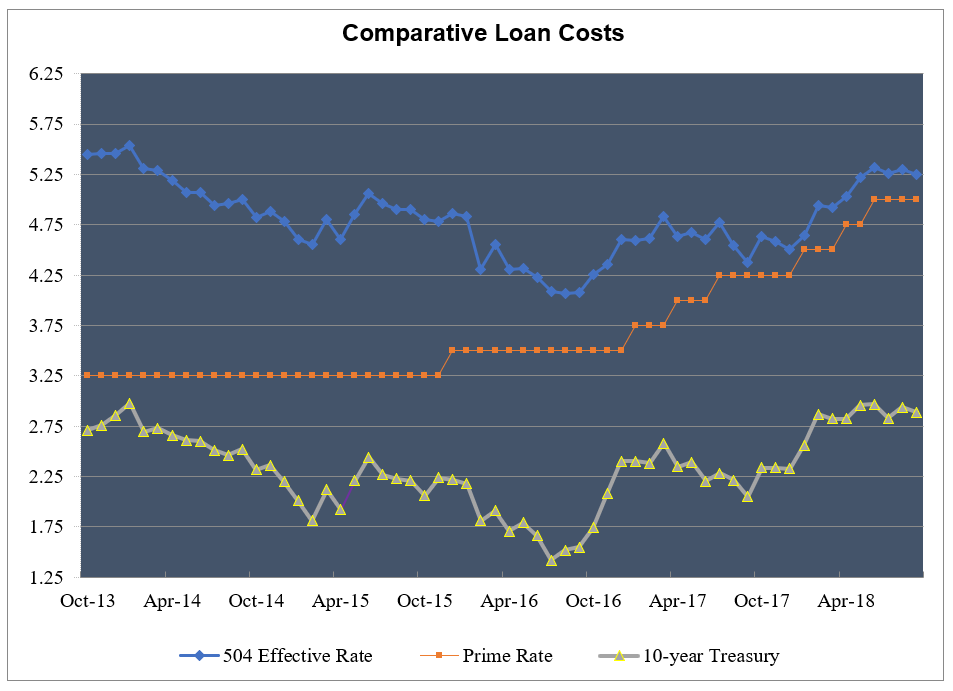
The Week Ahead
There is light Fed speak, some inflation data, $189 billion in Treasury issuance, and an expected increase in Corporate debt issuance.
Monday – Treasury auctions $90 billion in 13 and 26 week Bills
Tuesday – Treasury sells $26 billion of 52 week Bills and $35 billion three-year Notes
Wednesday – Treasury sells $23 billion ten year Notes; Core PPI expected to be 0.2%, 2.8% y/y
Thursday – Treasury sells $15 billion thirty year Bonds; Core CPI expected to be 0.2%, 2.3% y/y
September 4, 2018
Target Hit
A quiet week that saw the US and Mexico modify its existing NAFTA agreement, 2Q18 GDP estimate increase to 4.1%, and the market absorb $217 billion of Treasury debt, the FOMC’s target of 2% core inflation in Personal Consumption Expenditures was also achieved. In fact, due to revisions, the target was hit earlier this year.
As seen in this WSJ chart, core inflation has remained below this level for six-years even with declining unemployment in a lengthy economic expansion. Subdued wage growth has been identified as one reason for this, and increased consumer spending and confidence is not expected to move this indicator much higher.
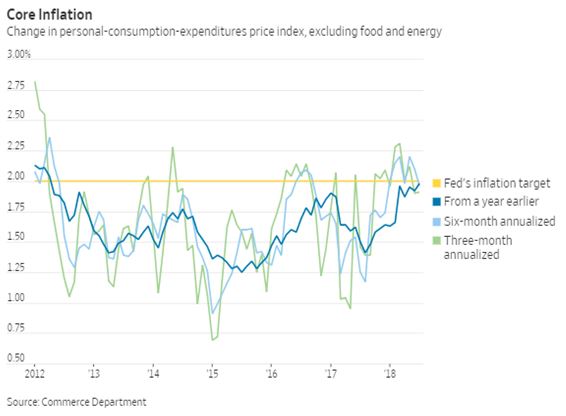
What it does do is affirm the Fed’s intent to continue gradually increasing short-term rates, perhaps as often as twice more this year, with one move expected later this month.
In addition to the partial NAFTA revision, the European Union announced its willingness to eliminate all car tariffs, if done reciprocally. Along with President Trump’s additional tariffs on Chinese goods the impact of this week’s headlines was:
- Continued weakness in Emerging Market currencies
- A stronger US$
- Equity market fatigue after recent record closes
- Benchmark ten-year Treasury is slightly higher at 2.85%, but lower by 9 bps on the month
The Week Ahead
Fed speak resumes with just $145 in Treasury Bills to be issued, the SBA 504 program prices its September debenture sales, and Friday is August’s jobs report.
Tuesday – Treasury sells 4 week, 13 week and 26 week T Bills
Thursday – SBA 504 program prices its ten, twenty, and twenty-five year debentures
Friday – consensus for Non-Farm Payroll is 198,000 with the unemployment rate expected to decline to 3.8%, and y/y wage growth forecast to be 2.7%
August 27, 2018
Flatter Still
Fed data dominated a week that saw minimal movement in benchmark Treasury rates, but a continued flattening in the spread between two-year and ten-year Treasury maturities. Monetary policy has seen seven rate increases since December 2015 (175 bps) with the benchmark ten-year Treasury rate rising from 2.29% to just 2.82% on Friday. This YCharts.com display shows how the spread was +260 bps on January 3, 2014, eleven months before the Fed began tightening policy with a series of seven, 25 bps rate hikes.
Even the most recent increase on June 13 affected short-term rates only; the ten-year Note rate is lower by 15 bps since then. This march to a possibly inverted yield curve is viewed by analysts as a precursor to a recession which would compel the Fed to resume an easier monetary policy. Such is the balancing act that awaits Fed Chairman Powell.
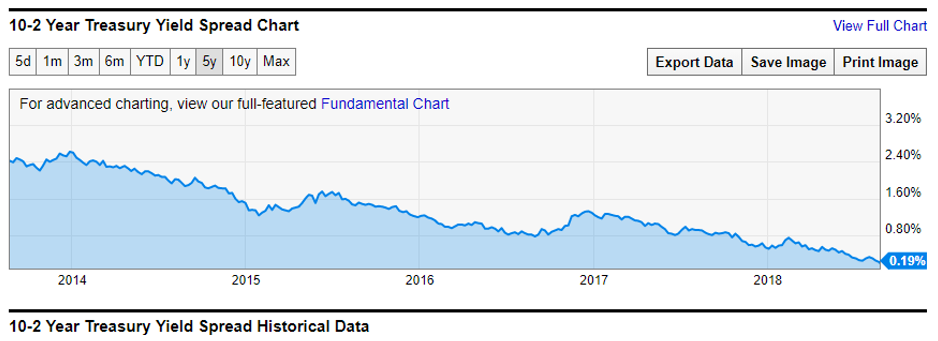
Release of the minutes from the Federal Open Market Committee’s August 1 meeting pretty much affirmed their intent to raise rates again on September 26; a 92% probability according to a financial market gauge. Points of interest in the release are:
- If data continued to support the current economic outlook “it would likely soon be appropriate to take another step in removing policy accommodation”
- Sustaining expansion of economic activity in a strong labor market with inflation at/near the Committee’s 2% target is their objective
- The word “strong” was used 32 times in reference to the economy
- The Committee is not sure how to assess the impact of trade protectionism on tariffs
Additional Fed commentary was provided by Chairman Powell on Friday when he identified “risk factors abroad and at home,” alluding to the recent turmoil in emerging markets. Those comments were followed by an economics research piece from the Fed warning about the potential effects of very low unemployment on inflation. Since we are at full employment, coupled with moderate inflation, it is of some concern that wage growth is static, but the Committee is not going to wait for inflation to rise before continuing its gradual tightening policy.
Economic reports showed housing data was weak, with existing home sales declining for the fourth consecutive month, and Durable Goods orders were lower than consensus.
The Week Ahead
There is $217 billion of Treasury issuance, little Fed speak scheduled, and the Fed’s favorite inflation indicator is released Thursday.
Monday - $96 billion in 13 and 26-week T Bills, plus $36 billion two-year Notes
Tuesday - $37 billion five-year Notes
Wednesday - $17 billion two-year Floating Rate Notes and $31 billion seven-year Notes; plus, the second estimate for 2Q18 GDP, expected to be lower at 4.0%
Thursday – Personal Income & Outlays forecast to be 0.4% for Personal Income, and the core Personal Consumption Expenditure is expected to be 0.2%, 2.0% y/y
August 20, 2018
The Good, the Bad, and the Ugly
Good
The SBA 504 loan program priced its second 25-year debenture at a rate of 3.71%, representing a 5.35% ongoing effective rate for small business borrowers. This debenture was part of a $373,572,000 sale consisting of:
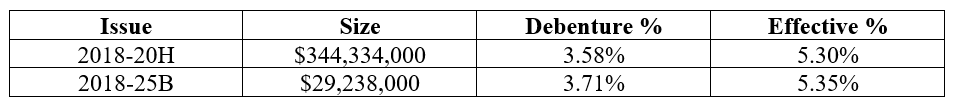
Walmart reported its strongest sales growth in a decade, sending its share price up 10% even though the company reported a $4.5 billion loss due to its sale of Walmart Brazil.
Treasury rates remain stable, still maintaining a safe-haven identity amidst trade tensions and sanctions.
Retail Sales came in at 0.5% but with June revised down by 0.3%.
Bad
Tencent, the Chinese internet giant, reported its first profit decline in a decade due to increased Chinese government involvement in the company’s video game business, which saw a 19% drop in income.
The benchmark CSI 300 index is down 15% since the tariff tirade, reflecting investor nervousness about the longer-term impact of a trade war.
Housing starts came in at 0.9%, but significantly weaker than its 8.3% forecast, due in part to the raging fires in California.
Ugly
An indication that not all is well in the retail space, JC Penney lost one-quarter of its stock market value, admitting it has had to discount merchandise to compete.
The recent collapse of Turkey’s lira recovered somewhat, but the currency surrendered much of its gains late in the week as it continues to impact the emerging markets space.
Pricing Power, or Lack Thereof
This National Federation of Independent Business chart shows no acceleration in selling prices, indicating there is limited exposure to increased inflation. The maintenance of full employment with an approximate 2% rate of inflation should keep the Federal Reserve Bank on target for its next rate increase, probably next month.
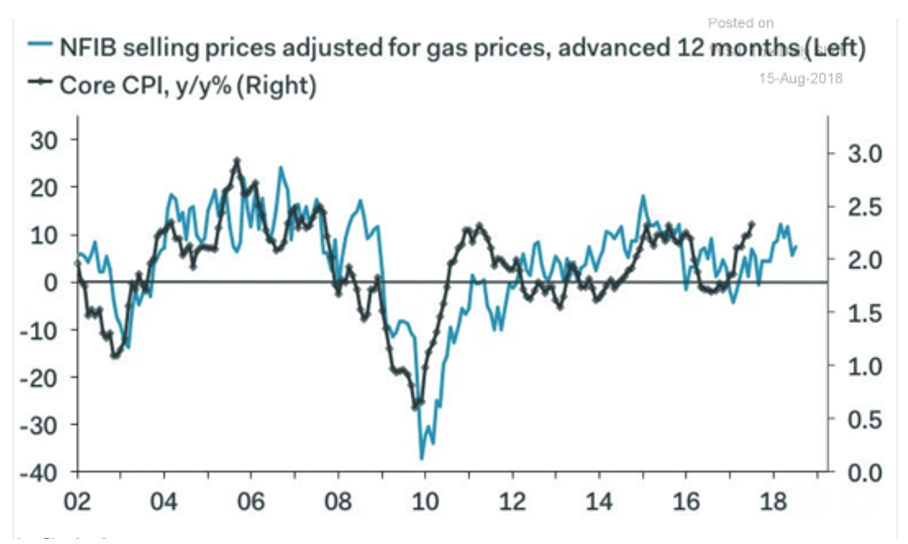
The federation’s Small Business Optimism Index marked its second highest level at 107.9. Also contained in the July report were new records in terms of owners reporting job creation plans and those with job openings.
The story of pricing power is somewhat different for companies in the S&P 500 index, as identified in a Financial Times article. The second quarter of 2018 was the best earnings season since 2010 as profit margins for these companies are on track to increase 24.6% from the same period last year. One executive was quoted “I think, overall, there is very little pushback on price increases,” since the increases stemming from rising raw material costs and tariffs are “well understood.”
The Week Ahead
Light issuance, some housing data, FOMC minutes release, and the Jackson Hole meeting.
Monday – Treasury auctions $96 billion 13 and 26-week Bills
Wednesday – release of the FOMC minutes from the August 1 meeting. Next scheduled meeting is September 26
Thursday – Fed speak will center on the Kansas City Fed’s Jackson Hole Economic Symposium; Treasury auctions $14billion five-year Treasury Inflation Protected Securities
Friday – Durable goods expected to be up 1%; Chairman Powell speaks at the Symposium re: monetary policy in a changing economy
August 13, 2018
Last week was quiet in the financial markets until Friday when the Turkish lira fell 13%. The currency is now down 40% for the year. As the lira fell, President Trump inflamed the crisis via his Twitter account when he threatened Turkey with tariffs. This boosted fear a bit in the broad financial markets and U.S. Treasuries benefited from a flight to quality. The benchmark 10-year note yield fell 8 bps on the day and 10 bps on the week, to end at 2.85%. Earlier in the week, Treasury completed its quarterly refunding of $78 billion in notes and bonds.
On Thursday the August debenture sale was priced. Please visit the Eagle Compliance LLC website to find details on the results of the sale.
The core CPI rate was of note. In other news, the CPI data for July showed a 2.9% y/y increase in the headline measure, and 2.4% y/y for the core. That core reading edged out highs from 2012 and 2016, now the highest since September 2008, the same month and year Lehman Brothers failed. That’s how long it’s been.
Banks continued to broadly loosen lending standards. Also of interest, and a topic of focus in this note, the Federal Reserve released the latest quarterly survey of bank senior loan officers. There’s useful data in this survey with regard to broad lending conditions. It gives us a sense of where we are in the credit cycle. Chart 1, below, shows the net percentage of domestic banks tightening credit standards for commercial and industrial loans. When the readings are below zero banks are, on net, loosening credit conditions. The most recent reading is minus 16. Over the prior three economic cycles, a reading of about -19 to -24 in this data series indicated the broadest loosening of credit standards.
What this chart does not tell us, comparing one cycle to the next, is if credit standards are absolutely tighter or looser. But we know from our own experience that, relative to today, credit standards were much looser in the cycle prior to the financial crisis last decade.
Chart 1: Trend in Bank Lending Standards
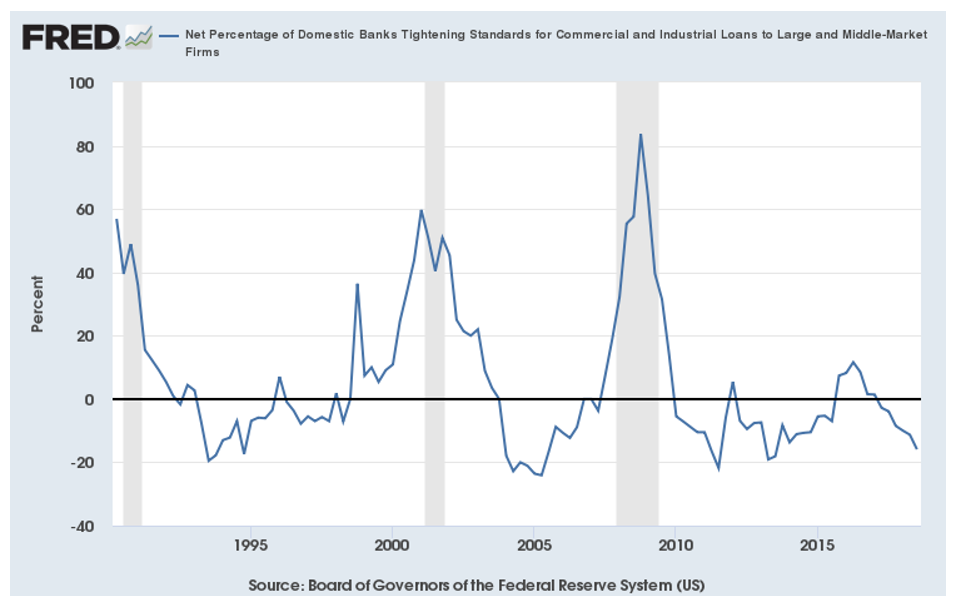
Since the Great Recession, we can see in the chart that there’ve been a few cases where there was widespread loosening of credit conditions only to have banks retreat toward tightening. The first instance of such a retreat to tightening, in 2011, occurred during an intensification of the long Euro crisis. The intensified crisis revealed real Grexit fears, with associated concerns about banking system stability and the European Central Bank’s slow response to contain the crisis. Even U.S. banks turned back toward tightening credit. When the Euro crisis calmed down, banks started relaxing standards again.
Banks then reversed looser standards starting with the 2013 taper tantrum. The Fed signaled the end of quantitative easing and long-term interest rates rose sharply. Quantitative easing did end and the Fed turned to signaling interest rate hikes. Over that multi-year timeframe banks continued to snug lending standards, and even moved to net tightening of standards in the first half of 2016. Lenders, however, eventually became comfortable with a stable and growing economy and a Fed committed to telegraphing a very slow pace of rate hikes and loosened standards again.
As a result, over the last few years an increasing number of banks loosened standards. The latest reading, -16, suggests there is still some room to go in the broad loosening of lending standards but the trend has run much of its course. Lending standards, however, can remain relatively relaxed for a long period of time. Announcements of looser bank regulation may help that.
August 6, 2018
The Week in Review
- Inflation is tame
- No Fed change; Treasury rates unchanged
- More tariffs and sanctions; but equities hold firm
- Job growth is solid
The core PCE report kicked off the week with a below forecast y/y rate of 1.9%, with Personal Income increasing by 0.4% in June. This PCE level hovers at the Fed’s target of 2% and while the FOMC meeting produced no change in policy as expected, its announcement did hail the strong economy, with language changed from previous descriptions of it as being solid. The Committee does plan to stay on course for two more rate increases this year, and possibly three more in 2019. In other central bank news, the Bank of Japan expanded its zero-interest rate target to as high as 0.20% for its ten-year JGB debt (trading 0.11% on Friday), and the Bank of England raised its short-term lending rate to 0.75%, its highest level in a decade.
In response to President Trump’s threat to impose tariffs on all $505 billion of imports from China, the Chinese government threatened retaliatory tariffs on another $60 billion of American imports, bring that total to $110 billion, or 85% of last year’s trade figure. The below forecast jobs report of 157,000 for July included upward revisions of 59,000 for May and June, and was very solid. Though wage growth of 2.7% remains below the 4% rate for when Unemployment was 3.9% in 2000, it does remain above inflation and a tight labor market bodes well for wage gains.
As we approach the August debenture sales for the 504 program, we have seen some backup in benchmark rates as the market prepares to absorb the Treasury’s August refunding. CT-10 is up 12 bps since the July debentures were priced, with credit spreads improved and the slope of the Treasury curve unchanged. In the chart below you can see where the benchmark issue tested 3% mid-week and rallied Friday after China’s threat of increased tariffs.

The Week Ahead
Fed speak resumes with some inflation reports late in week. In addition to Treasury sales of $174 billion, Freddie Mac will sell $2 billion in floating and fixed-rate debt, plus the 504 program will sell 20 and 25-year debentures.
Monday – Treasury auctions $96 billion in 13 and 26-week maturities
Tuesday – Treasury sells $34 billion three-year Notes
Wednesday – Treasury sells $26 billion ten-year Notes
Thursday – Treasury sells $18 billion thirty-year Bonds and the 504 program prices 20 and 25-year debentures. PPI is expected to be 0.2% ex food & energy, 2.7% y/y
Friday – CPI forecast to be 0.2% ex food & energy, 2.3% y/y
July 30, 2018
Best Quarter in Four-Years
Rising from the 2.2% rate of 1Q18, Friday’s first estimate of 2Q18 growth gives evidence the second-longest expansion on record is not expiring. It also identifies why the President is concerned about FOMC plans to continue gradually raising short-term rates. Of course, the offset to his concern is that the report’s strength lends credence to why the Fed is pursuing a tighter monetary policy - keep inflation in check. Even though the Committee concentrates on other inflation indicators (Personal Consumption Expenditures), recent reports for both Consumer Price Index and Producer Price index are well above 2%. Plus, the GDP price index rose a very hot 3%, signaling demand for goods is increasing.
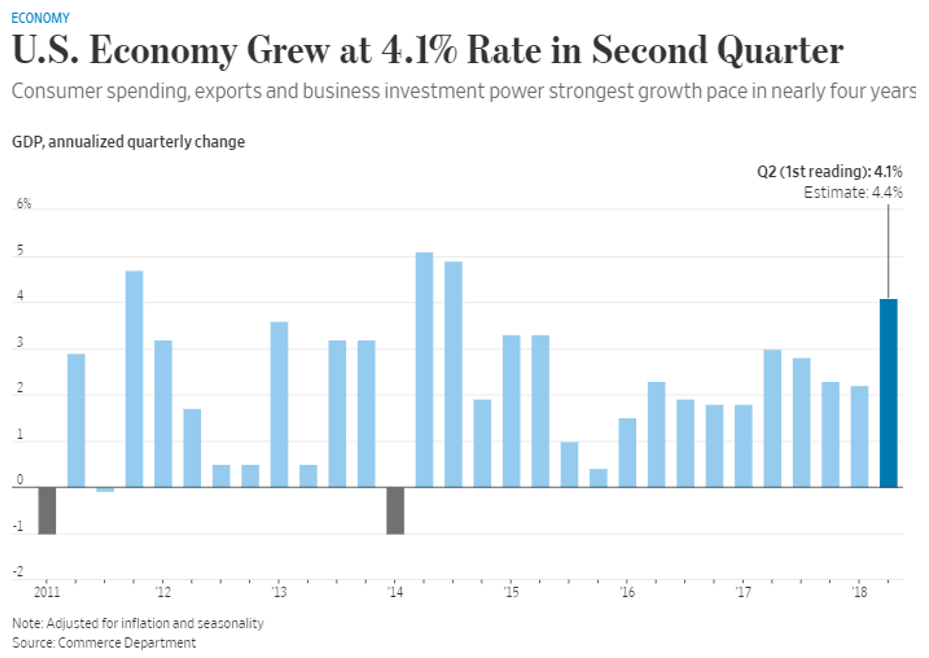
Trade contributed 1.06% as exports rose strongly, but analysts expressed concern that it was the result of customers in several countries getting ahead of the curve before new tariffs take effect. For an economy where consumer spending accounts for 70% of economic activity, real consumer spending rose 4% in the quarter. Taken together, it is clear the Fed will resist criticism and maintain its plan to have as many as two-more rate increases this year.
Other events of interest:
- President Trump declared a “new phase” in the relationship between the US and EU after the two parties agreed to lower industrial tariffs and increase liquified natural gas and soybean exports to Europe. This helped the DJIA gain 2% on the week, while keeping Treasury rates stable.
- Existing Home Sales fell for the third straight month while home prices are at a new high; reduced inventory is the cause for both.
- Durable Goods orders rose 1% but were well below forecast.
- In an active week for corporate earnings Facebook stood out, losing almost 20% of its valuation, followed by another social media site, Twitter, also reporting a decline in daily users.
- Bank of Japan intervened to support its zero-interest rate policy by purchasing its ten-year JGB’s when their yield reached as high as 0.11%, 285 bps lower than US Treasuries.
- Contrasting the US report, France reported 2Q18 growth of 0.2%.
The Week Ahead
Has no Fed speak during the blackout period ahead of the FOMC 7/31-8/1 meeting; Treasury sells just $96 billion short-term Bills, and we get some important economic reports.
Monday – Treasury sells 13 and 26-week T Bills
Tuesday – Personal Income & Outlays report include the Fed’s key inflation indicator, Personal Consumption Expenditures, expected to be 0.2%, 2.0% y/y. Fed begins its two-day meeting with no change in policy expected. Bank of Japan may modify its zero-interest rate policy
Wednesday – FOMC announcement
Thursday – Factory Orders forecast to 0.8%, aided by strong aircraft orders
Friday – Non-Farm Payroll expected to be 188,000, with the unemployment rate possibly declining to 3.9%
July 23, 2018
Them, Too!
After previously criticizing China and the European Union, President Trump on Thursday added the Federal Reserve Bank to the mix by that charging their plan to increase rates “hurts all that we have done.” Traditionally, Presidents and their administrations do not comment on Fed policy, but this administration is not traditional, and the President was echoing comments already made by his economic advisor, Larry Kudlow. The result was to push ten-year benchmark rates higher for the week and steepen the 2/10 Treasury curve. For the week, CT-10 is +6 bps and resting on its 40-week average; the curve is steeper by 5 bps. The market also reacted to speculation that Bank of Japan might abandon its zero-interest rate policy at its July 30 meeting. That policy has kept its ten-year JGB trading at 0.03%.
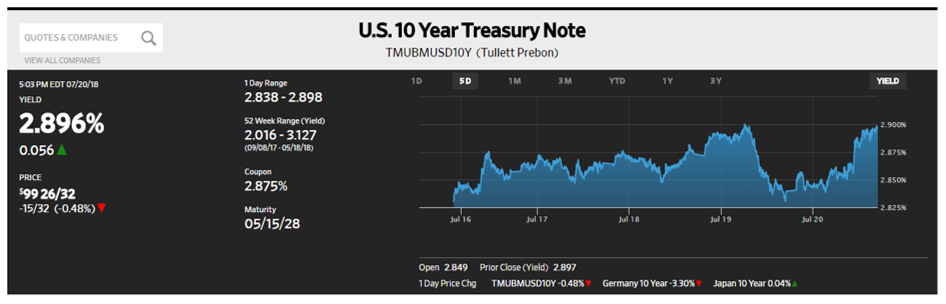
President Trump does not abide by norms but there is little upside to criticizing the FOMC and its chairman. Central bank independence permits it to make unpopular decisions, like they are doing now, and the President’s displeasure is obvious because higher interest rates strengthen the US$, making exports more expensive. Add this to Friday’s tweet about China and the EU manipulating currencies, plus a comment about possible tariffs on almost all $505 billion of China’s exports to the US, and the impact was as expected – higher rates, weaker US$, and more uncertainty.
Earlier in the week economic reports were positive and Fed Chairman Powell’s Congressional testimony was as expected:
- Retail Sales was +0.5% with May revised upward, with Y/Y sales at +6.3%. The big monthly increase in the report was for discretionary spending in bars and restaurants.
- Industrial Production rebounded in June at +0.8%, exceeding forecasts.
- Leading Indicators continue to rise, strongly suggesting the economy is tracking towards a 3% annual growth rate.
- Mr. Powell testified that the best way forward is to raise rates as the economy is growing “considerably stronger, with both a strong jobs market and inflation close to our objectives.”
The Week Ahead
The week is light on economic reports (mostly housing data) until GDP late in the week; has $215 billion in Treasury supply, and no Fed speak as we enter the blackout period leading up to the July 31 - August 1 meeting.
Monday – Treasury auctions $96 billion short-term Bills
Tuesday – Treasury auctions $35 billion two-year Notes
Wednesday – Treasury auctions $18 billion two-year Floating Rate Notes + $36 billion five-year Notes
Thursday – Treasury auctions $30 billion seven-year Notes
Friday – First estimate of 2Q18 GDP expected to be +4.2% vs. 2.0% for Q1. Consumer spending expected to be 2.9% vs. Q1 level of +0.9%
July 16, 2018
“Trade War with China in Aisle 12”
This was the headline for a WSJ article that expands the impact trade tensions are having not just on global trade, but also financial markets. The fight with China might soon involve Walmart, Best Buy, and Costco because the escalating tariffs are moving from goods bought by businesses to consumer goods like electronics, food, tools, and housewares. Though the recently proposed $200 billion in tariffs are lower at 10% than the 25% rate on the original $36 billion of goods, they will have more impact on prices paid by consumers, possibly stoking inflation.
The impact on financial markets is most evidenced in products like the benchmark ten-year Treasury note, which continues to attract buying interest as a safe-haven trade. It ended the week at 2.83%, virtually unchanged week to week, and 14 bps lower than when the Fed last raised rates on June 13. Continued demand for it was seen in last week’s $22 billion auction where 67% of the awards went to indirect/foreign bidders. This was the strongest of Treasury’s three term auctions and further flattened the 2/10 curve; flatter at +25 bps from +98 bps at this time last year. Further evidence of this skewed demand was the tepid reception for last week’s $33 billion three-year note that was positioned primarily by dealers.
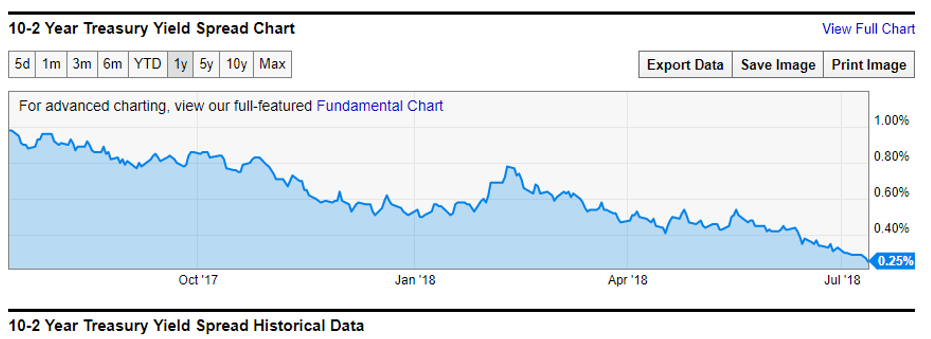
It’s not just outright buying of ten-year Treasuries that is driving this trend; the volume of trades in ten-year call options, which benefit when yields fall, has risen as investors seek insurance over worries about escalating trade friction. Over 7.7 million of these contracts traded in June, providing protection against falling yields. Positions in Treasury futures contracts, another way for portfolio managers to protect against lower yields, are near the all-time high set earlier this year. Taken together, this trend reflects market concern should proposed tariffs actually be put in place.
Other developments last week were:
- CPI and PPI both coming in as forecast, with their core rates at 2.3% and 2.8%.
- Fed Chairman Powell commenting he is upbeat on the economy but cautioned a sustained period of high tariffs on imports could be harmful to growth.
The Week Ahead
Fed speak is confined to Chairman Powell, and economic reports are relatively light.
Monday - Treasury sells $96 billion in three and six-moth maturities; Retail Sales expected to show strong consumer demand. President Trump meets Vladimir Putin in Helsinki.
Tuesday – Treasury sells $26 billion one-year Bills; Industrial Production forecast to be -0.1%.
Wednesday – Chairman Powell testifies before the House Financial Services Committee.
Thursday – Treasury sells $13 billion ten-year Treasury Inflation Protected Securities (TIPS).
** An indication of how flat the curve really is – one-year T-Bills are yielding 2.34%, just 49 bps less than the ten-year Note.
July 9, 2018
Where to Start?
Last week saw:
- The SBA 504 program price its first 25-year debenture, with an effective rate to small business borrowers of 5.32%; providing 25-year fixed rate funds just 32 bps above Prime Rate.
- Minutes from the June FOMC meeting affirmed the Committee’s gradual rate path, with possibly two more hikes this year. The Committee cited a tightening labor market and a “pickup” in consumer spending.
- Tariffs on Chinese imports went into effect Friday morning at 12:01, and China reciprocated.
- Friday’s jobs report was strong, even with an uptick in the Unemployment Rate.
- North Korea finds denuclearization talks with the US as “regrettable,” meaning sanctions stay in effect.
- June’s trade deficit improved, with exports +1.9% and imports only +0.4%.
- Trade tensions continue to leave longer-term benchmark Treasuries locked in a safe-haven trade and the 2/10 Treasury curve flattened to +28 bps.
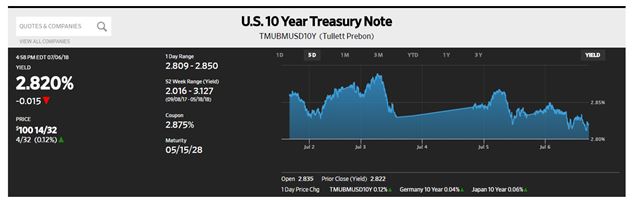
Concerning the rates market, only trade tensions are having an impact. Friday introduced $34 billion in tariffs on 818 different Chinese product categories, with an additional $16 billion to be targeted in coming weeks, and possibly another $200 billion if China were to retaliate, which they have said they would. The impact of a trade war will not be identifiable for some time, but with domestic stock markets +3.5% YTD on average, Chinese markets are -16.9%.
Friday’s strong jobs report of +213,000 included:
- Gains not just in business and professional services, but 36,000 jobs in manufacturing, President Trump’s targeted sector
- The uptick in the unemployment rate to 4.0% reflects 600,000 people rejoining the work force. Previously, they had been part of the category for “discouraged” workers who were not actively seeking work. Analysts consider this as people having more confidence in the economy
- The Civilian Labor Force Participation rate increased to 62.9%
The Week Ahead
Fed speak, inflation data, and Treasury sells $159 billion in debt
Monday – Treasury sells $90 billion short-term Bills
Tuesday – Treasury auctions $33 billion three-year Notes
Wednesday – Producer Price Index expected to be 0.2%; Treasury auctions $22billion ten-year Notes
Thursday – Consumer Price Index expected to be 0.2%; Treasury auctions $14 billion thirty-year Bonds
July 2, 2018
The Trend Continues
Trade tensions continue to dominate markets, keeping stocks in check and Treasury debt well bid in a risk-off trade that further flattened the Treasury curve by 12 bps since the 504-program priced 2018-20F on June 7. This performance creates an artificial value for the benchmark ten-year Treasury, forcing credit spreads wider to compensate for the enhanced worth of the benchmark.
“Might China Weaponize its Treasury Holdings”
That was the theme of a WSJ article that suggested China might respond to trade tariffs by not only retaliating with tariffs of its own, but also flood the market with some of its $1.18 trillion portfolio of Treasury debt. The answer is – not likely, as it would be counter productive for its global trading.
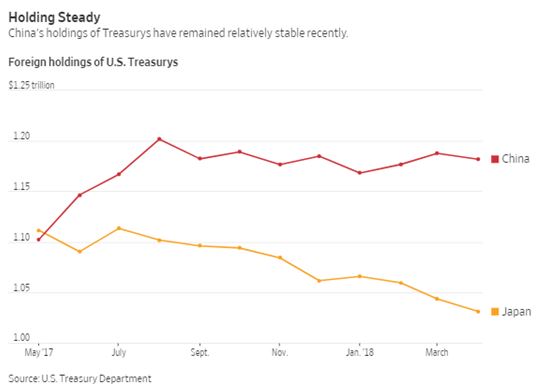
- In 2017 China exported $505 billion in goods to the US and imported $130 billion, getting paid in US$ for its exports
- If they converted US$ to its Renminbi they would drive up the value of their currency, making their exports more expensive and reducing their competitiveness
- So, they hold much of that revenue in US$ and invest in Treasury debt, the world’s deepest and most liquid market
This trade imbroglio can slow global growth and that is why the benchmark ten-year Treasury has declined from 3.11% in May to 2.86% on Friday, reflecting the market’s concern for continued economic growth that is already evidenced by the S&P 500 index down 4.5% from its January high.
Fear of an escalating trade war has resulted in investors pulling $29.7 billion from equity funds in the week ended June 27, the second largest weekly outflow since the beginning of the millennium. Showing that it is not just the ten-year Treasury that is seeing increased demand, Bank of America Merrill Lynch reported allocations to Treasury bills among its private clients has surged to a 10-year high. The yield on the 3-month T-bill is 1.925%.
Inflation Target Hit - Twice
- Friday’s Personal Income report showed a gain of 0.4% and the core reading for Personal Consumption Expenditures was 0.2%, finally reaching the Fed’s y/y target of 2.0%.
- Coincidentally, high energy prices pushed inflation in the Euro zone to 2.0%, with other price pressures remaining subdued.
- Consumer spending was lower than expected at 0.2%.
- The third estimate of 1QGDP was revised down to 2.0%.
The Week Ahead
Economic data is focused on manufacturing, June’s jobs report, and the 504 program prices its first 25-year debenture.
Monday – Institute of Supply Management report is expected to remain elevated
Tuesday – Factory Orders expected be -0.1%
Thursday – SBA 504 program prices 10, 20, and 25-year debentures; minutes of the June 13 FOMC meeting are released
Friday – Non-Farm Payroll consensus is 190,000, with the unemployment rate unchanged at 3.8%, and average hourly earning increasing to 2.8%
June 25, 2018
More of the Same
Stocks weakened (DJIA had its worst week since March), trade tensions increased, and US Treasuries are firmly entrenched in a safe-haven trade. The benchmark ten-year Treasury still resists the Fed’s tighter monetary policy and the slope of the Treasury curve continues to flatten – another 8 bps since the 504-program priced 2018-20F just three-weeks ago.
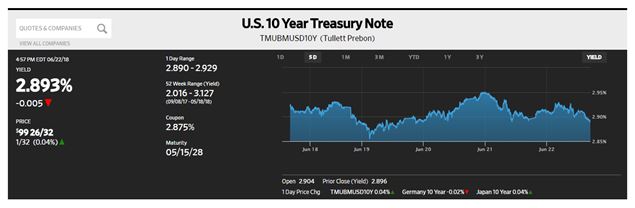
Sharing the wealth, or pain as it is, President Trump on Friday announced trade tariffs against an entity other than China, imposing a 20% tariff on European Union car imports. That had the expected effect on the zone’s car makers, sending their stock prices lower and enhancing the value of, and demand for Treasury debt. This demand is opportunistic for Treasury as it continues to fund an increased deficit that was enlarged by recent tax cuts and has yet to be affected by proposed infrastructure spending.
Lurking in the background is an item that has already challenged municipal pension funds – accounting for retirement obligations, and the government is not exempt. Social Security manages two accounts, old-age and survivors benefits and another for disability benefits. The program has had a cash deficit each year since 2009 but the deficit was masked by interest income - until now. The system holds much of its investments in non-tradeable Treasury debt, essentially reducing the government’s funding cost, but at the same time being hampered by a low interest rate environment. Unless changes are made to the system – either increased payroll taxes or reduced benefits to future retirees, only 79% of projected benefits will be covered by 2030.
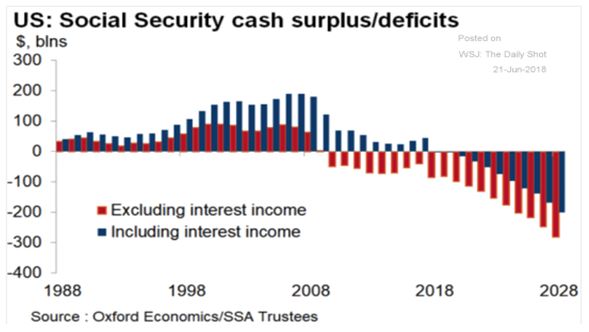
The Week Ahead
Fed speak, with Treasury to sell $206 billion in debt in a week light on economic data (some housing releases) but including the Fed’s preferred inflation indicator, Personal Consumption Expenditures on Friday, and it has a chance to hit the 2.0% target.
Monday – Treasury sells $90 billion in short-term Bills
Tuesday – Treasury sells $34 billion 2-year Notes
Wednesday – Treasury sells $36 billion 5-year Notes and $16 billion 22-month FRN’s
Thursday – Treasury sells $30 billion 7-year Notes
Friday – Personal income & Outlays; Personal Income forecast to be +0.4% with Core PCE +0.2% ex food & energy and 1.9%-2.0% YTD ex food & energy
June 18, 2018
Trade Tensions – “Buckle Up”
According to a WSJ article, that was the advice from a Chinese official to American executives in March when discussing simmering trade tensions. With the Trump administration announcing 25% tariffs on $50 billion in Chinese goods, China has said it would retaliate in “equal scale and equal strength.” The result is continuation of a safe-haven trade in Treasuries that keeps flattening its 10-year/2-year curve with the benchmark ten-year Note declining to 2.92% even after the Fed announced its most recent rate increase on Wednesday.
That represents the seventh rate increase since December 2015 and the Committee indicated it expects to raise rates twice more before year-end, and four times in 2019. The current range for Federal Funds is 1.75%-2.0% and if the intended path is maintained the upper end of the range will be 3.5% before year-end 2019.
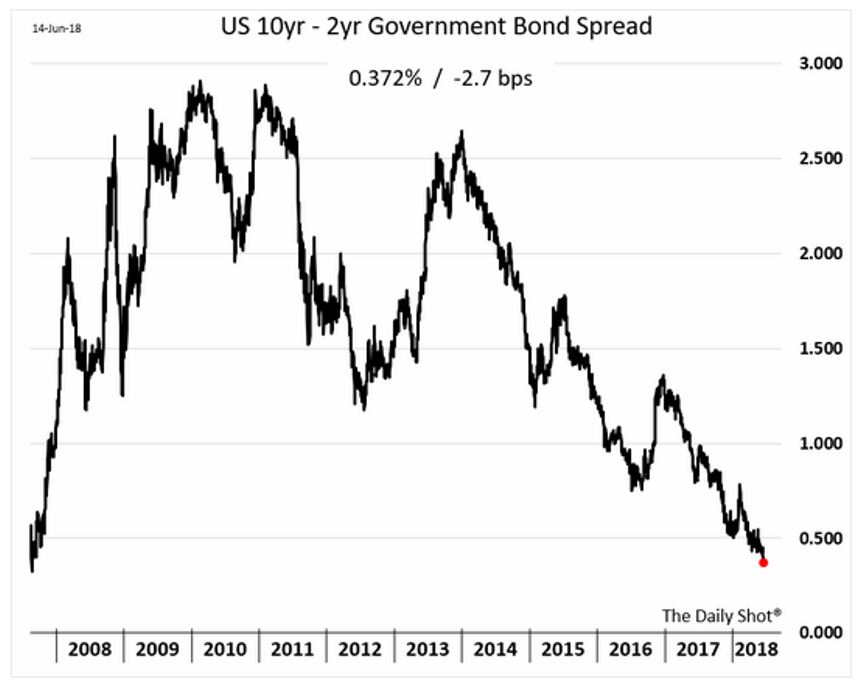
Seemingly overlooked last week was the historic Singapore Summit that is expected to denuclearize North Korea and end economic sanctions. President Trump cut short his visit, details have been sketchy, and skepticism abounds. Other items of interest:
- European Central Bank plans to end its €30 billion monthly purchases in December, but not raise interest rates until “through the summer of 2019”
- Bank of Japan will maintain its Quantitative Easing program of ¥80 trillion, keep its short-term rate at -0.1%, and cap the rate on its ten-year JGB, currently trading at 0.04%
- Christine Lagarde, Managing director of the IMF, cautioned that America’s yawning budget deficit could trigger an upsurge of inflation and interest rates that would shake global markets. She was quoted as saying clouds on the global economy are getting “darker by the day.”
- Emerging market currencies continue to be pressured as a result of tighter US monetary policy that has strengthened US$
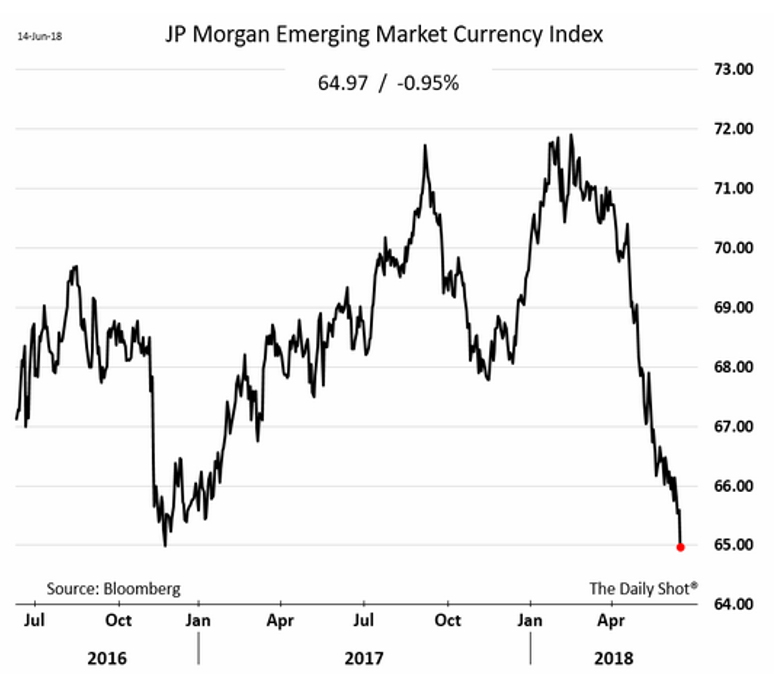
Economic reports were mixed with Retail Sales coming in double expectations at +0.8% and Industrial Production declining -0.1%. The week’s two inflation indicators continue to show strength ex food & energy: CPI was +0.2%/2.2% y/y, and PPI was +0.3%, 2.4% y/y. In his press conference Chairman Powell reemphasized the Committee’s focus on Personal Consumption Expenditures as their preferred gauge of inflation, stating it is expected to rise from its current 1.8% rate.
The Week Ahead
Fed speak resumes with the blackout period ended, Treasury sells $116 billion short-term Bills and $5 billion 30-year TIPS. The economic calendar is light with some housing data and a Purchasing Managers Index late in the week.
June 11, 2018
The G-7 meeting in Canada had enough trade tension even before President Trump recommended the group revert to being the G-8 by readmitting Russia, which had been expelled in 2014 for its annexation of the Crimea. The only support for this provocative idea came from Italy’s newly appointed Eurosceptic Prime Minister, Giuseppe Conte. Then, before departing for Singapore he refused to sign a previously agreed upon statement, further disrupting his relationship with major trade partners.
Markets mostly marked time, with the rates market flat, stocks, and the US$ slightly improved, and oil softening in advance of increased OPEC production.
The SBA 504 program priced its June 20-year debenture at 3.60%, an Effective Rate for small business borrowers of 5.32%, which is just 70 bps above Prime Rate, a measure that is expected to increase this week. As the rates market has responded to a tighter and ongoing monetary policy, and the Treasury curve has flattened, investors have demanded more spread for credit product. This increased pricing spread to Treasuries has been offset by the flatter Treasury curve as evidenced by the SBAP 2018-20F rate being 78 bps higher than the 2015-20L debenture rate of 2.82%, with the Fed having raised short-term rates by 150 bps since December 2015.
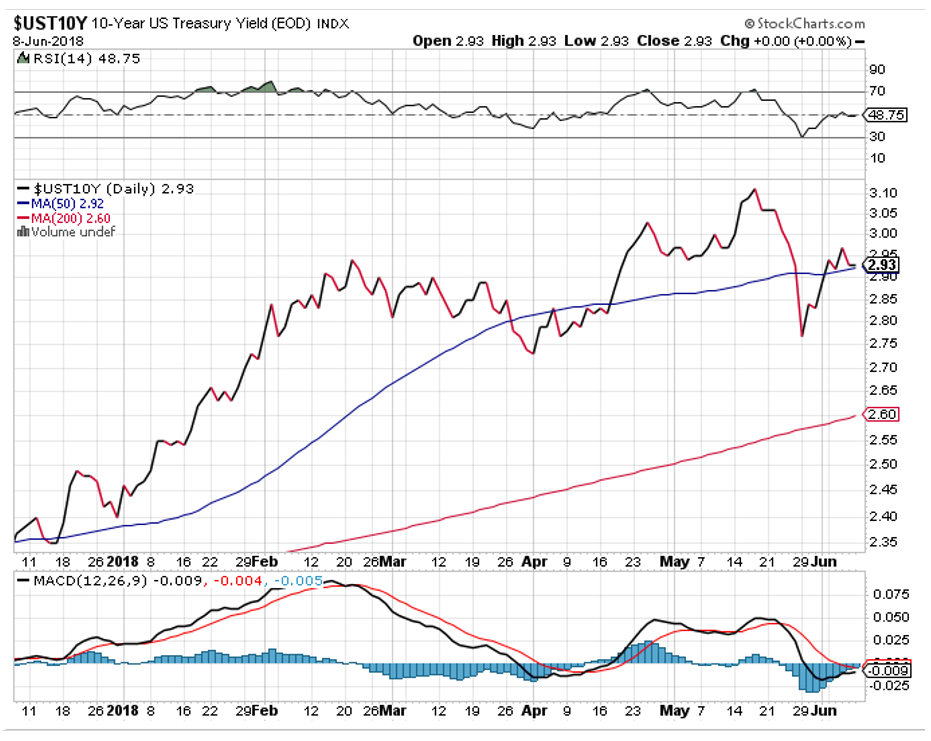
The Week Ahead
Is one of the busiest of the year: the North Korea-USA summit, the Federal Reserve Bank, European Central Bank, and Bank of Japan make policy announcements, and the World Cup begins. Fed speak will be focused on the Chairman’s press conference and Treasury will auction $158 billion in debt prior to the FOMC meeting’s conclusion.
Monday – Treasury to sell $90 billion in short-term Bills, $32 billion three-year Notes and $22 billion ten-year Notes. The on again, off again summit between President Trump and Kim Jong Un takes place in Singapore at 9:00 pm ET.
Tuesday – Treasury auctions $14 billion thirty-year Bonds; CPI expected to be +0.2%; 2.2% y/y. FOMC meeting begins.
Wednesday – PPI expected to be +0.2%; 2.5% y/y; FOMC announcement expected to include a rate increase to 1.75%-2.0% for Fed Funds, followed by the Committee’s economic forecasts and its dot-plot of interest rate projections, and then the Fed Chairman’s press conference.
Thursday – Retail Sales consensus is +0.4% and Russia hosts Saudi Arabia in the opening game of FIFA’s World Cup. European Central Bank is expected to identify the status of its €30 billion monthly bond buying program.
Friday – Industrial Production is expected to show a gain of just 0.1% and the Bank of Japan affirms its monetary policy.
June 4, 2018
A Short Week, Long on Angst
A safe-haven trade that saw ten-year US Treasuries rally as low as 2.78%, saw them reverse that move into a strong Non-Farm payroll report on Friday.

The Week in Review
Europe factored greatly in market performance as Italy, led now by a pairing of the anti-establishment Five-Star movement and the far-right League, eventually put together a government. Joining them was Spain with a vote of no confidence in Prime Minister Mariano Rajoy, who became the first Spanish prime Minister in the country’s democratic history to be removed by parliament. The Italian issue though is not going away as many challenges await the new government. As the Euro zone’s fourth largest economy it is plagued by low productivity and high sovereign debt, making it difficult to enact planned social changes. Not exactly a replay of Greece, but a challenge to the EU.
On the domestic front the US announced tariffs on steel and aluminum imported from the EU, Canada, and Mexico, some of our closest allies and largest trade partners. That immediately resulted in reciprocal tariffs which will challenge global trade.
Stocks cratered early in the week when the safe-haven trade in Treasuries was strongest, then recovered as it seemed the European political unrest was abating and were further helped by Friday’s report of the 92nd consecutive gain in employment; 223,000 jobs created with upward revisions to previous months. Highlights of the report were:
- 3.8% Unemployment Rate is the lowest in 18-years
- 6.9% Unemployment Rate for discouraged workers is a dramatic improvement from 7.6%
- 2.7% average hourly wage gain
Other economic releases did little to discourage the probability of a June 13 rate increase by the Fed: 1QGDP was revised lower to 2.2% and the FOMC’s preferred inflation indicator, Core PCE, increased 0.2%, making its y/y gain 1.8%. Whether the Committee increases rates twice or three times more in 2018 is not that relevant, what is important is the total number of hikes through 2019. With the end of Quantitative Easing and the introduction of a tighter monetary policy, it is interesting to note how the SBA 504 program’s funding for 20-year debentures has changed in 4 ½ years:

December of 2013 was the tail-end of the taper tantrum that took place in anticipation of the Fed raising rates. The 150 bps increase in the FF rate has flattened the Treasury curve by 220 bps, increasing the borrowing cost of small businesses by 12 bps. The Fed is committed to gradually raising rates and the program’s funding costs will increase, but if the curve continues to flatten it is probable that future funding costs will not increase as much as short-term rates.
The Week Ahead
A light week for economic reports and no Fed speak as we enter a blackout period in advance of the June 12-13 meeting. Treasury supply is limited to short-term T-Bills and credit supply will be $900MM of a 15-year FRE, and the 504 program’s 2018-20F debenture sale.
Monday – Factory Orders expected to decline 0.4%, based on last month’s Durable Goods report
Tuesday – Institute of Supply Management forecast to gain 1.2 points to 58
Thursday – SBAP 2018-F is priced, for settlement June 13
May 29, 2018
Resilient
The rates market last week shrugged off a heavy financing calendar, instead embracing modest economic releases, the geo-political tensions resulting from the uncertainty about the North Korea summit, the undefined status of announced tariffs, and some ambiguous inflation comments in the FOMC minutes. The result was a return to safe-haven trades in Treasuries and gold.
Risk aversion was also present in Europe as political instability in Italy and Spain produced selling of their sovereign bonds with some European bank shares declining as much as 7.5%. For the Euro zone that means German bunds attracted demand, with that ten-year maturity declining to 0.39%, 254 bps less than US Treasury debt.
This chart reflects the six-month rise for ten-year Treasury yield and its recent downturn toward its 50-day Moving Average, a level that should provide resistance as the Fed continues its tightening monetary policy.

Expectations are for two and possibly three more rate increases this year, with the next one projected for the June 12-13 FOMC meeting. The released minutes from May affirmed the Committee’s objective to maintain a course of gradual rate hikes, but did caution about “the possible adverse effects of tariffs and trade restrictions” on the economy. The incongruity of low unemployment and steady economic growth vs. persistently low inflation and global tension will keep markets offsides until there is more clarity.
The Week Ahead
Treasury auctions just $130 billion in short-term Bills, more Fed speak, plus some important economic releases.
Tuesday – Treasury auctions $130 billion in four-week, thirteen-week, and twenty-six-week T- Bills.
Wednesday – second estimate for 1Q18 GDP expected to be unchanged at 2.3%.
Thursday – Personal Income & Outlays forecast to be unchanged at 0.3% with the Fed’s key inflation indicator, Core PCE, expected to be 0.1%, reducing the y/y rate to 1.8%.
Friday – Non-Farm Payroll expected to increase to 185,000 with the Unemployment Rate unchanged at 3.9%, and average hourly earnings expected to increase 0.3%.
May 21, 2018
Rates Move Higher
The benchmark ten-year Treasury note cracked 3.0% and held above that level because:
- Retail Sales report on Wednesday showed continued strength, with upward revisions to February and March reflecting healthy consumption, a key component of the economy
- Because of US$ strength, foreign central banks sold Treasuries to defend their currencies
- Market momentum simply caught up with the Fed’s monetary policy

The primary answer is probably market momentum, as investor confidence in the US economy supports the path to higher interest rates with at least two, and possibly three more rate hikes expected this year. At 3.06% CT-10 is at its highest level since 2011 while the shape of the Treasury curve has been flattening three-month Treasury Bills to now yield 1.89%, matching the trailing dividend yield for the S&P 500 Index.
While the US$ is up 4% since mid-April, countries that have been hit hardest by its strength, like Argentina and Turkey, are not big holders of Treasuries and unlikely to have been sellers. In fact, Argentina was able to rollover $250 billion of US$ denominated debt last week.
Domestically, the market easily digested this month’s quarterly refunding supply, and now must prepare for $231 billion of Treasury debt this week, with more to come as Treasury needs to fund the government’s deficit. This supply, and investor’s demand, will be linked to Fed policy as we approach the June 12-13 FOMC meeting.
Another development reflecting the balance of supply and demand was the impact of the Iran nuclear deal giving the price of oil a boost. Brent crude closed the week at $78 as the expected increased supply from Iran was cancelled, while OPEC and Russia continue to withhold 1.8 million barrels of oil a day. Reduced supply has given this commodity additional strength leaving global producers uncertain about maintaining this price level.
One report lacking in strength was Euro area growth being 0.4%, with Germany even lower at 0.3%, growth levels that are keeping global sovereign debt yields significantly lower than the US.
Bank loans are showing a 3% y/y rate of growth but that is far below the double-digit growth in the 2014-2016 period. Hedge funds, private-equity firms, and insurance companies are providing the competition and the first two categories exist in a lightly regulated environment.
Bill Demchak, CEO of PNC Financial Services Group, says he expects financial technology, or fintech, firms operating online to affect his bank’s small business lending: “fintech has decided to make things very simple for small business and to do it with a very low-cost base.”
The Week Ahead
There is a lot of Treasury supply and Fed speak, with Jerome Powell scheduled to talk on Friday. A light economic calendar will focus on housing data, Durable Goods, and the release of Fed minutes.
Monday – Treasury auctions $90 billion short-term Bills
Tuesday – Treasury auctions $26 billion 52-week Bills and $33 billion two-year Notes
Wednesday – Treasury auctions $16 billion 23-month Floating Rate Notes and $36 billion five-year Notes. Minutes of the FOMC meeting ended May 2 are released
Thursday – Treasury auctions $30 billion seven-year Notes
Friday – Jerome Powell speaks
May 14, 2018
“Energized” – an apt header for this WSJ chart, showing how the energy sector, +3.8% on the week, led the equity markets to their best performance since March after President Trump delivered on his promise to pull the US out of the Iran nuclear agreement.

As robust as equities were, the Treasury rates market held ground after softening after the quarterly auction of three-year Notes on Tuesday. Performance improved after Wednesday’s soft Consumer Price Index report showing core CPI up just 0.1% in April, 2.1% y/y.
By the time the SBA 504 program’s May debenture sales were priced on Thursday, benchmark ten-year Treasury Notes had stabilized but were trading 14 bps higher than in April, with Swap spreads and credit spreads wider. Those wider spreads reflect the continued flattening of the Treasury curve, as expressed by the spread between the Treasury two and ten-year maturities. At +43 bps it is the flattest since September 2007.

The above chart identifies the impact of the six rate increases since December 2015 as the economy continues on its ninth-year of economic expansion. Issue size for 2018-20E, at $375,113,000, was the largest since July 2013 while its 3.5% debenture rate was the highest since 3.46% in January 2014.
Expectations are for two more rate increases this year with the next one perhaps occurring at the June 12-13 FOMC meeting.
The Week Ahead
Fed speak and headline news will dictate activity, with light traffic in economic reports and mostly short-term Treasury supply.
Monday – Treasury auctions $90 billion short-term Bills
Tuesday – Retail Sales expected to be 0.3%, following weak consumer spending in 1Q18
Wednesday – Industrial Production forecast to be 0.6%, with increased Capacity Utilization
Thursday – Treasury auctions $11 billion ten-year TIPS (Treasury Inflation Protection Securities), currently yielding 0.81%
May 7, 2018
Resilient
The benchmark ten-year Treasury Note showed signs of climbing back to the 3.0% level mid-week but stabilized after the FOMC meeting concluded with no rate change, and then closed the week unaffected by Friday’s Non—Farm Payroll report.

The Week in Review
Monday’s release of the Fed’s preferred inflation gauge was as expected, showing the core rate for Personal Consumption Expenditures increasing to 1.9% y/y from the previous month’s 1.6% reading. That puts this indicator very near the Committee’s target of 2% but did little to encourage analysts who expect more than three rate increases this year.
With no change in policy the Fed identified their approach to inflation as being symmetric, meaning they can envision accepting an inflation rate above 2% without increasing the pace of rate increases.
Also helping the market was Treasury’s release of its quarterly funding plans, with an emphasis on increasing the size of shorter-term issues to fill its increased need. An additional $27 billion is needed for the quarter, raising all auction sizes with 2 and 3-year maturities being increased the most.
Friday’s NFP report came in below expectations at 164,000 with the Unemployment Rate declining to 3.9%, its lowest level since December 2000. Low is the best description for many economic readings; not only the Unemployment Rate but also wage growth (below forecasts at 2.6%) and also GDP in 1Q18 at 2.3%.
European Union inflation continues to disappoint, with its recent CPI report showing a 1.2% rate, with its core reading just 0.7%.
This WSJ chart shows how all unemployment categories from Friday’s report continue to improve.

The Week Ahead
There are few economic reports, lots of Fed speak, the Treasury’s quarterly refunding for $163 billion, and Thursday’s May debenture sales for the SBA 504 loan program.
Monday – Treasury auctions $90 billion short-term Bills
Tuesday – Treasury sells $31 billion three-year Notes
Wednesday – Treasury sells $25 billion ten-year Notes. At 2.95%, this benchmark is 13 bps higher than when 2018-20D was priced last month
Thursday – DCPC 10C and 20E are priced, and Treasury sells $17 billion thirty-year Bonds
April 30, 2018
Well, the 10-year treasury note yield finally did push above the psychological 3% barrier, touching an intra-day high of 3.03% on Wednesday. So take a guess at where the yield ended on the week? If you guessed hardly changed, you’re a winner. On Friday afternoon the yield was 2.96%, up just one basis point on the week. People who follow the charts had designated 3.05% as the more significant level and of course the yield fell short. For the rest of us non-star gazers, the focus was on 3%, and the market was not roiled much once that barrier was breached. Perhaps we are in for a period of consolidation.
Over the last couple of weeks we’ve been stressing among other things the deterioration of supply technical conditions in the treasury market. The combination of rising treasury supply from a growing U.S. budget deficit, and the desire by global central banks to pull back on purchases of government securities, means non-central bank buyers will need to pick up the supply slack. Along those lines, there was an article of interest in Bloomberg last week that discussed the rise in oil prices and foreign assets held in portfolios among the oil-producing nations. Chart 1, below, shows the price of Brent crude oil since 2006 (white line). Notice the recovery in the price of oil starting from the beginning of 2016.
Chart 1

Also on the chart, over the same time frame and shown in a blue line, is the level of net foreign assets for the Saudi Arabia Monetary Agency. We can see the net foreign assets started a fairly steep decline of over $1 trillion since the collapse in oil prices that started in 2014. But the level of assets has simply bottomed out and not started to recover. A useful question is, with the increase in the price of oil will the Saudis and other oil producers start putting petrodollars back to work in the liquid asset markets, such as treasuries, in order to build up foreign asset portfolios? If so, such activity would offer some needed supply support for treasuries and helped dampen a further rise in yields. It will be interesting to see what develops on this topic.
There was a good bit of economic data released during the week and in general it was stronger than expected. Stronger data included existing home sales, new home sales, headline durable goods and a first look at Q1 GDP growth. The Employment Cost Index came in a bit higher than expected. But the GDP price index posted a 2% y/y increase, which was not alarming.
This week data releases will be anchored by Friday’s employment report for April. Prior to that, on Wednesday, the FOMC will make a monetary policy announcement. Expectations are for the FOMC to stay on the sidelines this month before boosting the target rate at the June meeting. Market expectations are for two to three rate hikes over the balance of the year, and this is in line with FOMC guidance.
April 23, 2018
Last week interest rates rose, particularly in longer maturities, on a global basis. Chart 1 below shows the Bloomberg Global Aggregate yield index nearing a four-year high. This chart looks similar to a yield chart for the benchmark treasury 10-year note.
Chart 1

While there was some supply indigestion from overseas government bond auctions, another reason for the yield increase was evidence of price pressures related to the Trump metals tariffs. For example, the Philadelphia Fed index of business activity, released last Thursday, showed that prices paid by businesses increased to a seven-year high. Prices received by businesses increased to a 10-year high. In the Fed Beige Book, released last Wednesday, the topic of tariffs was raised by all districts reporting. In some cases tariffs had a “dramatic” impact on aluminum and steel prices due to stockpiling.
In the bond market, we can see the ramifications of this activity by looking at the inflation rate swap for five years in five years (the “five-in-five”). This is a swap contract that takes a position on the rate of the CPI in five years, over the succeeding five years. As we can see in Chart 2, this forward inflation level (blue line) reached 2.3% last week, near the top end of the range over the last three years.
In the same chart (red line) we also show the yield for the benchmark 10-year treasury note. Last week that yield approached the 2.95% year-to-date high. We can see that the note’s yield spread to the five-in-five inflation rate has expanded since the Fed started regular hikes in the target Fed funds rate in 2017. But the additional yield offered over the five-in-five inflation rate, not even 70 basis points, is quite skinny by long-term historical standards. Before the financial crisis, a spread of 200 basis points would have been considered a reasonable spread to be paid over expected inflation. Perhaps 200 basis points of spread is not required anymore with this post-crisis low inflation mentality among investors, but compensation of under 100 basis points certainly seems too lean.
Chart 2: T-note Spread to 5-in-5 Inflation Rate Jumped When the Fed Started Regular Hikes in 2017

The recent gain in the yield on the 10-year note shows signs of having been technically overdone. The stockpiling of metals by U.S. businesses could be a short-term phenomenon and industrial commodity prices will settle down. That could provide some relief of rising inflation expectations, which would support an opportunity for the yield to retrace a bit of the recent rise.
In the bigger picture, however, years of unprecedented purchases of government securities by the major central banks, combined with expectations for below-average global inflation, has had a lot to do with why long term U.S. interest rates have remained so low for so long. Central banks are still providing a lot of accommodation, but the Fed is finished adding to its portfolio. The ECB and the Bank of Japan are trying to reduce stimulus. The ECB is expected to announce the end of QE sometime this year and the BOJ has slowed bond purchases for over a year now. There is a growing U.S. budget deficit that must be funded by issuing more new treasuries across the yield curve each month.
The supply technicals that have supported extremely low interest rates for years finally have eroded. That said it is a time of periodic chaos and sustained volatility in U.S. political leadership. This will continue to provide an itchy bid for liquidity, and therefore treasury prices.
This week we will receive some important economic data. The most interesting include purchasing managers’ indices, new and existing homes, durable goods, and the biggest potential mover of the week in the advanced estimate of first quarter GDP.
April 16, 2018
Last week the risk-on trade made a comeback. U.S. large cap stocks gained 2% and the VIX large cap stock option volatility index fell 15%. Credit spreads were a few basis points tighter and government-guaranteed MBS passthrough spreads a few basis points wider. It was interesting to see the steady decline in expected stock price volatility amid increased geopolitical tensions and domestic political intrigue. It seemed that from the perspective of the capital markets, somewhat de-escalated trade tension between China and the U.S. was more important.
In the benchmark treasury market the monthly offering of three- and 10-year notes and 30-year bonds met with lackluster investor demand. The Street ended up owning the largest share of the auctions since later last year. Of note was a decline in appetite from foreign investors. After setting record high of $3.1 trillion in treasuries held at the Fed for foreign central banks, these investors have recently slowed the pace of purchases. This behavior comes at a time of increased expected U.S. budget deficits courtesy of tax cut and spend policy. The U.S. budget deficit halfway into the current fiscal year stands at $600 billion. Treasury will continue to increase the size of its market borrowings and ceteris paribus the auctions should have to clear at higher interest rates.
Other notable events in treasury-land included PPI and CPI data which supported the story of a gradual increase in inflation, and Fed minutes that supported expectations of at least two more rate hikes this year. That said, the w/w yield increased only several basis points in the benchmark 10-year maturity to 2.83%. The yield curve continued to flatten, however, as the two-year note yield increased 10 basis points to 2.37%. As this week’s chart focus shows below, the slope of the yield curve from 2 to 10 years, at 46 bp, is narrow by past standards, but still quite a bit shy of the inversion signal that has been an accurate forecast for coming economic dark clouds.

This week the economic calendar is full of second tier data including retail sales, housing starts and industrial production. The Fed Beige Book will be released. The Fed speaker of note this week is New York Federal Reserve Bank President William Dudley.
April 9, 2018
“Stocks Plummet Amid Rising U.S.-China Trade Tensions”
This is the WSJ headline reporting on Friday’s stock market activity as the tit-for-tat tariffs being announced by the US and China have escalated, leaving global markets in disarray. DJIA declined 2.3% (572 points) on the day and its YTD gains have been lost.
The day started innocently enough with a below consensus Non-Farm Payroll report that came in at +103,000, weaker than expected but with some positive components:
- The positive number represents the 90th consecutive month of gains, the longest stretch on record
- 4.1% Unemployment Rate for the sixth month in a row remains below the Fed’s target range for full employment
- 2.7% y/y gain for average hourly earnings was an improvement
- U-6, the Underemployment Rate that identifies part-time workers seeking full time jobs and discouraged workers, declined to 8%
- The report should keep the Fed on course for gradual rate increases, just as Janet Yellen and Jerome Powell have predicted
Besides pummeling stocks, the US$ weakened and investors returned to safe-haven Treasuries.

That return took place after the 504-program priced its April debenture sale, an event that took place on Thursday after stocks had recovered from previous tariff headlines and the rates market was softening.
Complicating the President’s tweets is conflicting commentary from Administration officials: Treasury Secretary Steven Mnuchin on Friday said there is “potential for a trade war” with China, followed by White House National Economic Council head Larry Kudlow saying the US is “not in a trade war.” However, Mr. Kudlow also admitted talks with China “have not really begun yet,” so markets have little substance to guide them.
Other than the NFP report there was little economic data and the Fed speak was cautionary, expressing confidence inflation would reach 2% and the economy would not overheat.
The Week Ahead
There is more Fed speak, $154 billion in Treasury auctions, and some inflation data, though not the indicator favored by the Fed. Minutes of the last FOMC meeting that raised interest rates are released, and 2018-20D funds on Wednesday.
Monday – Treasury auctions $90 billion short-term Bills
Tuesday – Producer Price Index expected to be +0.1%, 2.5% y/y; Treasury auctions $30 billion three-year Notes
Wednesday – Consumer Price Index expected to be +0.2%, 2.0% y/y; Treasury auctions $21 billion ten-year Notes; Minutes of the March 21 FOMC meeting are released; SBAP 2018-20D funds
Thursday – Treasury auctions $13 billion 30-year Bonds
April 2, 2018
The Resilient Rates Market
At least part of it is. As we approach the April debenture sale for the SBA 504 loan program, it is clear the market has reacted to the six rate increases by the Fed since December 15, 2015. Short-term rates (Federal Funds), the only ones that the Fed policy makers control, have risen in response to the rate hikes while longer dated maturities have help firm.

The ten-year benchmark Treasury is actually 14 bps lower in yield since the most recent hike on March 21, continuing the curve flattening trend on this chart that dates back to December 30, 2013, two-years before the Fed began its most recent series of rate increases.

The slope of the yield curve is considered an indicator of expectations of future economic growth and inflation. The current flattening is believed to represent continued modest economic growth but potential skepticism for the stock market and inflation.
Here is a table of rates dating back to that December 2013 date, with the current FF rate now even higher at 1.625% than when 2018-20C was priced. It is clear how the 504 program has benefitted from the Fed’s accommodative interest rate policy, and now the flattening curve serves as a benchmark to provide small business borrowers the cheapest source of fixed rate long term debt.

Other market developments that are influencing market performance are a continued weaker US$, rising oil prices, and wider credit spreads as investors demand more spread for product being priced off expensive benchmarks.
The Week in Review
The largest weekly auction of Treasury debt was well received, the important inflation indicator came in as expected, and stocks ended March with the first quarterly loss since 2015. The S&P 500 index was down 1.8%, though less a decline than European and Asian indexes.
The Week Ahead
Treasury sells just $90 billion short-term T-Bills, more Fed speak, the 504 program prices 2018-20D on Thursday, and employment data on Friday.
Monday – Institute of Supply Management manufacturing index expected to decline after the February reported marked a 14-year high.
Wednesday – Factory Orders expected to be +1.5, following up a strong Durable Goods report.
Thursday – the 504 program prices 2018-20D.
Friday – Non-Farm Payroll consensus is +167,000, following two strong months of gains. Unemployment expected to be 4.0%, and average hourly earnings to be +0.2%.
March 26, 2018
Market Reaction to Wednesday’s 25bps Rate Hike – Meh!
Stocks were unchanged, Treasury rates declined slightly, and US$ strengthened a bit. And then, after the close President Trump announced $50 billion of tariffs against China over intellectual property violations on numerous products. That sent the DJIA down almost 3% (724 points) on Thursday, with the benchmark ten-year Treasury rallying 8bps to close at 2.83%, evidence of a flight to safe-haven trades as gold also strengthened.
Other developments last week included:
- President Trump’s lead attorney for the special counsel investigation, John Dowd, resigning because his counsel was being ignored by the President
- Facebook’s Mark Zuckerberg finally surfacing to apologize for the data breach and offering measures to improve security. On the week, FB shares declined 14%
- China retaliating with a modest $3 billion tariff on American goods
- And then Friday’s market performance continued the selloff, with DJIA down another 1.7% (426 points) with Treasury rates holding firm. This left the index down 1400 points over five-days, a decline of 5.7%

Circling back to what the market expected to matter most last week, Fed Chairman Powell provided a departure from past press conferences with both his candor and the brevity of his conference. Mr. Powell indicated he will be guided by the economy’s performance and less by theories and models, not unusual for the first Fed chairman in 40-years without a PhD in Economics. Items included in the release were:
- The Committee expects the Unemployment Rate to reach 3.8% by December and 3.6% in 2019
- A total of three rate hikes remain in the forecast for 2018, with three increases now projected for 2019
- Inflation rate is expected to be contained but wage growth should be helped by a tighter labor market
- The Committee’s GDP forecast for 2018 is raided to 2.7% but its 2019 forecast id 2.4%
Economic reports last week were constructive, though mostly ignored:
- Purchasing Managers index showed solid growth in manufacturing
- Existing and New Home Sales were positive with the median price of a new home +9.7% y/y at $326,800
- Durable Goods report recovered with a 3.1% gain
The Week Ahead – Fed speak returns in a holiday shortened week, stock market futures are poised for a rebound, Treasury is conducting its largest weekly sale in history ($229 billion), plus the key inflation indicator:
Monday – Treasury auctions $96 billion short-term Bills and $30 billion two-year Notes
Tuesday – Treasury auctions $24 billion 4-week Bills and $35 billion five-year Notes
Wednesday – the third estimate of 4Q17 GDP expected to increase to 2.7%; Treasury auctions $15 billion two-year FRN’s and $29 billion seven-year Notes
Thursday – the FOMC’s preferred inflation gauge is part of the Personal Income & Outlays report. PI&O is expected to be 0.4%, with core Personal Consumption Expenditures forecast again at 0.2% (1.5% y/y), holding firm below its 2.0% target
March 19, 2018
Risk Off, for a bit
Markets bounced around last week; bonds rallied and stocks weakened, in response to:
- Staff upheaval in the Administration, with the Secretary of State fired and the National Security Advisor expected to be next in line
- A weak Retail Sales report reflecting a decline in consumer spending
- Continued tariff threats involving EU and China; plus, retaliatory measures
- The Senate rolled back financial regulations in Dodd-Frank

The Week in Review
The result was a down week for stocks and improvement in Treasury prices until late in the week. At that time the market appeared to turn its attention to Wednesday’s Fed announcement, where the Committee is expected to raise their interest rate target by 25 bps. Analysts are also expecting a possible forecast change, increasing the number of expected rate hikes this year to four.
- US Treasury auctions were well received as rates held firm with a below average amount of foreign purchases. In fact, foreign ownership of US Treasuries has declined for the third straight month to $6.2 trillion from their record high last October. In other bond market news, on Tuesday not one single trade took place in Japan’s ten-year note, the result of the Bank of Japan owning 40% of the supply via its monthly purchases and domestic investors maintaining a buy and hold strategy. The ten-year JGB is quoted at a yield of 0.05%.
- Deputy Director of the FBI Andrew McCabe joined Rex Tillerson on the firing line
- In addition to tariffs on steel and aluminum, the Administration mentioned possible limits on visas to Chinese students as part of the overall tariff plan to be announced later this month. Such action would damage one of the few American exports, education, where the US enjoys a trade surplus. Chinese students represent one third of the 1.1 million foreign students attending US universities, spending $39.4 billion in tuition alone.
Economic reports were mostly below forecast:
- Retail Sales was -0.1%; even accounting for a +0.2% revision to January it appears tax cuts are not helping the nation’s retailers, yet.
- Producer Price Index came in as expected at 0.2%, 2.5% y/y
- Housing Starts were below consensus, declining 7%, dragged down by a 21% drop in Multi-Family construction
- Industrial Production at 1.1% came in much stronger than its 0.4% consensus forecast
The Week Ahead – will focus on Wednesday’s conclusion of the Federal Open Market Committee meeting, with light US Treasury issuance, and some individual Fed speak on Friday
Monday – Treasury auctions $96 billion in short-term Bills
Wednesday – the FOMC meeting concludes with a 2:00PM Eastern Announcement and Forecast, followed by Jerome Powell’s first press conference as Fed Chairman at 2:30 PM Eastern
Thursday – Treasury auctions $11 billion 10-year TIPS (Treasury Inflation Protected Securities), currently yielding 0.76%
Friday – Durable Goods expected to show an increase of 1.7%, rebounding from January’s -3.7% report
March 12, 2018
Reversal
Equities recovered, as seen in this WSJ chart, as President Trump modified his tariff proposals to possibly exempt key US allies. Additional strength was provided by an upbeat jobs report that had no reservations and helped the S&P 500 improve by 3.5% on the week.

The Non-Farm Payroll number of 313,000 was significantly above consensus, with the Unemployment Rate holding at a 17-year low of 4.1%.
- Wage growth did soften m/m but is still a respectable 2.6% and supports the Fed’s gradual approach to interest rate increases
- Construction companies hired 60,000 for the biggest increase in 11-years
- December and January were revised upward by 56,000
- The 3-month average is 242,000 vs. 182,000 in the year-ago period
The report supports the Fed’s proposed plan for three-rate hikes in 2018, with the first of them expected to be at the conclusion of this month’s meeting on March 21.
Treasury prices had little movement with SBA 504 pricing on Thursday showing a slight improvement in the 20-year debenture rate at 3.20%, and the ten-year debenture rate identified this year’s move higher as it was priced at 3.0%, 45bps higher than in January. This was the first time since January 2010 that this series was priced ≥3%.

Corporate bonds were in the news as CVS sold $4 billion in debt to fund its purchase of Aetna. It was the third largest corporate issue in history, represented by 9 bonds that may face mandatory redemptions if the deal does not close by mid-2019. Other corporate bond news was supplied by the ECB, which dropped its pledge to accelerate its €30 billion a month purchase program if the region’s economy softens. The bank had already trimmed its government bond purchases which are expected to end in September. In its policy statement, the bank held its financing rate unchanged at 0%.
The Week Ahead
Treasury will sell $158 billion in debt, no Fed speak during this blackout period leading up the March 20-21 meeting, and a few economic reports. Interest will focus on the bid to cover ratio for the Treasury auctions, which is at the lowest level for the ten-year series since 2009. This gauge reflects the number of bids submitted vs. the amount sold.
Monday – Treasury sells $96 billion in short-term Bills, $28 billion three-year notes, and $21 billion ten-year notes
Tuesday – Treasury sells $13 billion thirty-year bonds and the FOMC meeting commences
Wednesday –Producer Price Index expected to be 0.2%, 03% ex food & energy and 2.2% y/y. Retail Sales projected to be 0.4%.
Friday – Industrial Production expected to be 0.3% with Capacity Utilization forecast to increase to 77.7%
March 5, 2018
Trump’s Tweets and Tariffs
It was an interesting week that saw economic reports come in mostly as expected, hawkish testimony from the new Fed Chairman, and the President’s call for tariffs that left the DJIA lower by 4% w/w.

Durable Goods was weaker than forecast at -3.7%; 4Q17 GDP was revised lower to 2.5% as forecast, and core PCE was unchanged at +1.5%.
In his Senate testimony, Jerome Powell hinted at a faster pace of interest rate increases saying the economy has been stronger this year than expected and the Committee would proceed with gradual rate increases to avoid an “overheated economy.” The initial market reactions were to reverse a gain in stocks, send Treasury prices lower, and strengthen the US$. Mr. Powell expects more wage gains this year as the labor market continues to tighten, identified price stability being at the heart of what the FOMC does, and hinted at four rate hikes in 2018, cautioning they would be gradual. That is one more increase than has been identified and set the tone for the rest of the week.
There was nothing gradual though about how equity exchanges traded, with the DJIA reacting sharply to presidential comments about a 25% tariff on steel imports and 10% on aluminum.

Analysts cautioned about starting a trade war that would weaken the President’s business agenda, resulting in job losses. James Bianco, of Bianco Research, identified concern about inflation and an end to what has been an uninterrupted stream of stimulus by central banks, issues that will be aggravated by the tariff talk. Bianco went on to say, “we’re emotionally spent with Trump, we’ve thrown so many shoes at the TV, we’re about out of shoes.”
The Week Ahead
We can look forward to a lot of Fed speak, short-term Treasury Bill auctions, the SBA 504 program pricing its March debenture sales, and Non-Farm Payroll.
Monday – Treasury auctions $96 billion of short-term T Bills
Thursday – DCPC 10B and 20C are priced. Benchmark Treasury yield is opening today close to unchanged from February
Friday – Non-Farm Payroll expected to be around 205,000, with the Unemployment Rate declining to 4.0%, and average hourly earnings at 0.2%, 2.9% y/y
February 26, 2018
Reduced Volatility
The rates market survived a turbulent week as Treasury auctions were met with tepid demand and the minutes of the FOMC's January 31 meeting were released, signaling the Committee's growing confidence in the economy. Three rate hikes remain in their plans for 2018, with the first expected at the conclusion of their March 20-21 meeting. This WSJ chart shows the 504-program's benchmark Treasury yield closing Friday after the market digested $258 billion in US Treasury auctions at the same level where 2018-20B was priced on February 8.

Also, on Friday the Fed released its semi-annual monetary policy report to Congress, identifying equity prices as still being elevated and offering comment on the recent wage growth report that sparked a rise in Treasury yields. The report said the Fed continues to view wage growth as moderate because it is likely held down in part by the weak pace of productivity growth.
All Eyes on New Fed Chairman
The new Fed Chairman Jerome Powell will testify before Congress as part of this report and while it is expected for him to maintain policy gradualism the markets will be on guard for any deviation from that stance.
Rising Inflation
There are several reasons why expectations are growing for higher inflation readings: Producer Prices have been reported as growing at 2.5% (a cost that is soon to be passed on to consumers), weak readings from last March & April will soon drop off the y/y calculation, and the larger than expected Government spending plan announced after the Fed's last meeting is viewed as potentially spurring stronger economic growth. No change in the Fed's preferred inflation gauge, Personal Consumption Expenditures, is expected this week, leaving it at 1.5% y/y.
It's Not Just Inflation
Part of the recent concern, other than the wage growth increase, has been infrastructure spending in excess of the previously mentioned spending plan, which would increase the need for Treasury to issue more debt, and that supply could pressure rates to move higher.
The Week Ahead
The market gets relief form Treasury supply, it will closely analyze Chairman Powell's testimony, and also look for any surprise in Wednesday's inflation report. There is plenty of Fed speak, only short-term Treasury Bill auctions, and some important economic releases.
Tuesday - Durable Goods report, expected to be -2.0%. Jerome Powell appears before the House Committee on Financial Services
Wednesday - GDP, the second estimate for 4Q17 GDP expected to be revised down to 2.5%
Thursday - Personal Income & Outlays expected to show a gain of 0.3%. The Personal Consumption Expenditures release for core prices is forecast as 0.3% ex food & energy, 1.5% y/y. Jerome Powell appears before the Senate Finance Committee
February 20, 2018
Reduced Volatility
After renewed fears of inflation roiled the markets in previous weeks, bonds stabilized and equities recovered, with the S&P 500 Index gaining 5.8% in five-days. These improvements were from a four-year high in Treasury rates and a 10% correction in equities. One sector of the S&P 500 that lagged behind was energy, an area that was subject to volatile cruse oil prices, and an example of why inflation gauges are measured ex food & energy.

The report that spurred inflation fears was a 2.9% gain in wages two-weeks ago, yet the two inflation reports last week did little to increase that fear.
Consumer Price Index showed a 0.5% gain, 0.3% ex food & energy m/m and 1.8% y/y. Producer Price Index was 0.4%, and also 0.4% ex food & energy m/m and 2.2% y/y. What this disparity might represent is an inability for wholesale costs to be passed on to consumers. The Fed’s key inflation gauge is Personal Consumption Expenditures which was last reported to be 1.5% y/y ex food & energy. Its next report is scheduled for March 1 and that rate is expected to be unchanged.
Other economic reports last week included Industrial Production, which was lower than forecast at -0.1%, with the previous month’s initial strong report of 0.9% revised down by 0.4%.
The rally in Treasury prices was well under way when a Friday report identified a quote from Mark Kiesel, global credit investment officer at PIMCO, “We think most of the backup in rates is over.” A factor in that statement is the belief that inflation will not exceed 2.0% and the Fed may lift rates no more than twice this year.
With the official Fed Funds rate now pegged to 1.38% and US Treasuries yielding from 2.19% in two-years to 2.88% in ten-years, and global sovereign debt yielding significantly less, the rates market may be properly priced. All of that could change if the proposed infrastructure spending plans were to be approved.
The Week Ahead
Fed speak, a lot of Treasury debt, $2.5 billion MBS, and FOMC minutes from the January 31 meeting. Treasury will sell $151 billion in short-term Bills, $28 billion two-year Notes, $15 billion two-year Floating Rate Notes, $35 billion five-year Notes, and $29 billion seven-year Notes. Freddie Mac will sell $1.2 billion 10-year MBS and $1.2 billion 10-year Floating Rate Notes.
Wednesday – minutes of the FOMC’s January meeting will be released
February 12, 2018
Volatility
A word that was rarely mentioned during the steady, nine-year up trade in Equities became the most common word used by analysts last week.

Friday’s eventual correction allowed the DJIA to bounce from an indicated correction level for the recent bull market, but the index still closed down 5.2% on the week. The concern than originated with the 2.9% wage growth report had been confined to the rates market, causing the ten-year rate to increase as high as 2.88%, while causing some weakness in equities. That changed quickly, spurring investors to pull $33 billion from equity funds through Wednesday, a contributing factor for the Dow to swing 1,000 points in all but one-day last week.
Not only did that violent price action push the VIX (the Chicago Board Option Exchange’s “fear index”) to a high level, it triggered a powerful trade in an inverse volatility product that allowed traders to short the VIX, a popular trade that had made traders complacent about volatility. When VIX spiked higher it forced traders with short positions in volatility to cover, pushing VIX higher still and putting more pressure on stock prices. The largest short volatility trading platform, run by Credit Suisse and known as XIV, was forced to shut down on Monday. To show how profitable it had been to short volatility, if you bought this index at the start of 2015 and held it the end of the 2017, you generated a 320% profit. When measured through Monday, the result was a total loss of 85%.

Attention is also being focused on the potential impact of the increased deficit caused by the tax cuts and potential infrastructure spending, joined by the recent budget agreement that postponed a government shutdown. This will result in a $1.2 trillion deficit in FY19, prompting Mark Zandi of Moody Analytics to comment: “This is exactly opposite of what the economic textbooks say lawmakers should be doing in a full employment economy.” President Trump’s spending plan on this is scheduled for release today.
This last chart from the NY Times identifies the market’s concern for the projected amount of debt needing to be financed, compared with its status prior to the financial crisis in 2008, and illustrates how limited the Fed may be to resolve a future crisis.

What has been the impact of five rate hikes by the Fed, the end of Quantitative Easing, and an improving economy on 504 debenture pricing? This table charts the change from February 2014.

The 504 program has benefitted from these historically low Treasury rates, even more so in 2012 when 20L was priced at 1.93%. One comparison that stands out is 2018-20B was priced 1bps lower than 2014-20B with the Treasury benchmark 18bps higher in rate. Swap spreads have tightened, as has DCPC pricing spreads to the Treasury benchmark, reflecting strong demand for a high-quality asset.
The Week Ahead – besides anxiety, has short-term Treasury Bill auctions, some Fed speak, and some inflation reports mid-week that can provide more insight on inflation.
Monday – The Administration’s spending plan is released.
Wednesday – Consumer Price Index expected to be 0.2%, ex food & energy; 1.7% y/y; Retail Sales forecast to be 0.3%.
Thursday – Producer Price Index 0.2%, ex food & energy, 2.3% y/y; Industrial Production expected to be 0.2%
February 5, 2018
Broad Selloff
Even though Monday’s Personal Consumption Expenditures report came in below consensus at 1.5% y/y, Friday’s jobs report showing a 2.9% gain for wage growth, accelerated down trades in Equities and Bonds. Also affected was the CBOE Volatility (Fear) Index which spiked higher.

The market has been primed to expect more rate hikes from the Fed this year, so a move to higher rates was expected, but not this sudden. The slow-motion trend of January showed increased momentum early in the week, culminating in Friday’s more volatile price action.
On Wednesday, at Janet Yellen’s final press conference, the word “further” was added to existing commentary about gradual rate increases. Adding to this theme, former Fed Chair Alan Greenspan was quoted as saying: “We’re working obviously, toward a major increase in long-term interest rates, and that has a very important impact on the whole structure of the economy. There are two bubbles; we have a stock market bubble and a bond market bubble.” He attributes this to significant increases in debt. With the increased federal deficit due to tax cuts, and the anticipated increased spending for infrastructure, US debt will increase even more, increasing the need for Treasury to finance that debt.
Ignoring elevated P/E ratios, the strong equity market performance prompted investors to pour $25.7 billion into the market in the week ending January 31, bringing the total to $102 billion for the month. Adding to market nervousness, on Thursday a Bank of America Bull/Bear indicator was reported calling for a 4.8% correction in the S&P 500 Index by the end of the first quarter. Friday’s decline for the index was 2.1% and global equity markets are lower this morning.
The bond market selloff was global, but proportionately and for different reasons. The US market is responding to hints of inflation and more supply while European markets are weakening due to improved economic growth as they are earlier in their recovery. Japan is a different case because of continued central bank purchases of its debt and inflation that is barely 1%. The comparison below shows how cheap US debt remains vs. other sovereign issuers, so coupled with a weak US$, Treasury debt should still attract foreign demand. Here is a comparison of 10-year sovereign rates:
2.84% - USA
0.77% - Germany
0.09% - Japan
The Week Ahead
With the end of the FOMC meeting Fed speak resumes, plus the Treasury’s quarterly refunding, in addition to $116 billion short-term Bills, and the 504 program’s February debenture sale. Economic reports are minor and few.
Tuesday – Treasury auctions $26 billion three-year Notes
Wednesday – Treasury auctions $24 billion ten-year Notes
Thursday – Treasury auctions $16 billion thirty-year Bonds and the 504 program prices its February 20-year debenture sale. At 2.84%, the benchmark ten-year Note is 28 bps higher than when 2018-20A was priced
January 29, 2018
Flat
Treasury rates ended the week where they started, after a failed rally on Thursday. They are captive to the equity euphoria and increased confidence that it may continue.
The Treasury curve, as measured by the spread between the 2 and 10-year maturities, continues to flatten; closing at +54.4 bps on Friday, 5 bps flatter than when 2018-20A was priced on January 11.

US equities on Friday had their strongest one-day gain in eleven-months, and the S&P 500 Index is experiencing its strongest January since 1987. That 4Q17 GDP came in below estimates didn’t stop the index from gaining 1.18% because the market appreciates the 2.6% annualized gain as being solid and the strong Durable Goods number was encouraging.
The Week in Review
Durable Goods came in above consensus at 2.9%, led by aircraft and vehicles
GDP was below forecast at 2.6%, but with a strong 3.8% increase in consumer spending
The Week Ahead
Has no Fed speak until the conclusion of this month’s FOMC meeting, and just $110 billion in Treasury Bill auctions on the calendar, with the Quarterly Refunding announcement on Wednesday, to take place during our February debenture sale.
Tuesday – Personal Income & Outlays projected to be 0.3%, with the Fed’s preferred inflation indicator, Personal Consumption Expenditures, forecast to be 1.6%, ex food & energy. FOMC meeting begins.
Wednesday – FOMC meeting concludes with an official announcement at 2:00. No policy change is expected at Janet Yellen’s final meeting.
Thursday – Institute of Supply Management report is expected to show a decline to 58.7.
Friday – Non-Farm Payroll is expected to be 176,000, and Factory Orders should show a gain of 1.5%, based on the 2.9% Durable Goods report.
January 22, 2018
Momentum – (n.) a force of speed or movement.
An apt description of the rising rate sentiment this year as Treasuries continue a slow-motion move to higher rates. Aiding this move are:
- Stronger commodity prices, with West Texas crude at $64, a three-year high
- Talk of the European Central Bank getting closer to ending its Quantitative Easing program; now buying €30 billion bonds monthly, half the amount of previous purchases
- Bank of Canada raised its short-term lending rate
- Two-year Treasury yield hitting 2.07%, its highest rate since 2008, in anticipation of continued Fed rate hikes
- Continued weakness of US$, down 10% last year (and at a three-year low) against a basket of world trading partner currencies
- Repatriation of off-shore profits could result in foreign selling of US Treasuries, with less future demand as companies use that money to pay taxes and invest in share buybacks. Approximately $3.1 trillion is held overseas with about $500 billion held in Treasuries and Corporate bonds

The Week in Review
Industrial Production came in stronger than expected at 0.8%, and the threatened Government shutdown became a partial reality Friday night.
Government Shutdown – a slow-motion shutdown where there has been a partial closing of most government offices. Another vote is scheduled for noon today, but its objective is to temporarily fund the government for just three weeks.
The Week Ahead
Treasury has approximately half of its personnel in office as it is scheduled to auction $193 billion of debt, $90 billion of it in short-term Bills. If the shutdown continues in effect, then many economic reports will be delayed.
Monday - $90 billion 13 and 26-week Bills are auctioned
Tuesday – Treasury auctions $26 billion two-year Notes
Wednesday – Treasury auctions $34 billion five-year Notes and $15 billion two-year Floating Rate Notes
Thursday – Treasury auctions $28 billion seven-year Notes
Friday – Durable Goods forecast to be 0.8%, continuing recent strength; 4Q17 GDP first estimate, expected to be 2.9%, lower than the previous quarter’s 3.2% number
January 16, 2018
Trends Continue
Stocks continue to set record highs and Treasury yields continue to rise. The benchmark ten-year Note closed the week at 2.55%, up 14 bps since year-end and that level triggered comment from Bill Gross, founder of PIMCO, to declare we are in a bear market. After being challenged, Mr. Gross modified his comment by saying he thought ten-year Treasuries could reach 2.70% by December, but did say the 35-year bull market is over.

His comment did trigger several pro and con articles on the topic. Two of them were in the Financial Times and offered strong support for both arguments.
“Is the Bull Run Over” stated the year-to-date weakness and referenced Mr. Gross’ call. Some of the points it made to reinforce that view are:
- A shift in central bank policy to tighter money
- The Fed has already begin reducing Balance Sheet, reinvesting less money
- The European Central Bank has cut bond buying by half, to €30 billion per month
- The Bank of Japan’s purchase of long dated bonds has slowed
- New issue supply of sovereign debt is increasing
- The market might be underestimating the impact of the tax stimulus
- Inflation data is rising, though still below target
“Don’t Bet on Higher Treasury Yields Yet” referenced calls for higher yields. When the Brexit vote took place in 2016, CT-10 was yielding 1.36% and it has almost doubled since then, to 2.55%, but is only about 1% higher, to a level that is not very high.
- Regardless of unsubstantiated headlines that China might reduce its purchases of Treasury debt, China and Japan hold their currency reserves in US$, almost one-half of outstanding Treasury debt. If they are to sell some of their holdings, what alternative, liquid market can they turn to?
- The tax cuts mostly benefit companies who have lesser impact than consumers, even though some employees are receiving bonuses and wage increases
- Wage growth is static
- Headline Unemployment remains at a low 4.1%, but 18% of men between 18 and 31 without a college degree did not work last year. That pool of workers can easily accommodate increased demand without pressuring wages. The equivalent figure for the worst years of the 1980’s recession was 6%.
So, maybe we have finished this bull run but rate increases are projected to be gradual and if Mr. Gross and others are correct, another 15 bps over the next 12-months seems pretty tame. Of course, that assumes no spike in inflation and central banks maintain their support.
The Week in Review
Indicators came in near consensus.
PPI was -0.1% and 2.3% y/y ex food & energy
CPI came in 0.3% and 1.8% y/y ex food & energy
Retail Sales was 0.4%, reflecting a good, not great, holiday shopping season
The Week Ahead
There is Fed speak, short-term Treasury Bills, and January debenture sales for the 504-program fund on Wednesday.
Tuesday - $155 billion short-term Bills are auctioned
Wednesday – Industrial Production expected to be solid at 0.4%; 2018-10A and 20A fund
Thursday – Treasury auctions $13 billion of ten-year TIPS (Treasury Inflations Protected Securities) currently yielding 0.52%, a product that has seen renewed interest lately. This level, compared to the 2.55% CT-10 yield, represents a breakeven rate in excess of 2%, which triggered additional bearish sentiment.
January 8, 2018
It’s All About Equities
Low interest rates, low inflation, global growth, and strong earnings have created a perfect storm for stocks; and longer-term bonds have done pretty well, too.

DJIA is off to its best start since 2003, closing at 25,295 after a 0.9% gain on Friday while Treasury rates have crept higher since mid-December, but are still relatively unchanged in the ten-year sector Y/Y.

The Week in Review
Two events were of primary interest: Wednesday’s release of the minutes from the December FOMC meeting and Friday’s Non-Farm Payroll Report.
The minutes proved to be inconsequential with the vote to raise rates being 7-2, with dissidents citing low inflation as the reason for their dissent. The next meeting is January 30-31 and no rate hike is expected. The Committee also indicated they are uncertain as to the economic impact of recent tax cuts. Three more rate increases are on schedule for 2018 and factors like the Fed’s reinvestment of portfolio proceeds, a bigger than expected deficit, and infrastructure spending that will require more Treasury financing will all impact supply and the shape of the Treasury curve.
Friday’s jobs report came in at 146,000, far below consensus, but if coupled with November’s gain of 252,000 it is clear that job growth is on track. Affirming that comment is the annual gain of 2.1 million which represents the seventh consecutive year of yearly gains of 2 million or more.
The Week Ahead
Fed speak resumes, Treasury to auction $146 billion, including $90 billion in short-term T-Bills early in the week, plus some end of week economic reports. Additionally, the 504 program sells its first debentures in 2018.
Tuesday – Treasury auctions $24 billion three-year Notes
Wednesday – Treasury auctions $20 billion ten-year Notes
Thursday – Treasury auctions $12 billion thirty-year Bonds and the 504 program prices its first ten and twenty-year debentures of the year
Friday – CPI expected to be +0.1%, +0.2% ex food & energy which is +1.7% y/y; Retail Sales expected to be +0.5% after November’s +0.8% report
January 2, 2018
Peaks and Valleys
Were what the ten-year Treasury reached before ending 2017 3 bps lower then where it began the year, even after three rate increases by the Federal Open Market Committee.

The Year-to-date change (or little change) in CT-10 was the result of the Treasury curve flattening, as longer-term rates barely budged while the Fed raised short-term rates by 75 bps.
| Period | Avg. 20-year Debenture % | Avg. CT-10 Yield | Total # of Debentures | Total $ Amount of Debentures |
| 2017 | 2.83% | 2.33% | 5,236 | $3,953,646,000 |
| 2016 | 2.33% | 1.80% | 4,956 | $3,643,170,000 |
Year over year, the program saw a 5% increase in the amount of loans, with an 8% increase in dollars funded, while 20-year debenture rates increased by 50 bps.
While it is normal to expect both 20-year debenture and ten-year Treasury rates to increase as the Fed tightens, much of the move was a market reaction to the 2016 Presidential election before the three rate hikes took place in 2017. The week prior to Donald Trump’s victory (and before a December 2016 rate increase), ten-year rates were 1.74%, spiking as high as 2.56% in 1Q17 in anticipation of tax reform, increased infrastructure spending, and a tighter monetary policy by the central bank. A reversal of that move took place through the summer, ending in September when it became clear that some sort of tax package would be passed. The Fed will maintain its tighter policy and infrastructure spending will be pursued; what remains to be seen is what shape the Treasury curve will assume.

The Year Ahead
What we do know about Fed policy is there should be little change to what has been announced:
- Three more rate increases in 2018, raising the overnight Fed Funds rate to 2.125%
- More potential yield curve flattening as the Fed continues raising rates and Treasury intends to focus increased funding needs at the front-end of the curve
- Continuation of the bank’s Balance Sheet reduction, begun in October 2017 at $10 billion per month and increasing on a quarterly basis. (These two items, increased Treasury financing needs to fund the added deficit resulting from tax cuts, and removal of the Fed as a buyer of Treasury and Mortgage-Backed securities, will also influence rates and the shape of the curve.)
This Financial Times chart shows how the Fed proposes to shrink its $4.5 trillion Balance Sheet, with a formula that will cap the monthly reduction of securities, meaning they could be occasional buyers of Treasury debt. The plan is to reduce the portfolio by 11% per year, over the next five-years.

The Week Ahead
Wednesday – Institute of Supply Management report, expected to be 58.2; Construction spending at +1.4%; release of minutes of the December 13 FOMC meeting
Friday – Non-Farm Payroll expected to be +228,000 with the Unemployment Rate remaining at 4.1%; Factory Orders projected to be -0.1%; Eurozone inflation data is released, expected to be +1.5%
December 18, 2017
It was no surprise that the FOMC raised short-term rates by 25bps on Wednesday, creating a new band of 1.25-1.50% that further flattened the US Treasury curve (short-term rates rose while longer-term rates did not). This Financial Times chart illustrates the trend back to the financial market collapse, leaving the spread at +51bps on Friday.

Along with cash rich investors seeking quality assets, this reshaping of the Treasury curve has benefitted small business borrowers using the SBA 504 program. With interest rate hikes of 100-bps dating to December 2016, here is a scorecard of rates and spreads.

Expectations are for the FOMC to raise rates three-times in 2018 and many analysts believe the curve may flatten further. While that has been beneficial for 504 borrowers, there could be a point where pricing spreads may widen due to the technically expensive benchmark Treasury.
At her final press conference on Wednesday, Janet Yellen laid out the Committee’s expected path for year-end short-term rates:
2018 - 2.1%
2019- 2.7%
2020 – 3.1%
She also expects “some market lift” to GDP growth from the proposed tax changes.
The Week in Review – on economic releases.
PPI – came in 0.4%, and 3.1% y/y. Ex food & energy it is 0.3% and 2.4%
CPI – was 0.4% and 2.2% y/y. Ex food & energy it is 0.1% and 1.7%
Industrial Production – came in below forecast at 0.2% but October was revised up to 1.2% from 0.9%
The Week Ahead – has little Fed speak and some economic releases late in the week.
Thursday – 3Q GDP expected to be unchanged at 3.3%.
Treasury auctions $14 bln of 5-year TIPS, plus the weekly T-Bill supply
Friday - Durable Goods forecast at 2.0% after October’s -1.2%
Personal Income & Outlays – contains the Fed’s preferred inflation indicator, Personal
Consumption Expenditures, whose core rate is expected to be 0.1%, and 1.5% y/y
There will be no Commentary next week, next posting will be January 2.

December 11, 2017
The Week in Review
The SBA 504 program continued to fund near historically low rates and pricing spreads to US Treasury debt, even with expectations of another interest rate hike this week. On Thursday, SBAP 2017-20L was priced at 2.78%, and an ongoing Effective Rate for small business borrowers of 4.50%. The chart below shows how this debenture series has been priced over the last five-years.

The high rate in this series was an after effect of the Ben Bernanke “taper tantrum” that rocked the rates market in 2013, more than 2-years before the Fed’s first-rate hike. The range of Pricing Spread to benchmark Treasuries is fairly well contained at +41-60 bps, and is a function of supply/demand and market sentiment. Historically, the tightest spread was in January 2013 (Quantitative Easing program) at +23 bps and the widest spread was in December 2008 (financial market collapse) at +348 bps. I mention that simply to recognize how volatility can impact markets.
The significant economic release last week was the Non-Farm Payroll report of 228,000 job gains, well above forecast, that maintained the Unemployment Rate at 4.1%, holding this rate at its lowest level in 17-years.

Even that had little impact on benchmark Treasury rates, with CT-10 ending at 2.37% on Friday and equity indexes hitting record levels. S&P 500 was up just 0.1% on the week, but financial stocks were better by 1.5%, buoyed by the jobs report and this week’s projected rate increase.
The Week Ahead – no Fed speak, other than Wednesday, $68 billion of term Treasury debt, and some economic releases.
Monday – the usual T-Bill auctions plus $44 billion of three-year and ten-year debt
Tuesday - $24 billion auction of thirty-year debt and PPI, expected to be 0.3%
Wednesday – the FOMC announcement and forecast. A 25-bps increase is expected
Thursday – Retail Sales forecast to be 0.3%, lower than the previous month’s spike from the hurricane season
Friday – Industrial Production expected to be 0.3%, showing recovery from the hurricane season
December 4, 2017
At Last!
After eleven-months of posturing and negotiating, the Administration achieved a sweeping tax change that propelled equity markets to new, record highs. Its performance did lag a bit on Friday after Michael Flynn pleaded guilty to lying to the FBI and that promises to ensure continued drama over the Russian probe being conducted by a special prosecutor. Equities are expected to remain well bid because of the proposed tax cuts, in particular, the reduction of the corporate tax rate to 20%.

While that guilty plea, and its implication of additional charges, did soften equity prices Friday, it helped rates recover to close the week just 2 bps higher than when we priced 2017-20K on November 9. That is a strong indication of how stable long-term rates have been, with the rates curve (2/10’s) flattening from +125 bps twelve-months ago, to +70 bps when 20K was priced, and to close at +60 bps on Friday. To be sure, there will be pressure on that sector of the curve, but if the projections are correct it will move less than the front-end.
Here is the Year-to-Date chart from the WSJ, showing CT-10 is trading exactly where it began the year, after two-rate increases this year, with one more expected next week.

Regarding the rates curve, in addition to some analysts calling for it to be totally flay in 2018, St. Louis FRB President James Bullard cautioned about the possible risk of a curve inversion if the Fed continues to raise short-term interest rates as fast as has been projected. If so, that would mean the 2/10’s curve would be at a negative spread from its current +60 bps level. Earlier in the week, Janet Yellen said the Fed would continue with its path of gradual increases because the economy is performing mostly in line with expectations.
The Week in Review
There was the usual mix of good news, bad news. The good news was 3Q17 GDP was revised up by .03 to 3.3%, the strongest quarter in three-years. The bad news was Y/Y PCE inflation came in at 1.4%, far below the Fed’s target of 2.0%.
The Week Ahead
There are weekly T-Bill auctions, a lot of Fed speak, about $1.7 billion CMBS sales, the 504 program’s 20-year December sale, and Employment data.
Thursday – SBA 504 program sells its December 20-year debenture.
Friday – Non-Farm Payroll expected to be +185,000 after gains of 261,000 in October and just 18,000 in the storm ravaged September
November 27, 2017
Unchanged – at least week over week. The rates market ended the week where it began, as economic reports were mixed, and the FOMC minutes that were released on Wednesday indicated officials believe inflation will remain below their 2% target. That said, the market assigns a 100% probability of a rate increase at the end of the December 12/13 meeting.

In a speech on Tuesday, according to a WSJ article, Janet Yellen stated she finds low inflation “more of a mystery,” saying she could not say that the Fed clearly understood its causes.
Late in the week economic reports from Europe softened prices as Eurozone jobs growth and new economic orders reached a 17-year high, with goods exports at record levels even as the € has appreciated 12% vs. the US$ this year.
Loan Extension - this Financial Times chart shows US banks have scaled up the proportion of long-term, fixed income lending, with the sharpest rise in assets that don’t mature for at least 15-years. That category now represents about 13% of the industry’s overall balance sheet.

The Week Ahead – has the weekly short-term Bill auctions, plus $88 billion of intermediate notes, and a lot of Fed speak.
Monday – Treasury auctions $60 billion of 2-year and 5-year notes
Tuesday – Treasury auctions $28 billion 7-year notes
Wednesday – second estimate of 3Q2017 GDP expected to increase to 3.3% from 3.0%. Janet Yellen testifies before the Congressional Joint Economic Committee
Thursday – Personal Income & Outlays includes the Fed’s preferred inflation gauge, Personal Consumption Expenditures, and it is expected to show a core rate of 0.1%, with the y/y rate at 1.4%
Friday – Institute of Supply Management is expected to reflect continued growth
November 20, 2017
It’s All About the Curve
The only monetary tool available to the Federal Reserve Bank is the overnight cost of funds (Fed Funds), and they have raised that four times since December 2015, pushing all short-term interest rates higher (except what you are paid on your Money Market deposits.) The current spread differential between the CT-2 and CT-10-year Treasury is +65bps. The week that the Fed began raising interest rates it was +125 bps, and this outperformance by the back-end of the Treasury curve is what has helped the 504 program continue to fund near all-time low rates.


While analysts continue to predict higher long-term rates because of growing global economic strength, the rates markets keep defying predictions.
Some market headlines this past week:
- Longer dated Treasury prices improve, while the front-end prepares for a December rate hike
- US$ weakness continues amid uncertain tax plan
- Equities have one good day, but drop on the week
- Oil recovers a bit as Saudi Arabia looks to organize more OPEC production cuts
- Gold demand hits an eight-year low, but its price continues to rise (up 12% y/y)
Fed speak remained mild with several central bankers agreeing that Forward Guidance will remain a policy tool. Economic releases, especially on inflation, came in as expected, with CPI registering a +1.8% gain y/y, ex food & energy. Retail Sales showed a +0.2% gain, greater than consensus and September was revised upward to +1.9%.
Part of the explanation for the improved Treasury prices is the uncertainty concerning the tax cuts, for which no definitive economic analysis has been provided. The market is skeptical of the bill’s passage which, if it did happen, would pressure rates because it is not revenue neutral and more Treasury debt would need to be funded.
The Week Ahead – is holiday shortened, with only release of the FOMC minutes on Wednesday, from their November 1 meeting, of interest.
November 13, 2017
Though the below chart shows CT-10 ending trading on Thursday because of the Veterans Day holiday, there was some trade activity on Friday that reflected growing concern over an uncertain Republican tax plan and optimistic growth reports from Europe. Those actions moved the benchmark rate to close at 2.40%, 6 bps above where the program priced 2017-20K on Thursday, and paused the eight-week rally in equities.

That debenture sale was very well received and allowed the program to tighten its pricing spread to the ten-year Treasury to +45nps, its tightest spread since February, and lowered its month-over-month debenture rate by 6bps, even though Treasury rates were unchanged. Another contributing factor in the pricing was the continued flattening of the Treasury curve, as measured by the changed yield spread between two and ten-year Treasuries. Since the 504 program’s October 5 debenture sale that spread tightened from 85 bps to 70 bps, meaning two-year Treasury yields increased 15bps while ten-year yields were unchanged. A move like that reflects market concern for additional rate hikes from the Fed (CT-2 ended the week at 1.66%, a new nine-year high), like the one that is expected at the conclusion of the December 12-13 meeting.
The ongoing Effective Rate for 20-year small business borrowers declined to 4.58%, 4 bps lower than its 12-month average, and just 33 bps above the Prime Rate. This cost of funds measurement will improve even more once the FY2018 guarantee fee is applied to processed loans.

Other Items in the Week in Review
The week was light on economic data, all the Fed speak was tame, and the Treasury saw strong demand for its quarterly refunding auctions.
The Week Ahead
There are the usual short-term T-Bill auctions, plus a 10-year TIPS sale, a lot of Fed speak, and some inflation data.
Monday – Treasury auctions $78 billion in 13 and 26-week Bills, and releases its Fy2018 budget
Tuesday – PPI is expected to show a 0.1% increase, 0.2% ex food & energy
Wednesday – CPI is released, and the consensus call is 0.1%, and also 0.2% ex food & energy. The y/y rate ex food & energy is 1.7%
Thursday – Industrial Production is expected to show a gain of 0.5%, Treasury auctions $11 billion 10-year Treasury Inflation Protected Securities
Friday – Housing Starts and Capacity Utilization, which should remain around 76%
November 7, 2017
More Jobs but less Wage Growth
And that translates into reduced inflation fears which helped Treasury prices move higher Friday, ending a week of solid gains and remaining below its 2.42% resistance level.
- The economy added 261,000 jobs in October and September’s negative report was revised to +18,000, thereby keeping intact the economy’s streak of job gains to a record 85 consecutive months
- The Unemployment Rate declined to 4.1%, its lowest level since October 2010
- Worker wages declined one cent to $26.53 an hour. This absence of wage growth is persistent and a contributing factor to the Fed’s favorite inflation gauge remaining below target
- The FOMC meeting concluded with no policy change, though a 25bps rate hike in December is virtually assured
- The Bank of England raised its base rate to 0.50%
- DJIA now sports a 19% gain, year-to-date
- President Trump nominated Jerome Powell to succeed Janet Yellin in February, as $2bln was added to total return bond funds for the largest weekly investment in almost two-years

The Week Ahead
There is renewed Fed Speak, multiple short-term Treasury Bill auctions, Treasury’s quarterly refunding, scheduled Freddie Mac sales of $2.3bln fixed-rate and floater MBS, and the SBA 504 program’s November debenture sales; with a light calendar for economic reports.
Tuesday – Treasury auctions $24bln three-year notes
Wednesday – Treasury auctions $23bln ten-year Notes, that are the benchmark for the 20-year DCPC to be priced Thursday
Thursday – Treasury auctions $15bln thirty-year binds and SBAP 2017-10F and 20K are priced. At 2.33%, CT-10 is exactly where it was when the October sale was priced; that can change before Thursday.
Friday – Treasury releases its expected FY2018 budget
October 30, 2017
The Week in Review
A week of strong reports was capped by Friday’s 3Q2017 GDP being 3.0%, despite the hurricanes that were expected to hold it down. In addition to it representing two consecutive quarters above 3%, it is the best six-month stretch in three years.

Earlier reports showed:
- Durable Goods orders were +2.2%, above consensus and +8.3% annually
- Equipment spending by business was +8.6% annually
- Purchasing Managers Index Composite Flash was 55.7, above consensus
- New Home Sales surged 18.9% to a 667,000-annual pace
Other developments might be characterized by initials:
ECB – Mario Draghi announced the central bank would buy less bonds, but for longer. The monthly purchase will decline by half, to €30 billion per month, but extend through September 2018, and possibly longer. This prompted renewed interest in European stocks.
SALT– State and Local Tax deductions might be lost to taxpayers. The House passed a $4 trillion budget, clearing the way to tax reform that is expected to create a $1.5 trillion shortfall that would need to be funded. These deductions are important to residents in high tax states and prompted several Republicans from New York, New Jersey and California to vote against it. The vote on the budget was just 216-212, a slim margin.
401(k) – like SALT, a reduced limit for deferred retirement savings would be a source of revenue to offset the tax cuts. By passing the budget with a simple majority vote, the tax bill must have no impact on the budget in ten years. That means to make it work the lawmakers need increased sources of revenue sooner rather than later, and one way might be to leave Roth IRA amounts unchanged. That would result in taxable contributions that are tax free later on.
DJIA – keeps on rolling; rising 33 points on Friday to show a year-to-date gain of 18.4%. Tech stocks reported better than expected earnings and Amazon rocketed to close at $1100 per share, gaining 126 points on the day.
Surprisingly, Friday’s strong GDP report did not add to fixed-rate weakness that existed leading up to the release. Rates had risen in response to previous economic releases and Treasury supply, closing above 2.40% for the first time in five months.

The Week Ahead- has short-term T-Bill supply, the Fed’s preferred inflation gauge, an FOMC announcement, and jobs data. Mortgage-backed securities size is relatively light, a $1.3 billion 7-year deal.
Monday – Personal Income & Outlays report contains the PCE report that is expected to be +0.4%, but just +0.1% ex food & energy. The annual rate is +1.4%, +1.3% ex food & energy. Though this rate remains well below the Fed’s inflation target, the Committee seems resigned to this level as long as economic reports show strength
Tuesday – Consumer Confidence is expected to remain high
Wednesday – Treasury announces its quarterly refunding auction terms for sale next week when the 504 program will price its November debentures; FOMC announcement at the conclusion of its 2-day meeting, where no change in policy is expected
Thursday – Fed speak commences now that the FOMC meeting is over
Friday – Non-Farm Payroll should rebound strongly from September’s hurricane affected report of -33,000. The consensus is for a gain of 323,000
October 23, 2017
The 2018 Budget Resolution – that was passed by the Senate late Thursday, impacted the rates market on Friday. Passage of the resolution may lead to a rewrite of the U.S. tax code which is expected to result in a $1.5 trillion reduction in projected future revenue. This shortfall would require Treasury to issue more debt, pressuring prices and raising rates, which is what the market perceived after last November’s election. That move to higher rates faltered once it became clear that tax cuts and infrastructure spending were not happening, and rates reversed much of the move. Now, with the Republican controlled Senate able to revise the tax code with a simple majority vote, the market is becoming more cautious.
Stocks like tax reform, bonds don’t. The DJIA closed at 23,328, extending the third longest bull market (starting in 2009) in the index’s history.

The pending December rate hike and the reduced reinvestment of proceeds by the Fed will also influence this bearish sentiment, though global demand for high quality assets should continue to modify any rise in rates.
The Week in Review – saw Industrial Production come in as expected at +0.3%, but with negative revisions to July, and August was revised to -0.7%. Existing Home Sales posted its first gain in 4-months in a market with limited supply, with median prices showing a 4.2% annual gain.
In Janet Yellen’s speech on Friday she said the economy has made “great strides” but that policy makers may not be able to raise short-term rates very far as the recovery proceeds. A Financial Times article quotes her saying: “The probability that short-term interest rates may need to be reduced to their effective lower bound at some point is uncomfortably high, even in the absence of a major financial and economic crisis.” Ms. Yellen mentioned the Committee only expects to raise the Federal Funds rate to 2.75% in coming years, leaving it little room to reduce rates, if needed. The current rate for overnight funds is a range of 1.0-1.25%. The MBS market saw strong demand for $2+ billion of floating-rate and fixed rate debt.
The Week Ahead - $78 billion in short-term Bills; $88 billion in fixed-rate Notes and a 2-year FRN. No Fed speak, as we enter the blackout period ahead of the October 31 meeting, where change in policy is expected. We also get an ECB announcement on Thursday.
Tuesday – Purchasing Managers Index is expected to show continued growth. Treasury auctions $26 billion 2-year Notes
Wednesday – Durable Goods expected to be +1.0%; New Home Sales may be impacted by recent hurricanes; and Treasury auctions $15 billion 2-year Floating Rate Notes
Thursday – Treasury auctions $28 billion 7-year Notes. Mario Draghi is expected to announce a tapering of the bank’s €60 billion monthly bond purchases.
Friday – GDP sees a 3Q2017 revision, expected to be revised down to 2.5% from 3.1%
October 16, 2017
The Treasury market was marking time in a holiday shortened week until Friday’s soft inflation data trumped a strong Retail Sales report. Additional support could be found in the President’s Executive Order to end subsidy payments to insurers under the Affordable Care Act. That may have contributed to Treasury strength but it definitely hurt health care companies, even as equity indexes set new record highs.
Our benchmark ten-year Treasury held its 200-day Moving Average level of 2.32% and now sits between there and a 2.23% resistance level.

Matching the decline in the ten-year yield was a further flattening of the yield curve as short-term rates held firm in anticipation of a probable rate hike in December. For the week, the 10-2 curve flattened 8 bps, and year-to-date it is flatter by 39bps.

The Week in Review - the FOMC minutes released on Wednesday showed a unanimous vote of 9-0 to begin normalization of the bank’s Balance Sheet by reducing its purchases by $10 billion this month. Ironically, that began on Friday as prices rallied.
CPI was +0.5%, propelled by a 13.1% gain in gas prices (the largest one-month gain since 2009). Food was up just 0.1% and ex food & energy the monthly gain was only +0.1%.
Retail Sales came in +1.6%, aided by car purchases to replace those damaged by Hurricanes Harvey & Irma. Ex gas and autos, the report was +0.5%. The damage to Puerto Rico and the US Virgin Islands was devastating but those territories are not included in most national level reports.
The Week Ahead – has much Fed speak, $78 billion in short-term Bill supply, and not much economic data.
Tuesday – Industrial Production expected to be +0.1% after a -0.9% report in August
Thursday - $5bln 30-year TIPS to be auctioned (currently yielding 0.87%)
Friday – Janet Yellen has a scheduled speech
October 10, 2017
Not Much Change – in rates, but Friday’s Non-Farm Payroll report was complex.

The US shed 33,000 jobs in September, the first negative report in seven-years, driven by two significant hurricanes that account for the headline number. Other significant items in the report were:
- Unemployment Rate dropped to 4.2%
- The number of Americans in the labor force increased to 63.1%
- Average wages increased 2.87% on an hourly basis
- Revisions decreased previous months’ reported gains
- The market sets a 92% probability of a December rate hike, so this payroll report is discounted, along with a below target inflation rate
The Week in Review – other than the jobs report, the item of most interest was SBAP 2017-20J being priced at 2.85%, just 3 bps higher than the December 2015 debenture sale that preceded four rate hikes by the Fed. We’ve seen the cost of funds increase by 100 bps but moderate global growth, low inflation, and global $ seeking high quality assets have held rates in check. That is poised to change with the Fed committed to its dot-plan for more rate increases and the normalization of its Balance Sheet, but if Chairwoman Yellen is correct, the change should be gradual.

The Week Ahead – a lot more Fed speak, short-term Bill auctions on Tuesday, and term supply later in the week.
Wednesday – Treasury auctions $24bln three-year Notes and $20bln ten-year Notes. Fed releases minutes of their September 20 meeting
Thursday – Treasury auctions $12bln thirty-year Bonds
Friday – CPI expected to be +0.6%, +2.3% Y/Y. Ex food & energy +0.2%, +1.8% Y/Y; and Retail Sales should be +1.9%, driven by strong auto sales as hurricane victims replace damaged cars
October 2, 2017
The Week in Review
- Signs of progress on a tax overhaul helped push Treasury yields higher; aided by heavy Treasury note supply. The benchmark ten-year Treasury closed the week at 2.33%, its 200-day Moving Average, as indicated in the WSJ chart below
- President Trump and Treasury Secretary Mnuchin interviewed two candidates for Chairman of the Federal Reserve Bank
- Signs of weak inflation still persist, but we have been cautioned that the Fed is resigned to this. Friday’s release of Personal Consumption Expenditures was +0.2%, +1.4% Y/Y. The core reading (ex food & energy), which is most important to the Fed, increased just 0.1%, and +1.3% Y/Y
- Eurozone inflation registered a 1.5% rate, also below expectations, and poses a dilemma for the ECB when it meets this month to discuss ending its bond buying program
- Durable Goods orders were +1.7%
- 2Q17 GDP was revised up to 3.1%, helped by a 3.3% increase in consumer spending
- West Texas Intermediate traded at $52.73, its highest level in five-months

As we approach this week’s sale of 2017-20J, the market fully expects another rate hike this year, almost certified by Janet Yellen’s speech last Tuesday when she said, “it would be imprudent to keep monetary policy on hold until inflation is back to 2%,” and that she is “wary of moving too gradually.” With that in mind, the market puts the likelihood of a December rate hike at 70%.
The Week Ahead – will be focused on headline news and Friday’s payroll report; has a lot of Fed speak, including Chairwoman Yellen, and Treasury supply of short-term Bills only.
Monday – PMI Manufacturing Index is expected to continue its moderate growth
Wednesday – Janet Yellen speaks in St. Louis on Community Banking in the 21st century
Thursday – 2017-20J is priced to fund on October 13
Friday – Non-Farm Payroll is expected to be very low, showing the effects of both Hurricane Harvey and Irma. The unemployment Rate is expected to be unchanged at 4.4%
September 25, 2017
The Week in Review – was highlighted by the FOMC meeting and press conference, and then heightened tension from North Korean dialogue.

As expected, there was no change in policy at this month’s meeting and there was confirmation the Fed would reduce its monthly Balance Sheet reinvestments by $10bln starting next month. The monthly caps will increase on a quarterly basis, scheduled to reach $50bln in October 2018.
Other points of interest from the meeting:
- The Committee looks for one more rate increase this year, probably December
- Three additional rate increases are projected for 2018, and two more in 2019
- A 2.4% GDP rate is projected for 2017 and 2018
- Fed revised down its core PCE inflation rate for this year to 1.5% from 1.7%. A 1.9% inflation rate is projected for year-end 2018, down from 2.0%
- Long-term projection for the Federal Funds rate is reduced to 2.75% from 3.0%
- The federal funds rate will remain the bank’s preferred tool to implement monetary policy
- Recent hurricanes are expected to disrupt upcoming economic indicators
Regarding inflation, the comment was - “if it’s recent softness doesn’t prove to be transitory,” the Fed could have to reassess its plans to raise interest rates at a gradual pace. With brick and mortar stores closing, and recent bankruptcies (Toys R Us), can improved pricing online explain some of how inflation’s muted increase is measured?
This Financial Times chart makes an interesting point – digital prices are declining faster for most products than as measured in the CPI.

The Week Ahead – a lot of Treasury supply with Fed speak scheduled for every day, including Janet Yellen discussing prospects for growth, on Tuesday
Monday – Treasury sells $78bln 3 and 6-month Bills
Tuesday – Treasury sells $26bln 2-year Notes
Wednesday – Treasury sells $34bln 5-year Notes and $13bln 2-year FRN’s
Thursday – Treasury sells $28bln 7-year Notes; third revision of 2QGDP expected to be 3.1%
Friday – Personal Income & Outlays expected to be +0.3%, with the Fed’s Personal Consumption Expenditures measure rising 0.3%, 1.5% y/y, and its core rising 0.2%, 1.4% y/y (slightly below the Fed’s revised projection)
September 18, 2017
Equities hit record highs and Bonds sold off from a broad improvement in risk appetite.
S&P 500 index gained 1.6% for the week and the benchmark ten-year Treasury sold off 15bps to close Friday at 2.20%, just below its 50-day Moving Average of 2.229%. This chart below identifies the Note’s six-month journey, revisiting its closing level from mid-April, two months before the Fed raised its overnight Fed Funds range to 1.25%.

These moves were helped by Hurricane Irma having a less severe impact than feared and North Korean threats generating less concern. This temperament was affirmed by performances on Friday after a terrorist attack in London that fortunately failed.
The week had its usual share of good and bad economic reports to go along with Central Banker commentary, but not from Fed officials as they prepare for this week’s meeting that includes a Summary of Economic Projections and a press conference with Janet Yellen. That meeting concludes on Wednesday and the Chairwoman’s press conference is at 2:30. While no change in policy is expected, the market is anxious to hear details about Balance Sheet normalization which is expected to begin shortly. The pace of reduction has been advertised as deliberate so the shock would be any acceleration to that schedule.
Wednesday’s release of the Producer Price Index came in lower than expected at +0.2%, with higher gasoline prices accounting for most of the increase. Ex food & energy, the gain was just +0.1%
Thursday’s release of the Consumer Price Index showed a gain of 0.4%, its biggest gain since January, giving the market cause for concern about increased inflation. Y/Y it shows a gain of +1.9%, with its core rate a bit lower at +1.7%. Adding to rate concerns was a comment by a Bank of England policy maker that “the central bank may need to raise interest rates in coming months.”
Both of those events weakened bond prices but Friday’s soft report for Retail Sales, -0.2%, stabilized prices.
The Week Ahead – has some short-term Bill auctions, housing data, the FOMC meeting, and then some Fed speak later in the week.
Monday – Treasury auctions $78bln three and six-month Bills
Tuesday – FOMC meeting begins
Wednesday – FOMC announcements and Forecasts are released at 2:00 and the press conference follows
Thursday – Leading Indicators expected to show a 0.2% gain, and Jobless Claims are announced
Friday – Purchasing Managers Index expected to show a decline
September 11, 2017
The Trend Continues – as Treasuries complete a two-month rally with the benchmark ten-year Note closing at its lowest yield since the election, and stocks ended two-weeks of gains.

North Korean tensions remained a major focus and was joined in the headlines by:
- President Trump joining with Democrats to add a three-month extension of the debt ceiling limit, moving the critical date to December 8
- The European Union economy grew at 0.6% in 2Q17 as concerns about the strength of the € may be weighing on exports
- Mario Draghi announced the bulk of Quantitative Easing decisions will occur in October, one-month after the Fed is expected to announce its balance sheet normalization
- Japan’s ten-year note (JGB) went negative for the first time in a year as the Bank of Japan affirmed its commitment to purchase ¥8 trillion of bonds this year, with the bank already holding 50% of government debt with maturities between 5-10 years
Stuck in Neutral – but it is good for small business borrowers. Since December 2015 the Fed has raised the Federal Funds rate 4-times, yet the benchmark Treasury and 20-year debenture rates are lower, with an improved pricing spread.

The 2017-20 I debenture sale was met with strong investor demand amidst this risk-off, safe haven trade that is a contributing factor to current rate levels. Another factor is the above-mentioned QE programs still in effect with the Fed poised to announce its balance sheet normalization later this month.
The Week Ahead – No Fed speak, as we are in the 2-week blackout period ahead of the September 19-20 meeting. In addition to Treasury supply, Fannie Mae and Freddie Mac both have deals out this week, so there could be some consolidation.
Monday – Treasury auctions $72bln short-term Bills and $24bln three-year Notes
Tuesday – Treasury auctions $20blm of a 52-week Bill and $20bln ten-year Note
Wednesday – PPI expected to be +0.3%, and Treasury auctions $12bln thirty-year Bonds
Friday – Retail Sales expected to be +0.1%, and Industrial Production also expected to be +0.1%
September 5, 2017
Choppy – would be a good word to describe performance in the Treasury market last week as political tensions gave way to strong economic data.

The ten-year rate touched a low of 2.08% on Tuesday after North Korea launched a missile that flew over Japan, reigniting a safe haven trade that generated strong foreign demand in the Treasury’s auctions, evidenced by a 2.5X subscription rate for Tuesday’s $34bln five-year note auction.
While Treasuries held their safe haven bid, gold gained 2.5% and equity markets like NASDAQ ended the week at a record high.
On Wednesday, the 2QGDP estimate was revised upward to 3.0%, with a usual push/pull dynamic:
- Strong consumer spending and business investment vs.
- A steeper pullback in spending by state & local governments
Friday’s Non-Farm Payroll report came in below estimates at +155,000 with the previous two-months’ number revised downward, the Unemployment Rate ticked up to 4.4%, and annual wage growth held firm at +2.5%.
The Institute of Supply Management report reached a six-year high in August, exceeding expectations. Manufacturers are also reporting higher prices for raw materials, hinting at growing inflation pressures. “This is probably pent-up demand over many, many years,” said Timothy Fiore, head of the ISM survey, in a WSJ article. And, the European Union reported a strong Purchasing Managers Index that continued the zone’s surprising success in 2017. Readings for France, Austria, and the Netherlands were at their highest levels in six-years, yet even this positive report reflects concern about the Euro currency’s 13% gain vs. US$ which could threaten the competitiveness of Euro zone exporters and put downward pressure on inflation.
Fears of a government shutdown eased a little after the White House removed its demand for $1.6bln to build the border wall as part of an increased debt ceiling. Additionally, the need to provide funding and assistance for Hurricane Harvey relief may insure the government staying open to provide that aid.
The Week Ahead – has Fed speak, T-Bill auctions and the 504 program’s September debenture sale.
Tuesday – Factory Orders expected to be -3.1% offset June’s +3.0%
Thursday – Productivity & Costs report is expected to be driven by 2Q GDP’s 3.0% report, with an upgrade in productivity and a downward revision for labor costs.
SBAP 2017 10E and 20I will be priced for settlement on Wednesday September 13. European Central Bank meeting is expected to deal with issues they have in common with the Fed – modest growth, with low inflation and a need to wean itself off its Quantitative Easing program.
August 28, 2017
The Week in Review – was dominated by political commentary and then Central Banker speeches.

The political commentary was from the White House on Tuesday when President Trump threatened to shut down the government if Congress did not approve some initial funding to build the proposed border wall. Talk of a government shutdown drives safe haven trades and weakens equities, and this was no exception; though the improvement in Treasury prices was muted because we are at such artificially low rates already. And not all Treasury prices improved; short-term T-Bills weakened as investors opted to avoid the uncertainty of the government paying its bills after October 1. This is a week in review and weeks ahead topic as both raising the debt ceiling and passing a budget for FY18 need to be addressed by the end of September.
Later in the week, Janet Yellen and Mario Draghi spoke at the Kansas City Fed’s Symposium and their comments were directed to financial stability, not rates, but did help the Treasury market hold its gains. In her speech, Ms. Yellen identified post-crisis rules as having made financial markets stronger, something the President disagrees with as he intends to reverse many of them in hopes of expanding the economy. With Ms. Yellen’s term expiring in February it will be interesting to see how strongly she continues to speak out on policy.
Mario Draghi followed Ms. Yellen and took aim at the President’s protectionist approach to trade, advocating free trade to boost global growth. Both bankers are faced with the challenge of winding down their Quantitative Easing programs but Ms. Yellen’s is complicated by a fractious political environment.
There is some doubt about the Fed’s planned December rate hike but implementation of Balance Sheet normalization seems to be on target for a September announcement. In a market fraught with political discourse, diminished liquidity, and the Fed reinvesting fewer proceeds from its portfolio, the market now has to wait out the debt ceiling and federal budget issues.
The Week Ahead – is light on Fed speak but contains 2Q GDP revision and NFP, plus several Treasury auctions.
Monday – Treasury auctions $26bln 2-year and $34bln 5-year Notes, in addition to $72bln 3 and 6-month Bills
Tuesday – Treasury auctions $28bln 7-year Notes, and four-week T Bills
Wednesday – second report for 2Q17 GDP expected to increase to +2.8%
Friday – Non-Farm Payroll for July is expected to be +180,000 with the Unemployment Rate remaining at 4.3%, and a possible improvement in wage growth; and with an early close to the market ahead of a holiday weekend.
August 21, 2017
Rates moved higher in response to strong economic reports like Retail Sales +0.6%, its sharpest increase this year; Japan posting an annualized GDP rate of 4.0% for 2Q17; and Amazon selling $16bln of debt to finance its purchase of Whole Foods. Then, events in Charlottesville, Barcelona, and Finland happened, sending rates lower as investors sought safe haven trades like Treasuries and gold. CT-10 closed the week at its 2.19% resistance level and awaits further news headlines that include contentious political oratory.

Wednesday’s release of minutes from the FOMC’s July 26 meeting identified a Committee split on the next rate increase as members struggle to understand why inflation has been so weak. Market sentiment has become skeptical of the planned December rate hike but is certain a September announcement is planned to announce Balance Sheet normalization.
The Fed’s holdings have increased from slightly less than $1tln bonds in 2008 to $4.5tln today, and the Financial Times chart below shows four central banks hold more than $14tln of debt. This concerted initiative has been a major factor in why global interest rates are so low, and identifies $9tln of the other banks’ holdings are at negative yields. That statistic, plus ongoing demand for safe haven securities, explains why US$ denominated debt has been such an attractive global asset.

The Week Ahead – some housing data and Fed speak, plus short-term Treasury auctions.
Monday – Treasury auctions $72bln of 3 and 6-month Bills
Tuesday – a yet to be determined amount of four-week Bills
Wednesday – Treasury auctions $13bln of a two-year Floating Rate Note
Thursday – The Kansas City Fed’s Jackson Hole Symposium meets
Friday – Durable Goods is expected to reverse the +6.5% report for June, and Janet Yellen speaks at Jackson Hole on financial stability
August 14, 2017
Fire & Fury begets a Safe Haven Trade – aided by weak inflation data.

Geopolitical threats gave the market a bid throughout the week, and were aided by strong demand for MBS and Treasury issuance, plus dovish inflation data. In addition to short-term Bills the Treasury sold 61% of its, three, ten and thirty-year securities ($62bln in total) to foreign buyers, with all auctions seeing good interest.
Producer Price Index, forecast to be +0.2% came in at -0.1%, reflecting weakening inflation pressure, and sits at +1.8% y/y, ex food & energy. PCE, the Fed’s preferred measure, is at +1.5% y/y.
SBAP 2017-20H was priced at 2.75%, its lowest rate since November and just 4bps above the twelve-month average rate. If nothing else, this identifies how range bound the market has been and what an excellent time it is for small businesses to lock in fixed-rate term money.
Adding to dovish inflation sentiment was NY Fed President William Dudley’s comment, that “it’s going to be some time” for headline inflation data to return to the bank’s 2.0% target. The week ended with a +0.1% release for July CPI, below the +0.2% consensus. Ex food & energy this measure shows +1.7% y/y.
Additional Fed speak from Dallas Fed President Kaplan, “wanting to see more evidence” that inflation is on track for 2.0% before supporting another rate increase this year helped reduce the market’s odds for that hike. Fed Funds futures (used to gauge the Fed’s rate policy) closed Friday with a 36% chance of an increase, down from 47% Thursday, and 54% a month ago.
Finally, safe haven trades end when headline news calms down so the bid for Treasuries can fade with normalization of talks on N. Korea, but the persistently low inflation readings have a more lasting impact. Even if the Fed doesn’t pursue a December rate hike it is likely to make a September announcement on reduced reinvestment of its balance sheet holdings. That too, is a form of tightening, and coupled with increased MBS issuance can be expected to put pressure on spread product.
The Week Ahead – has some Fed speak economic releases.
Tuesday – Retail Sales is expected to show strength after a -0.2% report for June
Wednesday – minutes of the July 26 FOMC meeting are released
Thursday – Industrial Production is expected to be +0.3% and Leading Indicators should continue to show strength
August 7, 2017
Inflation is proving an elusive target, but job growth remains strong

This Financial Times chart shows consistent growth in jobs post-recession, and a current Unemployment Rate of 4.3% that is tied for the lowest in sixteen-years. Other positive aspects of the report:
- 209,000 job growth is well above the 184,000-monthly average of the last twelve-months
- Wage growth is 2.5% y/y; historically low but higher than inflation
- Labor force participation rate inched up 0.1% to 62.9%
This report nudged Treasury rates higher after earlier reports in the week had moved them lower. Those reports were the Fed’s preferred inflation indicator, Personal Consumption Expenditures, with a core rate of +1.5%; and auto makers showing sharply lower sales in July, with GM reporting a 15% decline. At week’s end, the benchmark ten-year Treasury was unchanged on the week, at 2.27%, 11bps lower than when the program priced 2017-20G.
Of note, is how little some things have changed as the FOMC has raised rates 100bps since December 2015.
| Date | FF range | 5-year Note | 10-year Note | 20-year SBAP Spread |
|---|---|---|---|---|
| 12/16/2015 | 0-0.25% | 1.75% | 2.29% | +70bps |
| 8/04/2017 | 1.0-1.25% | 1.82% | 2.27% | +60bps |
Even with inflation remaining below target, the FOMC remains on track to commence shrinking its balance sheet and raising rates again by this year-end.
The Week Ahead – has a lot of Fed speak, with CMBS and Treasury supply, plus this month’s SBAP 2017-20H.
Monday – Treasury auctions $72bln short-term Bills
Tuesday - $24bln three-year Notes are auctioned
Wednesday - $23bln ten-year Notes are auctioned
Thursday – SBAP 2017-20H is priced, and $15bln thirty-year Bonds are auctioned
Friday – CPI is expected to +0.1% to +1.8% y/y
July 31, 2017
Where to Start?
Monday – the worst day for bonds since Mario Draghi’s comments on June 27. Euro yields sold off, which bled into US trading, and stocks rallied.
Tuesday – Health Care chaos as the Senate votes, with help from a John McCain aye and the vice president’s tie-breaking vote, to approve debate on repeal and replacement for the ACA.
Wednesday – UK reports 2Q17 GDP as +0.3%; announces that Libor will be phased out by 2020, joining the US which will discontinue its use next year. In addition to absorbing the Treasury’s auction sizes, Treasury prices fade with AT&T’s announcement of a $22.5 billion sale to finance its purchase of Time Warner Inc. An indication perhaps of how resigned portfolio managers are to this range bound market is found in the $63 billion of orders that were placed for the bonds. A reflection of economic strength could be taken from a Durable Goods report that was double consensus at +6.5%. Announcement of next week’s Treasury auctions for 3, 10, and 30-year debt to take place during the sale for SBAP 2017-20H.
Thursday – French GDP is reported at +0.5% and the Senate prepares to vote on its “skinny” revision for ACA; the Senate passed legislation to penalize Russia for its interference in the 2016 presidential election.
Friday – long before 2Q17 GDP was released (+2.6%), results of that morning’s Senate vote, failing to pass the scaled down version to replace ACA had circulated. By the time GDP was released the market was fatigued and then it was reported that in a letter to lawmakers, U.S. Treasury Secretary Steven Mnuchin said the federal borrowing limit needed to be raised by Sept. 29 or the government risked running out of money to pay its bills. That topic is one that always supports stronger Treasury prices and is an issue that probably will linger to its 11th hour.

That recap does not even include the administrative in-fighting, dismissal and replacement of the President’s chief of staff, and then Sunday’s announcement that Russia will expel as many as 755 US diplomatic and technical personnel in country, in response to the sanctions.
We begin the week with the benchmark 10-year Treasury resting just below its 200-day Moving Average of 2.30%, a level of support that failed just two weeks ago.
The Week Ahead – has some fed speak and key economic reports.
Tuesday – Personal Income & Outlays – which includes the Fed’s preferred inflation gauge that is expected to be +0.1%, +1.5% y/y. Purchasing Managers Index is expected to be flat, and the Institute of Supply Management index should show a slight decline after a year of growth
Thursday – Factory Orders should rebound after two consecutive declines
Friday – Non-Farm Payroll is expected to be + 180,000 with the Unemployment Rate declining to 4.3%
July 24, 2017
The Week that Was – began with the health care revision faltering and pulled from a vote, joining tax reform and infrastructure spending initiatives that are in suspension. Prospects for all three items were responsible for the post-election increase in rates that has been reversed by half since March.

With Fed officials restricted by blackout rules leading up to this week’s FOMC meeting, central bank commentary focused on the European Central Bank and they did not disappoint. Bond prices strengthened with Thursday’s announcement that interest rate policy and the bond buying program would not change. Comments from Mario Draghi that inflation is not showing any sign of picking up were enhanced by the bank’s report that eurozone inflation is expected to average 1.5% for the next three-years, far below their 2.0% target. Mr. Draghi’s somewhat dovish comments softened his late June hawkish comments that had weakened bond prices.
The stockcharts.com chart below shows how rates have improved, in an irregular pattern, since peaking in March and we now sit at the 50-day Moving Average (2.24%), which should provide resistance.

The S&P 500 index produced its 27th record close of the year as investors seem confident that economic strength is sufficient and perhaps central banks are not united in a tightening program. Such was the concern earlier this month but weak reports and central banker acknowledgements about persistently low inflation have changed market perception.
In other central bank news, the Bank of Japan announced it did not expect to hit its inflation target of 2.0% until 2020, and it too would continue its bond buying program.
The Week Ahead – has a sizeable amount of Treasury debt being sold, but the focus will be on the FOMC meeting that concludes Wednesday, with an afternoon announcement. The economic calendar is light, with Friday’s 2Q17 GDP report of most interest.
Monday - $72B short-term Bills are sold
Tuesday - $26B two-year Notes
Wednesday - $15B two-year FRN’s and $34B five-year Notes. The FOMC announcement will be closely watched for comments on inflation and any commentary on unwinding the Fed’s balance sheet
Thursday - $28B seven-year Notes
Friday – the first estimate for 2Q17 GDP, expected to be +2.6%, almost double the 1Q 17 performance. Consumer spending is expected to be the driver of this strength
July 17, 2017
Three Steps – the rates market improved for the first time in three weeks:
1. CT-10 held at 2.40% support on Monday
2. In Congressional testimony, Janet Yellen admits that low inflation is still a major source of uncertainty
3. Weak Retail Sales, CPI data and Consumer Sentiment on Friday

So, we end the week near 2.30%, which two-weeks ago had been a support level that failed, but now is a level of resistance. The market saw good demand for the Treasury auctions as well as strong CMBS issuance.
The Week in Review – saw stocks hit record highs and US banks report stronger profits than expected. Two weeks after mentioning “somewhat rich asset prices,” Chairwoman Yellen’s dovish commentary about the transitory nature of inflation remaining lower than expected gave strength to the rates market, even as she stated the economy should continue to expand. However, it is the rate of expansion that is of concern, as evidenced by the CBO’s interpretation of the federal budget released by the White House, projected over ten-years.

The difference rests mainly on the economic impact of proposed tax cuts that, like health care reform, has not been advanced and whose benefit is considered very optimistic.
Weak reports on Friday did nothing to support possible increases in inflation. The Consumer Price Index, ex food & energy, came in below forecast at +0.1%, +1.7% y/y. Retail Sales, at -0.2%, was far below the consensus of flat to +0.4%, and then, the University of Michigan’s Consumer Sentiment reading reported another decline, a downward trend since peaking in December.
The WSJ chart below captures the trend for these indicators.

As well as the supply of Treasury and MBS debt was received, market focus is on the Fed and its plan for discontinuing reinvestment of proceeds in its $4.5T portfolio. It is expected a start date could be announced at its July 26 meeting and removing this buyer from the MBS market in 4Q2017 could pressure credit spreads going into year-end.
The Week Ahead - has no Fed speak, as they enter their blackout period before their July 25-26 meeting. Treasury supply is short-term Bills and 10-year TIPS, while economic reports are of relatively minor importance.
July 10, 2017
The holiday shortened week saw market sentiment continue to weaken as the impact of central banker comments heralding the end of easy money policies dominated activity.

The slope of the Treasury curve (2/10’s) steepened 8bps early in the week as longer-term rates rose faster than the front-end which is most affected by Fed policy.
Upon returning from a long weekend, traders digested the minutes from the ECB’s last policy setting meeting where policy makers believed that deflation risks had “largely vanished.” While they might believe deflation risk to be minimized, euro zone inflation at 1.3% is even lower than in the US, meaning both central banks are satisfied that their economies slow growth performance is sufficiently strong to manage with less support. Joining the central bank chorus is the Bank of France, whose spokesman said that “interest rates are set to rise.”
Doing Well Enough – seems to capture economists attitude about economic strength after Friday’s Non-Farm Payroll report. At 222,000 it was stronger than forecast and showed a 0.1% gain in the Unemployment Rate to 4.4% (more people joined the work force), as well as 0.1% gain in the Labor Force Participation Rate. Additionally, April and May reports were revised upward by 47,000. More solid employment data, but it was diluted somewhat by weaker than desired wage growth; at +2.5% y/y it is far below the 3% gains that workers enjoyed prior to the recession.
Low inflation and wage growth are unlikely to move the Fed from its course of action – one more rate hike in 2017, and a reduction in its portfolio. We can expect more details on that plan after the next FOMC meeting on July 26.
The Week in Review – focus was on ECB comments and the NFP report. On Thursday, the SBA 504 loan program priced its July debenture sales.

The upward trend in rate during this tightening cycle is confirmed by the 12-month averages but it is important to note that the July 20-year debenture represents a 4.77% effective cost of funds to small business borrowers.
The Week Ahead – has much Fed speak with Janet Yellen providing her semi-annual Monetary Policy Report to Congress; plus Treasury auctions of intermediate/long/term debt.
Tuesday – Treasury auctions $24B 3-year Notes
Wednesday – Janet Yellen appears before the House Financial Services Committee; Treasury auctions $20B 10-year Notes
Thursday – Janet Yellin appears before the Senate Finance Committee; Treasury auctions $12B 30-year Bonds
Friday – has several releases:
Consumer Price Index – consensus 0.1% vs. -0.1% in May
Retail Sales – consensus 0.1% vs. -0.3% in May
Industrial Production – consensus 0.3% vs, flat in May
Consumer Sentiment – last month’s reading was the lowest since the November election
July 3, 2017
A Collaborative Effort?
It started with comments from Mario Draghi, President of the European Central Bank – “there is investor vulnerability when major central banks pivot to a less accommodative policy.” Followed by Janet Yellin saying there are – “somewhat risky asset prices.” And concluding with Mark Carney, Governor of the Bank of England, saying he is prepared to raise interest rates soon, as is the Bank of Canada.

Collectively, these comments got the market’s attention and prompted a selloff in global sovereign debt. Not quite as abrupt as the 2013 “taper tantrum,” but enough for investors to fret that the period of ultra-low monetary stimulus is coming to an end. The 14bps rise in ten-year Treasury rate puts the note near its one-month high, and just below a key support level of 2.305%.
Equity markets have registered the best first-half year performance in years; Nasdaq was better by 14%, while DJIA and S&P 500 were improved by 8%. The energy component of those indexes did not participate as the energy sector declined 13.8% and US crude oil was down 15.7%.
Even lackluster inflation data on Friday did little to improve the rates market’s reversal. Personal Income was reported as +0.4% but wages and salaries gained only 0.1%. Consumer spending increased by just 0.1% and the core Personal Consumption Expenditures index gained 0.1%, with its y/y rate declining to 1.4%. The Wall Street Journal chart below shows how this ex food & energy estimate has been unable to gain traction towards the Fed’s 2.0% target. While that underperformance could complicate the FOMC’s plan for additional rate hikes, any such concern can be offset by global central bank action, like what was broadcast last week.
The market’s performance reflects the liquidation of long positions that had been accumulated over recent weeks and its continued weakness after the disappointing PCE data (usually a prompt to buy) means the market will probably test the above mentioned support level.

The Week Ahead - is holiday shortened, especially with many people taking off Monday. There is Fed speak but no Treasury supply on the calendar.
Monday – Institute of Supply Management gains should remain steady
Wednesday – Minutes of the FOMC meeting on June 14 are released
Thursday – the SBA 504 program prices 2017-20G and 2017-10D
Friday – Non-Farm Payroll report is expected to show a gain of 170,000 jobs with the Unemployment Rate remaining at 4.3%
June 26, 2017
Rates continue to decline – modestly, and equities marked time in the absence of any major reports and ambivalent Fed speak. As seen in this Financial Times chart linking this year’s equity rally to cheap money, the ten-year Treasury has broken through its 200-day Moving Average as the market awaits the next batch of inflation data.

And that data arrives on Friday as part of the Personal Income & Outlays report, when Personal Consumption Expenditures is expected to show a gain of +0.1% which could move its core rate to +1.6% y/y. That would still remain below the Fed’s target of 2.0% but would offer encouragement to the Committee about its tighter monetary policy.

The Rest of the Week Ahead – has more Fed speak and a lot of Treasury supply.
Monday – Durable Goods orders expected to be -0.4% after April’s report of -0.7%. Treasury auctions $72 billion short-term Bills and $26 billion 2-year Notes
Tuesday – Treasury auctions $34 billion 5-year Notes and Janet Yellen speaks at a forum on global economic issues and Mario Draghi speaks on EU economy
Wednesday – Treasury auctions $28 billion 7-year Notes
Thursday – the third estimate for 1Q17 GDP is expected to be unchanged at +1.2%
Friday – Personal Income expected to be +0.3% and PCE is part of the release
June 19, 2017
No Impact - FOMC acted as advertised and the market shrugged it off. In fact, the market rallied the morning of the rate increase in response to weak Consumer Price Index and Retail Sales reports, and then gave back some of that move later in the week.

Leading up to Wednesday’s announcement CPI came in -0.1% m/m and its core rate declined to +1.9% y/y. CPI is not the primary inflation indicator used by the Committee but that core rate is even lower, +1.5%. Retail Sales was -0.3%, a bit more negative than expected.
To recap Wednesday’s announcement:
- This is the fourth-rate hike dating to December 2015, and the Committee projects one more this year, and three next year
- Inflation is acknowledged to be lower than expected and the forecast does not expect a significant rise
- GDP estimate for 2017 is 2.1% and then 2.0% in 2018
- Longer run unemployment is projected to be 4.7%
- A “taper tantrum” like in the summer of 2013 seems to have been avoided as the Committee provided more detail than expected regarding its portfolio reinvestment strategy, but no definite start date. The reduction will begin with $6 billion US Treasuries and $4 billion Mortgage-backed securities monthly, to increase every quarter, rising to a maximum reduction of $30 billion per month for Treasuries and $20 billion per month for MBS. Mrs. Yellen commented that balance sheet levels will be reduced “appropriately below those seen in recent years ($4.5 trillion) but larger than before the financial crisis (≤$1 trillion). Some Fed officials have speculated the final balance will be between $2-3 trillion.
Essentially, the current environment pits Reflationists vs. Deflationists with the Fed being in the former camp and the market in the latter. The breakeven rate for ten-year Treasuries (a measure of the yield premium for ten-year Treasuries vs. the yield on ten-year Treasury Inflation Protected Securities) is 1.67%, meaning that is what the market expects inflation to be for the next ten-years. Last month, that premium was 1.82% and it is shaping up for inflation data to drive price action as the market is indicating we are in a low growth, low inflation situation.
The Week Ahead – has a lot of Fed speak with housing data and the Purchasing Managers Index on Friday. Treasury supply will be $92 billion of Treasury Bills and $5 billion of 30-year TIPS.
June 12, 2017
Lower for Longer – has been the case for interest rates so far. Will it continue?

The market digested the Comey testimony, ECB policy announcement, and unexpected Tory shock in the UK election with only a small increase in rate. The UK election continued a losing streak for pollsters as Mrs. May’s party failed to maintain its majority and needs to form a coalition with a fringe party from Northern Ireland. It has serious implications for the Brexit negotiations which have almost two-years to run.
As we approach Wednesday’s probable rate increase from the FOMC, here is where official and consumer rates stand compared with one-year ago.

What is of interest in the above chart is that the benchmark ten-year Treasury has tracked the higher cost of funds after two recent rate hikes, but is actually 0.09% lower in rate from before the first rate hike in December 2015. Depositors are still not being compensated for savings and a higher yet cost of funds will not provide them any relief.
While not as low as before the presidential election, Treasury rates stubbornly remain low while equities are near all-time highs, the dollar has weakened 7% this year, and gold (another safe-haven investment like Treasuries) is on a tear.
So, how does the Fed interpret all this? It seems they are totally focused on employment which appears to be strong, while tolerating the below target rate of inflation and that is why Wednesday’s rate increase is likely. Similar conditions exist across the pond – Eurozone unemployment is at its lowest level since March 2009 (9.3%, compared to the US rate of 4.3%) and core inflation remains below target with slow wage growth, just like in the US. Additionally, the ECB will need to address its Quantitative Easing program, just as the Fed will need to take action to reduce its $4.5 trillion Balance Sheet. Both initiatives have provided strong support for fixed-income securities and changes in policy will pressure rates to move higher.
On Thursday, $338,673,000 of 2017-20F was priced at a rate of 2.81%, 6 bps below the program’s 6-month average rate through May, and with an Effective cost to small business borrowers of 4.60%.
The Week Ahead – starts with Treasury auctioning $71 billion of 3, 10, and 30-year securities on Monday and Tuesday.
Wednesday has reports on Retail Sales and CPI but all focus will be on the FOMC rate decision, new forecasts, a Yellen press conference, and potentially some information on the plan to reduce the Bank’s balance sheet.
June 5, 2017
The rates market’s resilient performance after the release of the FOMC’s May minutes pointed toward a June rate hike and its continued improvement was boosted on Friday by a weaker than expected Non-Farm Payroll Report. Like many economic reports it contained good news and bad news, though it was weighted to bad news.
The good news was the Unemployment rate declined to 4.3%, its lowest level in 16-years, and far below the Committee’s 5.0% target.
The bad news was:
- The +138,000 report reduces the 3-month average to 121,000, vs 190,000 in the year-ago period
- Downward revision of 66,000 for the previous two-months
- Average hourly earnings increased by just 0.2%; +2.5% y/y, a reading that has been flat since 2015 but does exceed the +1.5% inflation rate that the Fed monitors
- At 62.7% the Civilian Labor Force Participation Rate is as low as it was four decades ago. This monthly decline of 0.2% indicates the labor force shrunk by 429,000 people in May
- A larger measure of employment (formerly known as U-6), measures Underemployment, and it stands at 8.4%. This category includes not just unemployed workers but also discouraged workers and part-time workers seeking full-time work.
Continuing to rally in the face of an expected rate hike on June 14, the weekly chart below reflects the ten-year Treasury’s odyssey from the Presidential election to now. The nearly 80 bps move higher has been halved in the wake of two rate increases, with an expected third move on the calendar for later this month. Even with inflation (PCE at +1.5%) below target, many analysts still expect the Fed to maintain its tightening policy.

The Week Ahead – is light on economic data, Fed speak, and Treasury supply (just short-term Bills)
Monday – Factory Orders have been improving but this report is expected to be -0.2%
Thursday – 2017-20F is priced. Debenture sales continue to benefit from this recent drop in benchmark Treasury rates.
European Central Bank meets and releases its updated forecast profile
May 30, 2017
It was a quiet week for the rates market as it prepared for a holiday weekend, moved neither by mixed data from economic releases nor the minutes from the Fed’s May meeting.

There was a brief move higher in rate going into Wednesday’s release of the minutes but their tone was not overly hawkish, calling any slowdown transitory while signaling the bank’s intent to raise rates another 25 bps at their June 14 meeting. What has changed since the March 15 rate increase is the slope of the Treasury curve, with the 2/10 segment flattening from 119 bps to 95 on Friday, and from 130 bps when rates rose in December 2016. This is standard behavior in response to a tighter monetary policy and seems to indicate that next month’s hike is mostly built into the market.
Good News
- 1Q17 GDP revised to +1.2% from the original report of +0.7%; with 2Q estimates ranging from +2.2% to as high as +3.7% (FRB Atlanta)
- Purchasing Managers Index gained 1.2%
- Treasury saw strong demand for its auctions, especially indirect (foreign) bidders; while Foreign Central Banks show renewed interest in Treasury debt
- FOMC believes any economic weakness is transitory
- Freddie Mac survey shows 30-year mortgage rates below 4.0%
Less than Good News
- Durable Goods Orders fell for the first time in five-months
- The goods trade deficit rose to $67.6 billion in April
The Week Ahead
Tuesday - Personal Income & Spending, which contains the Committee’s favorite inflation indicator (PCE). Consumer spending is expected to grow but with little effect on the PCE rate
Wednesday – Chicago Purchasing Manufacturing Index
Friday – Non-Farm Payroll expected to be +185,000 with Unemployment remaining at 4.4%
May 22, 2017
A very interesting week as Trump tweets surpass Fed speak with their impact on financial markets. Contradictory explanations for the firing of FBI Director Comey, disclosure of classified information to Russia’s Foreign Minister and Ambassador, and the appointment of a special prosecutor to investigate Russia’s alleged interference in the 2016 presidential election combined to weaken equities and give safe haven assets a boost.

This was the Treasury market’s best performance in a month and reflected not just the fear regarding the President’s actions and explanations, but also the concern over his planned fiscal stimulus proposals, tax cuts, and health care replacement. Spending for those initiatives would come from increased issuance of Treasury debt, so as their approval becomes less likely so does the anticipated supply of bonds.
Expectations for another rate hike at the conclusion of the FOMC’s June 13-14 meeting are still in place, but not a unanimous sentiment. St. Louis Fed President James Bullard, citing the weaker than expected core PCE reading of +1.6%, does not see enough reason for a June increase. Even though Unemployment, at a better than targeted 4.4%, reflects labor strength, he was quoted as saying “Low unemployment readings are probably not an indicator of meaningfully higher inflation over the forecast horizon.” Sluggish wage growth is another hurdle for inflation to overcome and though it is not one of the variables included in this WSJ chart it is of concern. These categories indicate market positions expect Treasury Note yields to decline while short-term rates increase (standard performance with a tighter monetary policy), consumers’ expectations for inflation to remain low, the Treasury yield curve will continue to flatten (restatement of the first point), and the $US continues its 2017 weakness.

An indication of this flattening yield curve is that on December 14, 2016 when the Fed last raised rates, the Treasury’s 2/10 spread (yield difference between the 2-year and 10-year Notes) was +130 bps. On Friday, it closed at +96 bps, a significant out-performance by the benchmark Note used for our Debenture sales, and helps explain why May’s 20-year rate of 2.88% was only 7 bps higher than in December.
The Week Ahead – several Fed speakers, early in the week.
Tuesday – New Home Sales + $26 billion 2-year Note auction
Wednesday – PMI plus Existing Home Sales; $36 billion 5-year Note auction; FOMC minutes from the May 3 meeting
Thursday - $28 billion 7-year Note auction
Friday – Durable Goods expected to reverse March’s strong 0.7% gain; 2QGDP expected to be revised up by 0.1% to +0.8%
May 15, 2017
After selling off to absorb $52 billion of notes and bonds in the Treasury’s quarterly refunding the rates, market rallied to close 1 bps lower on the week, at 2.33%. Helping this move was soft data for Consumer prices on Friday, +1.9% y/y ex food & energy, a reading below 2% for the first time in 1 ½ years.

Earlier in the week Retail Sales showed a +0.4% gain, a nice recovery from March’s -0.2% but not as much as was expected.
Thursday saw the sale of the SBA 504 program’s May debentures priced in line with expectations.
$17,713,000 2017-10C @ 2.33%, + 41 bps to Treasuries
$361,901,000 2017-20E @ 2.88%, + 49 bpw to Treasuries
While the number of additional interest rate hikes this year may be in question, the planned reduction of the Fed’s balance sheet seems to be drawing more attention. Discontinuation of reinvestment from portfolio proceeds would remove a significant buyer from the market and could result in more pressure on rates. This condition is not limited to the U.S., as the Bank of Japan also holds $4.4 trillion of its sovereign debt and these totals are exceeded only by the European Central Bank’s holding of $4.5 trillion. Should the global economy recover in sync, central bank buying would no longer be present.
The Week Ahead – is relatively light on speeches and data.
Tuesday – Industrial Production is expected to recover from March’s -0.4% report, and Housing Starts should continue to be strong, led by Multi-Family units.
May 8, 2017
Friday’s Non-Farm Payroll report was anti-climactic, as far as Treasury price action was concerned. By the time we got to the report of +211,000 gains, we had already been subjected to:
- The President calling for the breakup of big banks
- Apple reporting a cash hoard of $250 billion (90% of it overseas)
- The Fed’s preferred inflation gauge, Personal Consumption Expenditures, coming in - 0.2%, reducing its y/y Core rate to +1.6% vs. a target of 2.0%
- Institute of Supply Management report fell sharply after seven consecutive gains
- Treasury Secretary Mnuchin reaffirming interest for ultra-long bond issuance, something the market is not excited about
- Auto sales continue to weaken
- FOMC announced no policy change, citing a recent slowdown in growth that the Committee said was likely “transitory”
- The House of Representatives voted to repeal the Affordable Care Act and replace it with its own health care act, now on its way to the Senate
- And, Puerto Rico has defaulted on $73 billion of debt, some of which was supposed to be protected by sales-tax revenue

Even with mixed economic signals, below target inflation data, and sluggish wage growth, market analysts still expect an interest rate hike in June, and another one later in the year. Tighter monetary policy can also be achieved by a reduction of the Fed’s current balance sheet position that totals $4.4 trillion. This figure has been stable because the Fed continues to reinvest interest payments and maturing debt, thereby continuing its QE like support of the bond markets. Of concern is the timing and extent of withdrawing this support, especially with $1.75 trillion of the holdings being in mortgage-backed securities. At its most recent meeting the Fed announced its desire to begin reducing its holdings and two Fed bank presidents amplified that statement late in the week. James Bullard and John Williams would like this balance reduced by as much as half, to a level seen just after the great recession and before QE2. As apolitical as the Fed is, they must be sensitive to the possible impact from tighter monetary policy, reduced balance sheet support, increased deficit from tax cuts, plus planned infrastructure spending.

The week Ahead – has several Fed speakers, plus:
Sunday – second round of French presidential election. Pollsters finally get one right as Emmanuel Macron defeats the far-right candidate Marine LePen. This will soothe European concern about a Frexi and allow the EU to focus on Great Britain.
Tuesday – PPI expected to be +0.2%, +1.7% y/y. Treasury auctions $24 billion 3-year Notes
Wednesday – Treasury auctions $23 billion 10-year Notes (the benchmark for our 20-year debentures)
Thursday – we price 2017-20E and 10C. Treasury auctions $15 billion 30-year Bonds and PPI is expected to +0.2%; +2.3% y/y
Friday – Retail Sales expected to be +0.6% vs. March’s -0.2%. CPI expected to be +0.2%; 2.0% y/y
May 1, 2017
The 15% Solution
Spurred initially by Marine LePen’s failure to win the first round of the French election, the stock market received an additional boost from strong earnings and the administration’s restatement of its proposed tax plan, lowering the corporate and pass-through tax rate to 15%.

This performance initially pushed prices in the rates market lower but the benchmark ten-year Treasury improved to close the week almost unchanged at 2.28%, lower by 7 bps from when we priced the April debenture sale. Surprisingly, Treasuries did not improve more after Friday’s +0.7% report on 1Q17 GDP. This compares to the 4Q16 performance of +2.1% and is the slowest rate in three-years. A 0.3% increase in consumer spending, the weakest level since 2009, was identified as a major contributor to the disappointing report.

This performance reflects the divergence between soft data and hard data – strong consumer and corporate sentiment vs. sluggish retail sales and the recent GDP report. Weak first quarter growth is becoming a common occurrence and economists do forecast a strong rebound in Q2.
The Week in Review
Durable Goods Orders were +0.7%, due mostly to strong airplane orders; ex transportation though the number was -0.2%
New Home Sales were stronger than expected at 621,000
Foreign Demand for Treasury debt was evidenced by 81% of Thursday’s $28 billion 7-year note going to indirect bidders
European Union affirmed a tough stance on divorce proceedings with the UK. Britain has expressed hope that trade terms can be negotiated now, while the EU has stated no discussions will take place until the exit penalty is paid.
Shutdown averted as Congressional leaders reach a deal to fund the government through September 30
The Week Ahead
Monday – Personal Income & Outlays is forecast to be +0.3%, with the Fed’s favorite inflation measure, PCE, expected to weaken. Institute of Supply Management report is expected to soften after seven consecutive strong reports
Wednesday – FOMC meeting announcement with an updated forecast profile. No change in policy is expected.
Friday – Non-Farm Payroll report is expected to rebound from March’s disappointing +98,000. Consensus looks for +185,000.
April 24, 2017
Losing Faith in the Economy
After the post-election surge in rates, the bond market has reversed course and rests near the mod-point of that 80 bps move.

An illustration of just how contrarian this move has been is the amount of debt that has been issued while rates declined; the supply had little impact.
- $178.5 billion by companies and governments in Emerging Markets (best Q1 on record)
- $79.6 billion by US companies with junk bond ratings (2X the 1Q16 volume)
- $414.5 billion by highly rated US companies (a record for any quarter)
And this is in addition to the weekly issuance of Treasury debt, which will be $88 billion in 2, 5, and 7 year maturities this week. That is in addition to $88 billion short-term Treasury Bills.
During this rally, equity prices have retreated as investors view that product’s value to be stretched, especially since there is an absence of clarity on the administration’s promised programs; that could change on Wednesday when a tax overhaul is scheduled for release.
Other items of interest last week:
- Treasury is seeking feedback on issuing “ultra-long” debt, for 40, 50 or 100-year bonds. Presently, the market does not charge a premium for that extension since the 50-year swap rate is 3 bps below the 30-year rate, suggesting a 50-year bond could be cheaper for Treasury to issue. Market sentiment and supply size are variables to be considered.
- “Tapering” the Fed’s balance sheet is a hot topic and one way to accomplish that is by not reinvesting its maturing Treasury holdings. Over the next two-years there is $783 billion set to mature.
- Brexit negotiations are yet to begin but a Financial Times article identified an “economic chill” that Brussels has fostered on the UK, even before it leaves the bloc.
- Benefitting from a higher rate environment, most of the large national banks reported strong 1Q17 earnings, with the exception of Goldman Sachs which probably did not participate in the bond market rally.
- Brick & Mortar stores are crumbling as decades of overbuilding and the impact of online shopping have resulted in 2,880 store closings to date, as seen in this WSJ chart.

The Week Ahead – some Fed speak, with economic reports and Congressional negotiations on government spending.
Sunday – Centrist Emmanuel Macron and far-right candidate Marine LePen are headed for a decisive second vote on May 7. These selections are a rebuke to France’s traditional political parties and have influenced US markets – CT-10 yield has moved to 2.30% overnight and Dow Futures are sharply higher.
Tuesday – New Home Sales should remain steady at 584,000
Wednesday – (or shortly thereafter) is the day President Trump plans to announce his tax plan, but his budget director said it might be June before details are available
Thursday – Durable Goods orders have generally been soft, aided mostly by strong aircraft orders
Friday – 1Q17 GDP expected to be +1.1%, down from 2.1% in 4Q16. Partial government shutdown looms for the President’s 100th day in office if a spending bill cannot be agreed on
April 17, 2017
Written by: Steve Van Order
Risk off: Treasury yields fell last week.
Treasury yields fell over the first three days of the holiday-shortened week before settling in on Thursday. The benchmark ten-year T-note yield fell 12 BP w/w to 2.24%. Flows continued from equities into bonds which supported Treasuries, despite generally sloppy results for the monthly set of $56 billion in three-, ten- and 30-year auctions.
Economic data was generally mixed until the Thursday release of the PPI that was weaker than expected. On Friday morning, while the bond market was closed, the CPI for March fell m/m for both headline and core figures. The y/y growth rates were 2.4% and 2.0%, respectively. The chart below shows the behavior of the CPU headline y/y measure over the last decade. We can see the steady rise in the post-crisis CPI rate since it bottomed around zero in 2015. The latest measure shows a small retreat in the trend. This may help bond market animal spirits this week.

Also assisting the bond rally last week were Fed Chair Yellen’s comments on Monday that were pretty neutral and did not signal any hawkish bent. Continued geopolitical tensions in Syria and North Korea combined with President Trump’s flip-flopping on security and domestic issues kept investors confused on where U.S. leadership is headed. Confusion almost always helps bond yields move lower.
This week there is a lot of economic data to be released but it is all of a second tier nature. The parade of Fed speakers will continue as well.
April 10, 2017
Risk Off – resulted in an eventful week that left markets basically unchanged – which is surprising.

Events that usually result in market volatility were:
- A U.S. Naval attack on a Syrian airbase used to launch a chemical attack on its citizens
- A dramatically lower than consensus jobs report that included downward revisions
- FOMC minutes from the March meeting that addressed plans to normalize its portfolio
- Concern from European investors that the ECB may continue to scale back its purchases as part of its Quantitative Easing program
- The resignation of Richmond Fed President Jeffrey Lacker for leaking confidential information to a policy intelligence firm
Safe-haven Treasury securities rallied Friday morning in response to the airstrike but quickly settled back and closed lower on the day. Rates seem range bound as market forces, Fed policy, and legislative gridlock compete for headlines. During this reversal, the Non-Farm Payroll report came in 100,000 below consensus, at +98,000 with 38,000 jobs reduced from the previous two-months’ reports. Offsetting this weak number was an Unemployment rate showing a reduction to 4.5%.
Together with the additional rate hikes, the Fed has projected for this year is speculation over how it will normalize its $4.2 trillion balance sheet. Minutes from the recent meeting disclosed “rollover tapering would likely be appropriate later in the year.” It is expected the process would consist of no longer reinvesting proceeds from interest income and maturing Treasury and MBS debt, allowing the bank to achieve a portfolio of approximately $2.8 trillion by 2021. The European Central Bank has already reduced its QE policy from €80 billion to €60 billion and amid Brexit negotiations and national elections the WSJ reports that investors are concerned that Europe’s biggest buyer may further reduce its support.
Details of a previous investigation regarding the possible leak by Dr. Lacker were omitted from an original report that has been prepared before the FRB of Richmond reappointed him in 2015. The leak took place in 2012 and contained “potentially market moving information.”
Other than these items the market also saw the 504 program’s April debenture sale price on Thursday, for settlement on Wednesday, April 12. Priced at 2.84%, and a spread of +49 bps to the ten-year Treasury, 2017-20D was 20 bps lower than the March sale and just 3 bps higher than the December 2016 debenture which priced prior to two Fed rate hikes. In the chart below it is clear how the market anticipated the recent interest rate increases but what is most impressive is that small business borrowers now are locking in 20-year fixed-rate 504 loans just 63 bps above the Prime Rate.

The Week Ahead – is shortened by Friday’s holiday in advance of Easter, and has reduced Fed speak with Charwoman Yellen talking Monday at U. of Michigan.
Monday – auctions for $72B T-Bills and $24B 3-year Treasury notes
Tuesday - $20B 10-year Treasury notes
Wednesday - $12B 30-Treasury bonds and Closing for 2017-20D
Thursday – Producer Price Index, expected to be flat
Friday – markets are closed, bur Consumer Price Index and Retail Sales are released, and expected to be flat to slightly negative
April 3, 2017
It was an interesting week:
- Inflation finally hits the FOMC target of 2%
- A lot of talk about Fed policy, by the Fed
- S&P 500 Index has best quarterly performance since 2015
- Rates market holds firm
- UK submits Article 50 to prepare its exit from the European Union
- Health Care bill fails
Though core PCE (ex food & energy) at 1.8% remains below the Fed’s 2% target, the overall number crept above that level for the first time in five-years, joining the Bank’s other objective of an unemployment rate ≤ 5% that drives its higher interest rate policy.

Fed speak was very active last week with comments ranging from FRB Vice Chairman Stanley Fischer saying two more rate hikes this year “seems about right,” to Chicago FRB President Charles Evans seeing four rate hikes “if there is a stronger lift in inflation.” Additionally, there was speculation of how, and when, the Fed might return to normalization for its portfolio. Though no longer actively pursuing its QE2 policy, reinvestment of interest income and maturing debt is ongoing and ending that would have an effect on longer-term rates.
Though equities have declined 2% recently as the Trump rally has lost momentum, that sector had a very healthy 1Q17 performance. Without any advance on tax reform or infrastructure spending, further significant gains are unlikely.
Treasury saw strong demand for its auctions last week, especially from indirect (foreign) bidders who bought as much as 71% of the seven-year auction. The ten-year Treasury benchmark that is used for our debenture pricings closed the week at 2.39%, lower by 19 bps from our March sale.
The clock is now running for the UK as it submitted the required Article 50 to the EU, commencing the two-year window in which negotiations for its exit must occur. While the UK wants to negotiate trade terms with its former members, the Union is adamant that a prescribed fine be paid before any negotiations take place. Additionally, the UK must deal with Scotland’s renewed desire to secede and maintain its membership in the EU.
The President’s move to pull the repeal and replace action for the Affordable Care Act was a crushing defeat, and brings into question the administration’s ability to pursue its aggressive tax reform and infrastructure spending plans. Further weakening those plans is the need for the Senate to exclude the President’s request for funding to increase military spending, and construction of the wall at the Mexican border in its resolution to avoid a government shutdown later this month. Including those funding requests would most certainly result in a legislative stalemate.
The Week Ahead –
Monday – Institute of Supply Management
Tuesday – Factory Orders expected to show a gain of 1.2%
Wednesday - Release of minutes from the March 15 FOMC meeting
Thursday - *** Pricing for 2017-20D and President Trump meets with Chinese Premier Xi Jinping in Florida
Friday - Non-Farm Payroll report expected to show a decline from the elevated levels of the previous two-months. Consensus forecast is 178,000
March 27, 2017
Relief Rally Continues – relief that the rate increase finally happened on March 15, that is. The FOMC still projects two more increases in 2017, and some analysts predict three more.

The benchmark 10-year Treasury has rallied 17 bps since 2017-20C was priced on March 9, and was poised for further gains at week end. Helping the move has been the selloff in Equities, as the Trump effect has waned and the health care act was pulled from a House vote; an ominous development for a market expecting its change, plus tax reform and infrastructure spending. If Treasuries are up then it usually means stocks are down, and through March 22US stock funds saw $9 billion of withdrawals, the largest weekly amount since June 2016, whch began a negative trend that contiued until the presidential election (Financial Times chart).

As for performance, stocks continue in a choppy market with the S&P 500 index down 1.4% for the week, and about 2.5% off its highs. All of this leaves us in an uncertain environment, dependent on headline news and the Republicans needing cross-over Democratic votes to pass legislation.
Last Week – contained second tier reports and muted Fed speak, with Chairwoman Yellen addressing education, and not fiscal policy, in her speech. A strong new home sales number affirmed the strength of housing and residential mortgage credit.
The Week Ahead – a lot of Fed speak, plus:
Monday through Wednesday – will see Treasury auction $86 billion of short and intermediate term debt. Since there is $81.4 billion of maturing debt, the supply should not be a problem.
Consumer Confidence on Tuesday may decline from its post-election highs.
Thursday – gives us the third revision of 4Q16 GDP and is expected to rise slightly from 1.9%.
Friday – Personal Income and Outlays includes the Fed’s favorite inflation gauge, PCE, and it is expected to finally reach the targeted 2% level y/y.
March 20, 2017
A Reversal of – Buy the Rumor, Sell the Fact

In the rates market last week, it helped if you bought the fact that lending rates had just increased. Leading up to Wednesday’s move the rates market has built in the 25 bps increase, and more. Offsetting that sentiment was somewhat dovish commentary from the Committee, with one member dissenting on the move. Kept intact was the Committee’s “dot plot’ calling for two more hikes this year.
Friday’s close puts the benchmark ten-year Treasury 8 bps lower than when 2017-20C was priced on March 9th.

The sale saw an increase in rate, issue size, and number of debentures vs. the program’s twelve-month averages.

The Week Ahead – contains much Fed speak, including Janet Yellen on Thursday. The only Treasury supply is short-term Bill auctions.
Wednesday – Existing Home Sales are expected to continue January’s strong report
Thursday – New Home Sales should rebound from a sluggish January level
Friday – Durable Goods are expected to show a 1.5% gain after a 1.8% gain in January
March 13, 2017
Markets Move Ahead of the Fed – Last week, stronger-than-expected labor market data pushed U.S. interest rates higher in anticipation of a Fed rate hike this week. The February ADP Employment Report, released on Wednesday, came in far above consensus at 298,000 sending Treasury yields and mortgage rates to their then-highest levels this year. That ADP report presaged a strong February employment report released Friday by the BLS. Non-farm payrolls rose 235,000 and handily beat the 190,000 consensus. The unemployment rate fell to 4.7% and now has been under 5% for nearly a year. Average hourly earnings increased a solid 2.8% y/y. Other data also suggest a tightening labor market. For example, the latest four-week moving average of weekly jobless claims, at 236,500, is the lowest reading of this economic cycle. The number of job openings (per the last JOLTS survey) is high.
In reaction to, and anticipation of, stronger data releases, U.S. Treasury yields rose. The benchmark ten-year note yield settled at 2.57% late on Friday. On Thursday it reached 2.60%, edging out the high from last December 16. A move above 2.61% would take the yield back to the September 2014 high. Amid rising rates, the SBA 504 20-year debenture rate in March was set at a still-relatively low historical level, and featured one of the larger pools ($333 MM) in some months. At 3.04%, 2017-20C was near the April 2014 level (3.11%), but still delivered an Effective Rate to small business borrowers of 4.83%.

Entering this week the market is poised for what it now believes to be what the FOMC has predicted – three rate hikes in 2017.
The Week Ahead. Market activity will center on Wednesday’s announcement at the conclusion of FOMC’s two-day meeting, and there are several economic reports to be released throughout the week.
- Tuesday: Producer Price Index, +0.6% last month. FOMC meeting starts.
- Wednesday: Consumer Price Index, +0.6% last month, Retail Sales was +0.4%. At 2:00 PM the Fed will release a policy statement as well as new economic and policy rate projections. Chair Yellen will hold a presser after the policy statement is released.
- Friday: Industrial Production, -0.3% last month.
March 6, 2017
Attention Shifts from Trump to the Fed – and the message was very clear.
The rates market gave ground last week after strong inflation data and some hawkish Fed speak, none as forceful as the title of Janet Yellen’s Friday speech – “From Adding Accommodation to Scaling Back.” The 17-bps weekly move heralds the first of three proposed rate increases for 2017, and the market has assigned a 90% chance of it occurring on March 15th.

As reported in the Wall Street Journal, Ms. Yellen was quoted as saying “if inflation and employment data continue to meet the central bank’s expectations, “a further adjustment of the federal-funds rate would likely be appropriate” at this month’s gathering.

The Fed has consistently identified three markers for them to have confidence in raising rates: unemployment at 5% (4.8%); inflation as measured by Personal Consumption Expenditure at 2% (1.9%); and steady global growth. The first two are at, or near enough, to justify an increase and improved European performance is encouraging talk of the ECB’s Quantitative Easing being curtailed. Even with stock indexes trailing off late last week they remain near record levels, as evidenced by the S&P 500 indexes’ 13% gain since the November election.
The Week Ahead – is light on data and contains no Fed speak as the Committee prepares for its March 14-15 meeting and announcement. Treasury will auction $56 billion of intermediate and long-term debt, with our benchmark ten-year note scheduled for sale the day before the March debenture sale.
Thursday – 2017-10B and 2017-20C to be priced at 10:30, for funding on March 15th
Friday – Non-Farm Payroll expected to show a gain of 190,000 with the unemployment rate possibly declining to 4.7%, and average hourly earnings gaining 0.3%
February 27, 2017
Reversal, for now
An unexpected rally late in the week reduced the benchmark ten-year note’s yield to its lowest closing level since November. Analysts were hard pressed for a reason, especially in the face of hawkish Fed comments, stronger inflation data, and Treasury Secretary Mnuchin’s comments re: issuance of 50 and 100-year debentures.

The Week in Review
In reverse order, any initiative to issue debt with such maturities will take some time to implement, just like proposed infrastructure spending. For example, the Treasury’s path to issue floating rate notes took three years, and though this administration is focused on change it will require much market study to examine its possible effects.
The recent strong CPI and PPI releases may be reinforced by Wednesday’s Personal Income & Outlays report that includes the Fed’s preferred inflation gauge – Personal Consumption Expenditures, also expected to be strong. A consensus forecast of +0.4% might put this indicator at the Fed’s 2.0% target.
Wednesday’s release of minutes from the January FOMC meeting offered no clear signal of an imminent interest rate increase, but many participants believed a rate increase could come “fairly soon.” On Thursday, four Primary Dealers in the Treasury market had joined in calling for a May rate hike, though most others are on record for an increase in June.
The Week Ahead – data, the President, and more Fed speak, highlighted by Janet Yellen’s speech Friday night. Treasury supply consists of short-term T- Bills with announcements of 3,10, and 30-year auctions for the week of the March debenture sales.
Monday – Durable Goods – occasionally volatile but improving, expected to be +1.8%
Tuesday – GDP – second revision to 1.9% 4Q growth; consensus is 2.1%; and President Trump speaks to Congress, a speech that is expected to include some insight on fiscal policy
Wednesday – PI&O – income is expected to be +0.3%, with the PCE at +0.4%
Friday - two Fed Presidents (Evans and Lacker) speak on inflation; and Chairwoman Yellen speaks to the Executive Club of Chicago
February 21, 2017
Strong Headline News – is what drove the markets last week, but left Treasury rates mostly unchanged by Friday.

A combination of better than consensus economic releases, aided by more hawkish comments from Chairwoman Yellen, moved rates higher midweek, only to reverse trend by Friday.
- Producer Price Index in January was +0.6%, and + 1.6% y/y
- Consumer Price Index also was +0.6% vs. a 0.3% consensus, and +2.3% y/y ex food & energy. This was the fastest monthly increase in four-years
- Retail Sales was +0.4%
- Yellen’s testimony to Congress surprised many by saying that waiting too long before a further rate increase would be “unwise,” though she stressed the uncertainties facing the nation’s economy. Accelerating growth, higher inflation, and a robust labor market support a tighter monetary policy, while possible changes in US fiscal and other policies foster uncertainty.
Recent French polls put Marine Le Pen in a lead over opponents, causing concern about her nationalistic views to leave the European Union and pressuring French bond rates, which still remain low. French rates have recently risen but this table shows how cheap US Treasuries remain to other sovereign debt.

The Week Ahead – is fairly light on economic data.
- Existing, and New Home Sales numbers will be released
- Wednesday will see minutes from the most recent FOMC meeting
- Treasury auction supply will consist of $88 billion in intermediate notes, plus $13 billion in two-year Floating Rate Notes
February 13, 2017
Stock Indexes at New Records – and most of the week’s gains occurred after President Trump announced a “phenomenal” corporate tax announcement to be made in the next couple of weeks. The president seems to be borrowing a page from ECB president Mario Draghi, whose undated profession to do “whatever it takes,” without actually doing anything immediately, helped the European markets in the lead up to its QE program.

The expected tax cuts and fiscal spending are driving stock and US$, values while putting a cap on any Treasury gains. Fulfilling these initiatives falls to Congress, not Presidential decree, and there is a question as to how long this will take.
In the meantime, the Greek debt crisis has returned to form, a hard Brexit is yet to be defined, a possible Frexit is of concern if Marine Le Pen is victorious, and though there was good indirect bidding for last week’s $62 billion of Treasury debt, foreign investors are holding a smaller total amount of U.S. Treasuries. As evidenced by the Bloomberg chart below, this is not a new trend but did accelerate during the presidential election year and has continued into 2017.

Also, it was mentioned last week that the Fed has policy options other than just raising rates, e.g. reduce the reinvestment of maturing bonds and P&I payments from its mortgage backed securities, something that James Bullard, President of the St. Louis Fed, mentioned in a Thursday speech. Taken together, these items identify global caution about buying U.S. government debt due to political uncertainty. At $5.64 trillion that amount is formidable but its 43% of outstanding supply is down from a 56% share in 2008.
The Week in Review – saw rates improve, though not as much as stocks. 2017-20B was priced at 2.82%, vs. a 12-month average of 2.35%.

The Week Ahead – we’ll see some economic data like Producer Price Index and Retail Sales, but scheduled appearances by Janet Yellen before Congress will be of most interest. On Tuesday, she speaks before the Senate Banking Committee and then Wednesday’s appearance is before the House Financial Services Committee.
February 6, 2017
Tweet Power
With Treasuries becalmed, specifically the ten-year Note closing around 2.48% for the third consecutive week, let’s turn our attention to stocks, where the DJIA had its best one-day performance in two months thanks to the most recent Executive Order to review the Dodd-Frank legislation.

The index’s 187-point gain on Friday was driven by potential regulatory rollbacks and the headline value of Friday’s report of 227,000 job gains in January. The banking sector was a driving force as the index that represents big banks is +24% since the election.
The Week in Review
Sensing a higher rate environment, corporate treasurers are marching to market in force: $17 billion for Microsoft; $10 billion for AT&T; and $8 billion for Apple. Amidst this wave of issuance, corporate bond trading hit a record high of $38 billion on Tuesday alone. Two of the above names have large cash positions with little need to fund operations, as Microsoft recently reported $5 billion in quarterly profit. Looking back to 2008, the firm had zero debt, but taking advantage of historically low interest rates that total is now $76 billion. Wednesday’s announcement from the FOMC was as expected; no change in policy with a unanimous vote.
And then Friday’s NFP report came in stronger than expected but disappointed with a weak wage growth number (2.5%) with last month’s gain revised down. So, we had a stronger than expected number of jobs created, with the Unemployment Rate increasing to 4.8%, and wage growth declining 0.02%. A 46,000 gain in retail jobs was the best number of all categories, leaving the regulatory rollback as the real catalyst for Friday’s strength in stocks.
Though the Fed has projected three rate hikes this year most analysts expect just two, probably occurring in June and December. Rate hikes alone aren’t the only tools to influence policy, as the Fed could temper its current reinvestment policy to shrink its $4 billion balance sheet. It is expected to see $195 billion of Treasury debt mature in 2017 and is currently reinvesting that and proceeds from about $30 billion in monthly P&I payments on its mortgage backed bonds. Yes, Quantitative Easing still lives to some degree. In a footnote to a recent Janet Yellen speech, she admitted that the portfolio’s duration has shrunk to 6 years, down from a 7.5-year duration four-years ago.
The Week Ahead
- Several reports on import/export prices, Fed balance sheet, and Treasury budget
- $62 billion of 3, 10, and 30-year Treasury debt will be auctioned
- Thursday, 2017-20B will be priced, for settlement February 15th. January’s 20-year debenture was priced at 2.80%, vs. history of 2.33% for the program’s 12-month average.
January 30, 2017
Marking Time, Again

After an initial drop in rate, the Treasury market eased back to close the week 1 bps higher as the market absorbed $88 billion in 2, 5, and 7-year Treasury debt. All issues were strongly oversubscribed, including foreign demand which topped out at 74% for the $28 billion 7-year maturity.
Tepid – was the word the WSJ used to describe 4Q16 GDP growth. At 1.9% it dropped dramatically from the 3Q rate of 3.5% and is closer to the 2.1% annual growth rate since 2009.

CBO projects this unspectacular trend to continue, citing structural trends like baby boomer retirements and the increasing trade deficit. Slow growth in the labor force and sluggish worker productivity were cited by Janet Yellen as “some of the variety of forces affecting supply and demand.”
Intense – was the reaction to many of President Trump’s executive orders during his first week in office. Many of them are controversial, and it remains to be seen if he attempts to seek common ground with Republican lawmakers – individual and corporate tax reform, deregulation, and stimulative economic policies, or continues to adhere to campaign pledges.
Last Week in Review
- GDP was the prominent economic release
- Durable Goods on Friday came in at -0.4% vs. a revised -4.8% for November
- Not just strong demand for US Treasuries – a UK auction of £4.3 billion 40-year bonds were sold at a rate of 1.87%, with £23 billion in bids
- Higher rates are universal; German 10-year Bunds yield 0.40%, their highest level in a year
- Also, the UK High Court ruled Parliament must vote on Brexit.
The Week Ahead –
- Personal Income & Outlays on Monday (PCE) is the FOMC’s preferred inflation gauge and is expected to be +0.4%. Ex food & energy its Y/Y rate is 1.6%, shy of the Committee’s 2.0% target.
- Wednesday concludes the Fed’s two-day meeting and is followed by a 2:00 pm announcement. No policy change is expected.
- Friday is January’s Non-Farm Payroll Report, expected to be 175,000 vs. December’s report of 155,000.
January 23, 2017
Where to?
The post-election equity rally has stalled, and the bond market selloff regained momentum, as global markets are at a crossroads awaiting details on President Trump’s proposals.

Closing the week below the December high of 2.60%, the CT-10 rate increase was part of a curve steepening trade after more Fed speak. One particular speech by Chairwoman Yellen on Wednesday simply stated that interest rates could be raised “a few times a year” through 2019. The FOMC has already outlined that path but hearing it again from the Fed chair clearly upset the bond market.
Helping that sentiment was the Consumer Price Index release that showed a 2.1% gain Y/Y, and a very strong auction for $13 billion of 10-year TIPS (Treasury Inflation Protected Securities). Indirect (foreign) bidding for the issue totaled 77.1%.
The Week Ahead – has no scheduled Fed speeches, but several economic releases:
- Existing and New Home Sales are expected to continue their steady growth
- Leading Indicators are forecast at +0.4%
- Durable Goods should rebound from November’s -4.6% with a gain of about 3.0%
- Friday’s report on 4Q16 GDP is expected to be +2.2% vs. the Q3 reading of +3.5%
- On Tuesday, the UK High Court will determine if Parliament needs to vote on authorizing the Article 50 document that would trigger the two-year phase for separation
January 17, 2017
Marking Time – The market took a run at lower rates, but met resistance, and ended the week near where it had started; as did Equities, whose post-election rally tapered off.

We are four days away from the new President’s inauguration, and even further away from the proposed tax, and spending initiatives that have been forecast. Marking time is expected to continue until there is some definition to these proposals.
The Week in Review
- The Treasury saw strong demand, especially from foreign buyers, for its auctions
- Retail Sales came in at +0.6%, slightly below forecasts
- Producer Price Index was +0.3%, ex food & energy was +0.2%
- Janet Yellen’s comments were; “the economy is doing quite well, inflation is near target, but there are quite serious problems long term.”
The Week Ahead
- More Fed speak, with several scheduled speeches
- Industrial Production is expected to be +0.6% after a -0.4% decline
- Consumer Price Index is forecast to be +0.3%, ex food & energy +0.2%
- $107 billion in short-term Treasury bills to be auctioned, plus $13 billion of ten-year TIPS
- Markets will continue to analyze Theresa May’s comments re: “a clean break” with the EU. Initial reaction has been an improvement in rates, Pound Sterling, and weaker equities.
January 9, 2017
This is how rates change when an economic report contains stronger data that expected. The item in this case was part of Friday’s Non-Farm Payroll Report, and it was Average Hourly Earnings (wage growth) that was +0.4%, bringing it to a post-crisis high of +2.9% Y/Y. Wage growth bodes well for consumer spending, which reflects demand for goods, resulting in inflation, which is bad for fixed rate securities. By itself, it does not mean we are at the Fed’s inflation target of 2.0%, but reflects how sensitive the market is during the transition to a new administration that promises tax cuts and increased spending.

In its entirety, the NFP report was:
- +156,000 (below estimates but with +19,000 in revisions to October & November)
- 4.7% Unemployment Rate (an uptick of 0.1%)
- Civilian Labor Force Participation Rate moved up a tick to 62.7%
The Week in Review – other than the already mentioned NFP Report:
- FOMC minutes on Wednesday confirmed the vote to raise the Federal Funds rate by 25 bps was unanimous. The committee still supports “gradual increases,” expecting three rate hikes in 2017, and will continue to reinvest proceeds from maturing Treasuries and principal payments from Mortgage Backed Securities from its $4.5 trillion Balance Sheet.
- Factory Orders were -2.4%, but due primarily to a dramatic decline in commercial aircraft orders.
- Thursday saw the program’s 2017-10A and 20A debentures priced at 2.42% and 2.80%, and the chart below shows how similar 20A was to 2016-20A in rate and below average size, as well as how pricing spread to Treasuries has improved Y/Y.
- Brick & Mortar retail continues to suffer from online sales: Sears announced the closing of 104 stores and Macy’s will close 46 more than the originally announced 68.

The Week Ahead – has A LOT of “Fed speak;” most importantly, Janet Yellen on Thursday night.
- Producer Price Index on Friday is the most prominent report. The last release was +0.4%, with a Y/Y number of +1.2%
- Retail Sales is also released and expected to be +0.7% as strong auto sales should add to holiday spending
- A gauge of how attractive current rates are will be the reception to this week’s $56 billion of Treasury Notes & Bonds. Wednesday’s auction of $20 billion CT-10 will be of particular interest.
January 3, 2017
The final week of trading for 2016 saw prices improve, and yields decline, as the Treasury saw strong demand for its auctions of intermediate-term debt. Indirect (foreign) purchases of the $34 billion 5-year maturity were the strongest, with 71% of the issue accounted for that way. This action took place as the DJIA failed in its attempt to reach 20,000; closing the week down 146 points at 19,763.

Considering the volatility, it is interesting to note that the ten-year Treasury yield increased just 17 bps Y/Y, resulting in the second consecutive year that yields increased. Most of the move was driven by the election results, as market analysts expect inflation to rise as a result of increased spending to spur infrastructure growth.
At 4.6%, the Unemployment Rate has surpassed the FOMC’s target; Personal Consumption Expenditures are at 1.41%, below target but showing signs of strength; and while the third target of global growth is spotty, focus is more closely centered on expected policies of our new administration.
The FOMC has identified three potential rate hikes in 2017, moves that would increase the overnight cost of funds to 1.375% from the current level of 0.625%. With that in mind, this Financial Times chart projects rates out to 2020, and a target of 2.0%.

The Week Ahead
- Tuesday: Announcement of the SBA 504 program’s January debenture sales, and the Institute of Supply Management report is expected to be positive
- Wednesday: the release of minutes from the FOMC’s December 14 policy statement
- Thursday: pricing of SBAP 2017-10A and 2017-20A
- Friday: Non-Farm Payroll Report is expected to be +175,000 with the Unemployment Rate unchanged at 4.6%
The Year Ahead – will be driven by these topics:
- Will stock markets and banks be disappointed by expected regulatory changes?
- How will the UK and European Union manage Brexit?
- Are the OPEC production cuts sustainable?
- Will the Fed maintain their projected “dot plot” for three rate hikes?
December 19, 2016
Let the trend be your friend – reinforced bearishness as Treasury rates rose for the sixth consecutive week, with the two-year Note reaching its highest yield since the financial market collapse (1.26%). Equities and US$ rallied, bonds and commodities sold off, though with reduced volume as holiday staffing has already been introduced to the markets. At some point, substantive detail for regulatory and legislative change, as well as higher inflation readings, are needed to support this move. For now, we are light on data into year-end and yield seekers have been in short supply.

A couple of points on rates:
- One reason why US rates are not lower by comparison to other sovereign debt is the cost of the currency swap to buy the bonds, an expense that severely reduces their yield for foreign buyers.
- German two-year yields are so negative because the ECB eliminated the yield floor on its monthly purchases, thereby pushing short-term yields to historically low, negative levels.
- Even with continued foreign demand at Treasury auctions, it is happening without one of the largest foreign buyers – China, which has been a net seller over the last 16-months.
- Another less frequent participant has been Saudi Arabia, as they reevaluate conditions following passage of the law permitting nationals to be sued for involvement in 9/11.
Fixed vs. Floating - As rates rise, with the international benchmark lending rate of 3-month Libor trading at 0.997%, a flood of money has found its way into loan funds, as investors seek out the higher income paid by floating rate loans, unlike fixed rate debt. Bank loan funds have counted more than $3bn of inflows over the past two weeks, the greatest haul for a two-week period in more than three years.
The Dot Plot - during her recent press conference, Chairwoman Yellen identified expectations for three rate increases in 2017, vs. the previous projection of just two moves. It is that additional hike that pushed yields to their recent high, but this Financial Times chart shows its survey of 31 economists that identified June as the next likely increase, with only one more to follow. Such a pattern would be reminiscent of the Fed’s projection of four rate hikes in 2016, with last week’s move being the only one.

The Week Ahead – will certainly include Fed speak and has housing data, plus:
- Durable Goods expected to decline after a sharp 4.8% increase in October
- GDP’s third revision for 3Q16, last updated to 3.2%
December 12, 2016
A quiet week in the rates market until Thursday, when Mario Draghi announced an extension of the European Central Bank’s Quantitative Easing program at the same time he announced a reduction in the principal amount of monthly bond purchases. The latter point won out as the market sold off towards its 2.50% support level, in anticipation of the FOMC’s policy announcement this Wednesday at 2:00.

The week in review – was very light on economic data but did show increases in Consumer Spending and Consumer Sentiment.
- The ECB left its benchmark interest rate at zero and will continue to charge 0.40% on deposits.
- The Dow Jones index continues to set record highs as it approaches 20,000, and oil remains strong in the aftermath of OPEC’s planned production cuts.
- Investors have pulled $6.5 billion from bond funds in the last six-weeks and as of November 23, the spike in rates equaled $6.5 billion in unrealized losses for banks. This does not affect bank earnings and will be offset by increasing net interest income.
2016-20L was priced at 2.81%, +41 bps to Treasuries vs. the 12-month average of 2.33% at +56 bps.
The Treasury curve continues its bear market steepening, having widened 14 bps in the last two-weeks, to +133 bps.
The week ahead – delivers the long-awaited interest rate hike from the Fed. It would be a shock if there was no change and it seems the increase is already baked into the markets, at least in the front end of the curve.
- Producer Price Index expected to be +0.2%. YTD, it is +0.8%; +1.2% ex food & energy
- Retail Sales consensus is +0.4%
- Industrial Production expected to be flat to -0.2%
- FOMC meeting (2:00) and press conference (2:30) on Wednesday
- Consumer Price Index is expected to be +0.2%. YTD, it is +1.6%; +2.1% ex food & energy
- Housing Starts expected to weaken after a spike in October
December 5, 2016
Hesitant seems the best word to describe last week’s market activity:
- Treasuries recovered slightly from their mid-week lows, helped by month-end buying from portfolio managers
- S&P 500 Index weakened 1%
- Oil showed continued strength on the back of an OPEC production cut
- US$ remains elevated, though it weakened slightly late in the week

Recent volatility is not new as this WSJ chart below identifies the frequency of 1% rate increases, dating back to the financial market collapse.

The Trump effect is still being felt as fear of inflation, not inflation itself, has asserted itself. And now, Treasury designate Mnuchin has proposed issuing debt longer than thirty-years to fund infrastructure needs.
The week in review
- November was the worst month for Treasuries in seven-years
- Home prices showed a 5.5% gain Y/Y
- Personal Consumption Expenditures are +1.4%, the highest rate in two-years
- Non- Farm Payroll came in at +178,000 with the Unemployment Rate dropping to 4.6%. Good news, but with a couple of caveats: wage growth declined 0.1%, and the improved Unemployment Rate was the result of 225,000 leaving the work force
- A UK indicator of inflation was an auction for £2.25 billion of a 40-year inflation linked bond. It was 4X subscribed and sold at a rate of negative 1.46%!
The week ahead is relatively light on reports and issuance.
- Factory Orders are expected to rise 2.7% after a previous 0.3% gain
- The High Court in the UK deals with Parliamentary need to vote on Brexit
- The ECB meets Thursday to outline the third phase of its Quantitative Easing program
- Treasury issuance is restricted to $82 billion of Treasury Bills
- On Thursday, we price 2016-20L, for settlement on the day of the FOMC’s expected interest rate hike
November 28, 2016
Does this matter?
At 2.36% yield, CT-10 is at the largest premium to the S&P 500 index in over a year, yielding 2.36% vs. 2.11%. Price action this month points the issue to its steepest monthly decline since January 2009, and it remains oversold.

The answer should be yes, as investors (insurance companies and pension funds, in particular) have been starved for yield and this month’s selloff has preceded December’s almost certain rate hike. That FOMC meeting’s announcement is scheduled for the day our December sale closes, December 14th.
Last week’s supply of intermediate term Treasury debt was met with strong foreign demand and $US denominated debt maintains its wide spread to other global bonds. The longest dated of the three Treasury auctions, a 7-year maturity, saw the greatest foreign demand – 71%, and the $28 billion auction was 2.7X subscribed.
The week in review - was highlighted by the Treasury auctions, release of the November FOMC minutes, and a strong Durable Goods report occurring in a holiday shortened week.
- The Treasury auctions saw indirect (foreign) bidding account for 55% of the intermediate- term note supply.
- Release of the Fed minutes indicated most officials believe a rate increase could become appropriate “relatively soon”.
- Durable Goods was +4.8%, mostly due to stronger demand for commercial aircraft.
- A Financial Times article noted that “with a rise in mortgage rates above 4% the Mortgage Bankers Association’s market composite index, a measure of mortgage applications, rose 3 per cent but was weighed down by a decline in the volume of consumers seeking to refinance existing home loans. The drop in refinancing volume was largely because many homeowners had already refinanced at lower rate.” Overall, applications from homebuyers jumped 19%.
This week – has more Fed speak, plus these reports:
- 3Q16 GDP will have its second revision; last reported as +2.9% it is expected to increase slightly
- Personal Income & Outlays reflects consumer spending and is expected to be +0.2%
- Friday’s Non- Farm Payroll report should maintain its solid growth with a gain of about 170,000, with the Unemployment Rate unchanged at 4.9% and average hourly earnings showing a gain of +0.2%
- Treasury auctions consist of short-term T-bills only
November 21, 2016
Gradual might have been the Fed’s intent, but 98 bps in four months is how much we have moved since July, with no change in Fed policy; and that is certain to change on December 13th at the conclusion of the FOMC’s next meeting. The upward trend in rate that accelerated after the November 8 election was enhanced late last week by Fed speak: comments from Janet Yellen to Congress that a rate increase could “become appropriate relatively soon,” and the NY Fed President, William Dudley, who stated, “some further evidence” of inflation indicates the Committee’s inflation target is in reach.

The above chart reflects the weekly close for our benchmark ten-year Treasury, closing Friday well above its 50-week, and comfortably above its 200-week average. What the bottom chart shows is the “moving average convergence divergence” indicator that traders reference for when markets might be overbought or oversold. A definition of it is “moving average convergence divergence (MACD) is a trend-following momentum indicator that shows the relationship between two moving averages of prices, functioning as a trigger for buy and sell signals.” By no means does it guarantee a correction since the current trend could continue, but it does indicate this market is oversold and rates are likely to decline somewhat. The qualifier somewhat was added because starting today the Fed will conduct auctions totaling $173 billion of Treasury debt, closely split between short-term T-Bills and longer term notes.
An indication of how sudden this move has been are the last three 20-year sales, plus an indication of what a sale could have been, if priced last Friday:
| 20-year series | September | October | November | If 11/18/2016 |
| Rate | 2.03% | 2.21% | 2.57% | 2.82% |
The week in review - adding substance to the Fed comments were mostly strong economic reports:
- Retail Sales rose 0.8% and September was revised up to +1.0%, representing the best two-month stretch of sales in 2-years
- Industrial Production was flat but mining production surged
- Consumer Price Indicator was +0.4% and Y/Y is +2.2%, though ex food & energy it is +1.6%
The week ahead – contains some reports on housing, and a durable goods report, but even though the market requires no more assurance of a December rate hike, we do get a Wednesday release of minutes from the meeting that concluded on November 2nd.
November 15, 2016

Tantrum Redux
On the day after the election we saw market divergence as stocks rallied and bond yields surged, moving the benchmark ten-year Treasury yield dramatically higher, and increasing our 2016-20K to a rate 36 bps higher than in October. Wednesday’s jump in yield was the biggest one-day increase in three-years, partly affected by an auction for $23 billion of the benchmark ten-year Treasury note, and strongly influenced by the president elect’s intended infrastructure spending and tax cuts. The move to higher yield was then enhanced by Thursday’s auction of $15 billion thirty-year bonds and has continued into today’s opening, with CT-10 at 2.23% and the 30-year bond reaching 3.0% for the first time since January.
Where to begin, and how soon?
It is obligatory for newly elected presidents to have a 100-day plan and Mr. Trump’s challenge will be how to prioritize his objectives:
- Immigration controls
- Full, or at least, partial repeal of Dodd-Frank legislation
- Dismantle Obamacare, at least most of it
- Renegotiate foreign trade agreements
- End the Federal Reserve Bank’s cautious monetary policy
- Fund the planned infrastructure stimulus
It is the last item that framed the recent move higher in rate and is also linked to Mr. Trump’s criticism of Fed policy. Chairwoman Yellen has repeatedly advocated a gradual increase in rates but legislative changes could challenge that approach. A key determinant will be how infrastructure spending is realized: an anticipated increase in Treasury funding contributed to last week’s move but Trump advisors have proposed private equity can fund projects in exchange for significant tax breaks. That approach believes the loss of tax revenue would be recouped by increased taxes realized from construction workers, plus increased tax revenue from contractors. And then there is the “deemed repatriation” of foreign profits, as much as $2.5 trillion. Relaxing the current tax rate on that could account for at least some of the required spending. It is important to note that infrastructure projects take considerable time to plan and initiate and most are done at the state and local level, making federal involvement even more complex and time consuming.
Although the Fed’s PCE model of inflation remains below its 2% target, fiscal stimulus in a tight labor market can result in inflation which, in turn, is harmful to bond investors. The type of inflation that could result is called “demand-pull” because it occurs when there is too much spending in an economy that can produce only so many goods and services.
Yields have moved sharply higher twice in the last three years, only to reverse course when conditions did not sustain economic improvement. It is improbable that we revisit dramatically lower rates and structural change is still many months away, but market sentiment has definitely shifted due to Mr. Trump’s mix of economic stimulus and protectionism that is expected to foster faster growth and inflation. With ten-year yields 50 bps higher than one-month ago the market has already priced in more than next month’s anticipated rate hike and steepened the curve, so we should see some stability but that will be influenced by the new administration’s announcements.
The Week Ahead – lots of Fed speak, including Janet Yellen’s Thursday testimony before the Senate’s Joint Economic Committee, plus speculation on President elect Trump’s agenda.
- Tuesday, Retail Sales, last month was +0.6%
- Wednesday, PPI was +0.3% last month; and Industrial Production was +0.1%
- Thursday, CPI was +0.3% last month, and Mr. Trump meets with Shinzo Abe, the Japanese Prime Minister, to discuss the two country’s alliance and the Trans Pacific Partnership that Japan’s Parliament approved last week and which Mr. Trump plans to void.
November 7, 2016
Randomness of Consequence
As we approach Tuesday’s Presidential election markets are at odds with each other: stocks ended last week with eight consecutive down days while Treasuries held firm, and even rallied. There is much speculation about the impact of either party’s victory as analyst’s debate the potential policy changes which, of course, will depend not only on the presidential vote but also the composition of Congress.

The Week in Review
- The FOMC did not change rates on Wednesday, but did offer muted encouragement for a December increase, estimated to be 76%
- Non-Farm Payroll came in below forecast at 161,000 but the previous two- months were revised upward by 44,000
- The Unemployment Rate declined to 4.9%
- Wage growth improved to 2.8% Y/Y
- The UK’s High Court has complicated the country’s withdrawal from the European Union by declaring an exit needs to be voted on by Parliament; so much for vox populi. The Prime Minister’s government plans to appeal the ruling and proceed with submitting Article 50 by March 2017.
The Week Ahead
- What else matters? Tuesday’s election will dominate the week and is also the day we announce the program’s November sales for 2016-10F and 2016-20K.
- As if the election results won’t be difficult enough to deal with, the Treasury will auction $62 billion of term debt, starting on Tuesday. Of particular interest is the sale of $23 billion benchmark ten-year notes on Wednesday, the day before we price. This supply, and investor demand, will strongly influence Thursday’s pricing.
October 31, 2016
Bonds on the Run
With one trading day left on All Hollows Eve, the ten-year Treasury yield has risen 25 bps since the end of September, marking the worst monthly performance for bonds in three years. Contributing factors have been: The Bank of Japan establishing a floor for its longer-term yields; the European Central Bank offering tepid encouragement for extending its bond purchase program; UK inflation unexpectedly rising; a stronger than expected report on 3Q16 GDP; and increased bond issuance in Europe.

Economic reports last week supported domestic growth and that helped to soften the market.
- New Home Sales were +3.1%, though July and August were revised down
- UK GDP rose 0.5%, ahead of expectations and that pushed bond yields higher
- Durable Goods were -0.1% but August was revised up from 0.0% to +0.3% and Y/Y is +1.8%
- 3Q GDP came in at +2.9%, far above forecast and significantly better than +1.4% in Q2
- Worker pay rose 0.6%
This isn’t the first time we have seen an improved quarterly report, as evidenced by the uneven performance dating back to 2009, but it seems the market senses more contributing factors to support a change in Fed policy. Whether it is a one-off move like in December 2015 is what will keep the market guessing.
October 24, 2016
A very quiet week with a lot of Fed speak and economic reports that were mostly flat.

A combination of Federal Reserve Bank Presidents, Governors and a Vice Chairman contributed more support for gradual rate hikes “if the economy is in good shape.” Adding to this theme of caution was Mario Draghi, President of the ECB, who hinted at extending the bank’s bond purchase program.
The takeaway from this is ten-year rates are sitting at their 200-day Moving Average (almost the same rate from which 2016-20J was priced) and decisively range bound.
Last Week’s Events
Industrial Production and CPI came in as expected while Housing Starts showed a 9% decline, primarily because the volatile multi-family sector was down a dramatic 38%.
The Kingdom of Saudi Arabia found strong demand for its $17.5 billion offering of 5, 10, and 30-year debentures. The sale was almost 4X oversubscribed at spreads very attractive for a AA credit. One example is their 10-year series was priced at 3.40%, + 164 bps to CT-10. This is the first of many offerings that are expected to total $125 billion as the Kingdom looks to diversify an economy that is less dependent on oil exports.
The Week Ahead
- The Treasury will auction $181 billion in securities, mostly in short-term Bills
- CMBS will begin to see an increased calendar of offerings in Q4, and this could put pressure on rates
- Durable goods orders are expected to remain flat
- Q316 GDP is expected to be +1.4%
- And, there will be more Fed speak as we approach the Committee’s next meeting that is one-week before our presidential election
October 17, 2016
Last week saw a continued erosion of investor confidence due to the release of FOMC minutes from the July meeting, new Treasury debt, a continued sloppy market for stocks, and sustained weakness in the British pound as the UK prepares to negotiate its EU exit.

The benchmark ten-year Treasury rose 8 bps, closing above its 200-day Moving Average of 1.75% and at its highest close yield since late May.
Fed minutes confirmed the decision to hold rates steady was a close call (7-3), but the vote was more divided than originally thought. The members voiced concern about labor market slack being affected by continued low interest rates, stating “a reasonable argument could be made to hike rates.” Such a policy change is unlikely before the November 8 election, but December is looking more certain.
Prices for US, German, and UK 30-year debt are on track this month for the steepest decline in a year. Yield increases of about 23 bps reflect investor concern with diminished central bank stimulus.
Exit, Stage Left – as the British pound weakens ahead of the UK exit negotiations.
- Money managers invested in European stocks saw $1.1 billion of withdrawals last week, the 36th consecutive week of outflows
- European bond funds were hit with $2.2 billion of outflows
- Not to be left out, Money Market funds had $56 billion of withdrawals as Money Market reform is set to begin on Friday
Where is the money going? One beneficiary of this trend is government money market funds, which invest only in government assets. Their total assets now stand at $2.1 trillion, up from $1.1 trillion in January.
The week ahead– is pretty light on economic reports.
- Industrial Production is expected to show a gain of 0.2% after a previous report of -0.4%
- Existing Home Sales have not been as strong as new Home Sales (possibly because of reduced inventory) but should be +0.4%
- In other news, Saudi Arabia is expected to launch the first $10-20B of debt sales, an initiative that could eventually reach $120B. The expected pricing could be in the range of +150 to Treasuries and bankers already expect a strong over-subscription.
October 11, 2016
The market for CT-10 was unable to break through its 50-day Moving Average and now sits just below its 200-day Average.

There is rarely one reason for any event and we can look at several items that contributed to this recent move:
- The Bank of Japan announced a modification of its QE policy to set a floor for long term interest rates. Japan has the largest amount of bonds trading at zero or negative yields and hopes to assist the country’s banks improve performance by assuring a positive yield curve; one where short-term rates are below long-term rates. Such a relationship would keep rates paid to depositors below rates charged to borrowers, thereby improving the spread that banks can earn
- French President Hollande called for tough Brexit negotiations in response to recent comments by UK Prime Minister May
- Mrs. May had identified a strong stance on immigration, something that will further distance the UK from access to the single market of the EU. Such a move contradicts the Union’s commitment to Freedom of movement for – people, capital, goods, and services
- Additional comments from an advisor to Mrs. May favored the government moving away from an easy monetary policy and planning to increase borrowing to invest in infrastructure
- And then there was Friday’s “flash crash” for the pound – a 6% decline vs. $US in just two-minutes (partially reversed), leaving the currency down 17% since the June vote to leave the EU.
But, these events occurred later in the week, after bonds had already weakened in the face of new supply. If Japan is going to set a floor for long-term rates, and the UK might increase issuance, and the ECB has cautioned that it may not increase its monetary easing, then the market will become more cautious for reasons like the ones outlined by Martin Feldstein in in Op-ed piece in Thursday’s Wall Street Journal. Mr. Feldstein was chairman of the Council of Economic Advisors under President Reagan and is currently a professor at Harvard. Key points in his piece “Why the Fed should raise rates now” are:
- Asset valuations are too high; the Price/Earnings ratio of the S&P 500 is now around 25%, about 60% higher than its historic average
- Commercial real estate prices are up about 10% per year for the last five-years
- At 2.45% the 30-year bond is almost equal to current core CPI, whereas historically it has exceeded the inflation rate by about 2%
- Prices of Emerging Market bonds are up more than 40% since 2011
Professor Feldstein added: “Abnormally low interest rates are also inducing banks and other lenders to reach for yield by lending to lower-quality borrowers and granting loans with fewer restrictions. If an asset-price correction causes an economic decline, these high-risk loans will suffer and the banks and other lenders will be in trouble. The current low bond rates have also removed the usual pressure on the government to deal with budget deficits. The debt-to-GDP ratio has more than doubled over the past decade, rising from 35% to 75%.”
The week in review:
- Institute of Supply Management – report on Monday showing a rise to 51.5 indicates an expanding economy and was identified as setting a bearish tone for the week
- Friday’s Non-Farm Payroll report of +156,000, with a rise in the Unemployment Rate to 5.0% was below expectations, but more people were seeking work
- DCPC 2016-20J was priced Thursday at a rate of 2.21%, reflecting the softness in the market as rates backed up, but is still below the 12-minth average rate of 2.34%
- Consumer Credit in August grew at 8.5%, its largest increase in a year
The week ahead
- More Fed speak; with Treasury auctions of $138B T-Bills & $56B Notes
- Wednesday has the release of minutes from the Fed’s July 21 meeting where several governors dissented from holding policy unchanged, and this chorus is getting louder
- Friday has PPI which is expected to show an increase of 0.1-0.3%; and Retail Sales expected to reverse recent softness with a gain of 0.4-0.9%
October 3, 2016
The market made some attempt to rally but global concerns for Deutsche Bank, and skepticism over an OPEC agreement to cut production, combined to remove the momentum. Month-end buying on Friday helped stocks recover to where they started the month, while Treasuries gave ground to close the week better by just 2 bps.
The closing level for CT-10 is 4 bps above where we priced in September, and rests just above its 50-day Moving Average.

The week in review – modest continues to be an apt description for economic reports.
- 2Q16 GDP was revised up by .01 to 1.3%
- New Home Sales were down a bit but continue ahead of last year’s pace
- Durable Goods orders were flat but July’s level was revised down by .08%
- Personal Consumption Expenditures (the Fed’s preferred inflation indicator) was +0.1%, + 1.0% Y/Y but +1.7% Y/Y ex food & energy
- CMBS supply has pushed bond spreads slightly wider
- In response to Wells Fargo’s fraud accusations, California has suspended doing business with the bank for one-year
- Brexit update shows the UK will trigger its withdrawal from the EU by submitting the Article 50 document no later than the end of March
The week ahead –
- The Treasury sells just $78 billion of short-term Bills
- Monday has the Institute of Supply Management report that should show some growth after August’s decline
- Thursday is pricing day for the 504 program’s sale of 2016-20J
- Friday is Non- Farm Payroll, expected to show an increase from the previous report of +151,000, with the Unemployment Rate expected to decline to 4.8%
September 26, 2016
No Change – in Fed policy resulted in modest gains for both bonds and stocks, while probably increasing the risk appetite of investors.
The benchmark ten-year Treasury improved by 8 bps on the week to close at 1.62%, 7 bps above where 2016-20I was priced, and should see some resistance at the 50-day Moving Average of 1.59%. The week’s performance was the best for this benchmark since late July.

Demand for Treasury debt will be tested this week with $88 billion of two, five, and seven-year notes being auctioned.
As for a future rate hike, the FOMC has two more meeting this year, with the pre-election November meeting unlikely to produce a change. But Wednesday’s no change announcement was not unanimous, and that is a reason why there is a 54% probability for a change after the December 14th meeting. Dissenters point to strong employment data with more people seeking work, and believe the Committee should not keep interest rates this low any longer. Their shared concern is that a rate increase now will commence a gradual path to higher rates and prevent the potential need for a rapid series of future increases.
The other central bank announcement last week came from the Bank of Japan which affirmed its zero interest rate target for its ten-year bonds.
The Week Ahead
- More Fed speak
- Durable Goods on Wednesday will maintain its erratic, up-down monthly performance, with expectations for a decline from July’s strength
- 2Q16 GDP revision will be released on Thursday and is expected to be revised up by .02, to 1.3%
September 19, 2016
Apple Inc. shares posted their best gain in five-years, up 11% on the week, as stocks in general, and also bonds, marked time. Marking time in advance of multiple central bank meetings this week; the Fed’s Open Market Committee in particular. They meet Tuesday and Wednesday with an update of their latest economic forecasts and the Bank of Japan has a similar schedule.
Central Bank Scorecard
Federal Open Market Committee
- On target with employment
- Below target on inflation
- Wary of global economic strength
- Market sees a 15% chance of an interest rate hike at this meeting
European Central Bank
- Started a selloff in bonds two-weeks ago by not voicing stronger support for further stimulus
- Now buying Corporate bonds in addition to sovereign debt
Bank of Japan
- Continues to support negative interest rates
- Program has prompted neither economic growth nor inflation
- Nearing the limit of its stimulus package, having purchased $800 billion of bonds annually since 2014, yet just witnessed its 30-years’ yield rise 50 bps since June
The capital markets would appreciate a rate hike; banks and insurance companies in particular, as they have been forced to seek riskier investments due to the low rate environment of the last four-years.
Last Week
- Fed Governor Brainard’s speech was more dovish than expected
- Middle class incomes grew faster in 2015 than any year in modern history
- Oil continues to weaken due to high production levels and weak demand
- Retail sales fell 0.2%, consumer spending has fallen off from the 2Q16 levels
- Industrial Production fell 0.4% with declines in manufacturing offsetting growth in hi-tech and mining
- Consumer Price Index showed a gain of 0.2%, while ex food & energy was +0.3%.
The Week Ahead
- Some housing data, but it’s all FOMC. A 2:00 Announcement with Economic Forecasts on Wednesday, with a Janet Yellen press conference at 2:30. The Bank of Japan will have its own announcement, but analysts are skeptical for anything more than a statement defending its negative interest rate policy.
September 12, 2016
A rather quiet week changed quickly after ECB President Mario Draghi announced no fresh stimulus and his comments were interpreted as indicating there could a cutback in current support. Market response was delayed (fortunately for our debenture sale) and kicked in on Friday with rates continuing to rise and equities suffering their first 1% selloff in two-months.

By Friday’s close, our benchmark U.S. Treasury rate had increased 11 bps from when we priced on Thursday, moving it sharply above its 50-day Moving Average of 1.54%. Friday’s price action continues this morning with global equity and bond markets in decline.
Fed Speak got Louder
While it was Mr. Draghi’s comments that put the market on notice, it was a Friday comment from the usually dovish Boston Fed President, Eric Rosengren, that accelerated the rate rise and a nearly 400-point decline in the DJIA.
Additional Fed sentiment may be provided by Fed Governor Lael Brainard in a Monday afternoon speech, just before the pre-meeting blackout period for commentary begins on Tuesday. The FOMC meeting is September 20-21, and while recent Fed speak has put the market on edge, it seems odd that Federal-funds futures show just a 24% chance of a U.S. interest-rate rise in September, rising to 55% by December. The takeaway from that is the market is probably overbought.
More than $13 trillion of global debt remains at negative yields but some longer-term maturities are easing back; like German bunds (10-year maturity) that regained positive territory, and JGB’s (Japanese 10-year notes), which are only -0.02% after trading as rich as -0.27%. An interesting development about Japan’s market is that in time the BoJ could run out of securities to buy. The bank already owns one-third of the country’s outstanding debt and though there is sufficient supply to accommodate near-term purchases, banks need to hold these high credit assets and may be reluctant to accommodate the central bank’s continued demand.
Last Week - was highlighted by the above mentioned official comments, but also included the program’s September debenture sales.
Demand remains strong for the product and fortunately, both issues were priced before the selloff.

The Week Ahead - contains just one-day of Fed speak but the Bank of England will have a Thursday announcement regarding its monetary policy, which is expected to be unchanged.
Retails Sales - is Thursday and growth is expected to continue June and July’s slow pace.
Industrial Production - follows solid gains in June and July but is expected to be in the 0-+0.4% range
CPI - is Friday and while its year-over-year rate (ex food & energy) is +2.2%, August is expected to be flat to +0.2%.
September 6, 2016
“Not Too Fast, Not Too Slow, but Not Quite Right, Either”
reads the headline of a NY Times article, and it captures the status quo element of Friday’s jobs report. With a gain of 151,000 and an unchanged Unemployment rate of 4.9%, the report came in below forecast and dampened confidence of a rate hike at the FOMC’s September 20-21 meeting. Details of the report are:
- An unimpressive 0.1% increase in average hourly earnings
- A slight decline in the average workweek to 34.3 hours
- Labor Force Participation Rate is unchanged at 62.8%
- Renewed softening in goods producing industries: Manufacturing and Construction hiring declined and Mining declined for the 23rd consecutive month
The report does not rule out a policy change as the year-to-date monthly average is 182,000, below that of previous years but strong enough to keep hiring near the FOMC’s goal. Market reaction was muted with both stocks and bonds relatively unchanged on the week.
Productivity has also shown the biggest one-year decline since 2013, down to a seasonally adjusted annual rate of 0.6%. Performance like this, as well as low inflation, contribute to the Fed’s hesitance to raise rates.

As a result of this low output, the cost of producing goods and services has risen for many companies and cut into profits despite rising sales. Unit-labor costs jumped a revised 4.3% in the second quarter vs. an initial 2% reading.
Global demand for assets – remains strong as Blue Chip Corporate issuance has surpassed $1 trillion year-to-date and the sector has rewarded investors with a 9.5% gain, vs. a loss of 0.9% last year. Asian demand for an initial $15 billion offering by Saudi Arabia is so strong the kingdom will schedule additional sales to follow. Formal announcement will not be until later this month for sale in October.
The week ahead
- More Fed speak
- Light on economic data, with some manufacturing reports
- Thursday pricing of 2016-10E and 20I, expected to total about $335MM, at rates slightly above the last series sales.
August 29, 2016
The reaction was muted, and not immediate, but rates did rise Friday after Chairwoman Yellen made a stronger case for an interest rate rise in her speech at Jackson Hole.

As usual, her comments were hedged, making any decision dependent on continued improvement in jobs reports (like this Friday’s) and no setbacks in inflation and economic growth. The Committee appears committed to a rate hike but is sensitive to timing as it will meet three more times this year and the Financial Times has increased its probability of a 2016 rate hike to 80%, from 70% before Friday’s speech.
Last week – again saw mixed reports.
- New Home Sales surged 12.4% in July
- Existing Home Sales declined 3.2% and are down 1.6% Y/Y. Thin supply is a factor in this report
- Durable Goods Orders rebounded to a +4.4% gain vs. a -4.2% report for June
- GDP’s second estimate of 2Q16 growth was revised down 0.1 to +1.1% but it revised upward by .02 to 4.4% the Y/Y/ growth rate in consumer spending
The week ahead – includes more Fed speak, plus:
- Monday – Personal Income & Outlays is expected to be +0.3% but with little change in the FOMC’s Personal Consumption Expenditures index
- Thursday – Institute of Supply Management us expected to hold steady at a moderate 52.2
- Friday – gives us the jobs report for August which should show a decline from July’s 255,000 count. It is expected to be near the three-month average of +185,000 and possibly show a decline in the unemployment rate to 4.8%
August 22, 2016
On Your Mark?

In keeping with the Olympic spirit, this Market Watch photo illustration has Chairwoman Yellen poised to signal a restart to the Bank’s rate increases, and identifies this Friday’s speech at Jackson Hole as a possible venue for that intent. Hiring, inflation and growth are the metrics for any rate hike, and though inflation and growth remain below target, more analysts are expecting a rate hike this year. Probably in December, but possibly in September if job growth remains robust. It is highly unlikely the Fed would move in November ahead of the election.

There was some pressure on rates last week, mostly from Fed speak, with two Bank Presidents indicating the Committee is “getting closer to the time it would be appropriate to raise interest rates.” Adding to this hawkish talk was a Sunday report in the Financial Times quoting Stanley Fischer, Vice Chairman of the Federal Reserve Bank’s Board of Governors, saying “We are close to our targets. Not only that, the behavior of employment has been remarkably resilient.”
The minutes from the July FOMC meeting showed mixed support for a rate hike, and followed the Consumer Price Index release. CPI headline number was zero, but that was dragged down by a 1.6% decline in energy prices. Ex food & energy the index was +0.1% and the Y/Y rate was +2.2%.
The week ahead - has Treasury selling $175 billion in short-term Bills and intermediate-term Notes.
- Home sales and Housing starts
- Durable Goods that is expected to be +3-5%, offsetting June’s report of -4.0%
- GDP on Friday is the second estimate for 2Q16 growth and probably will be unchanged at +1.2%
- UK GDP is expected to show a 0.6% increase and Germany a 0.4% increase
August 15, 2016
July’s NFP report of +288,000 caused a spike in rates, but even with that rise 2016-20H priced at the same debenture rate as July’s 2.04%, below the program’s 12-month average of 2.59%.

Rates are being held down by:
- Non-Farm productivity declining 0.5%, the third consecutive quarter of declining productivity, the longest stretch since the late 1970’s. This lack of growth has been identified by Janet Yellen as a “key uncertainty for the U.S. economy.” Annual growth for 2007-2015 is 1.3%, half the 2.6% rate for 2000-2007.
- Bank of England failed to buy the desired amount of bonds in its reverse auction as domestic pension funds are reluctant to sell high quality assets. A very understandable attitude since 30-year Gilts have returned 18.8% in just the last two-months. The bank’s QE program is just the latest initiative that has pushed $13.4 trillion of sovereign debt, and now highly rated corporate bonds, to higher prices and negative yields.
- A $23 billion ten-year Treasury auction that saw 73% of it awarded to foreign investors the day before pricing 20H. This private sector, foreign demand is a direct result of the Bank of England, the Bank of Japan, and the European Central Bank pursuing their Quantitative Easing programs.
And then on Friday, Retail Sales were reported to be flat in July, and just +2.3% Y/Y. Department store sales declined 0.5%, while e commerce sales rose 1.3%. An indication of this disparity is Macy’s, the nation’s largest retailer, announcing the closure of 100 of its 728 stores. Following this release, Producer Prices came in at -0.4%, -0.2% from a year ago. This report will influence Tuesday’s Consumer Price Index report that is now expected to be flat.
The week ahead – will focus on Wednesday’s release of the minutes from the July 27 FOMC meeting.
August 8, 2016
Is a rate hike back in play?
Perhaps in December if employment gains continue, and global economies improve, yet the probability of a September change has increased to 40%.
- Friday’s stronger than expected jobs gain of 255,000 confirms that job growth, and the unemployment rate, are at targets set by the FOMC.
- Inflation, running far below the targeted rate of 2.0% is stubbornly low, but wage growth increased 0.3% in July and is +2.6% Y/Y.
- The Committee’s third consideration is global stability, which is still tentative as evidenced by the Bank of England reducing its overnight rate to 0.25% (the lowest in history); expanding its Quantitative Easing program by £60 billion, and also adding corporate bonds to its buying program. This is a direct response to the Brexit vote and was accompanied by the bank’s caution for higher unemployment, slower growth, and higher prices.
The WSJ chart below identifies the projected domestic inflation rate as implied by the yield on ten-year TIPS – Treasury Inflation Protected Securities. These securities have semi-annual inflation adjustments that are determined by the CPI, and paid out at maturity. With this projection it is obvious the Fed is unlikely to see inflation hit its target anytime soon.

You would have to dig deep to find anything negative about Friday’s NFP report that sent domestic stock indexes to record highs, but wage growth is probably the weak link. At 2.6% annually it is showing strength but remains well below its 2009 level. Additionally, job expansion is running about 1.7% annually, similar to projected GDP growth and that indicates productivity is not growing. The previous week’s report of +1.2% 2Q16 GDP identified the third consecutive quarter of declining capital investment and is a contributing factor to reduced productivity.

One question a skeptic might ask is – how is the financial services category adding jobs when banks and insurance companies (like Met Life taking a $2 billion charge to its variable annuity business) are cutting jobs to reduce costs due to this low rate environment?
The week ahead
- 2016-20H is priced on Thursday.
- Treasury to sell $62 billion of intermediate and long-term debt with $23 billion of our benchmark ten-year note to be auctioned the day before 20-H is priced. Last week’s 14 bps backup in rate should help create demand for the notes; emphasize should.
- Retail Sales and PPI are released Friday and are expected to be positive.
Last week’s spike in rates was headlined by the jobs report but there had been earlier pressure when weak demand for Japan’s ten-year note auction moved its rate from -0.27% to -.07%, starting a global selloff in sovereign debt. That is a reminder that even with central bank buying of these bonds investors are not fully committed to negative yields. Rate locking on new corporate issuance also helped to move rates higher.

Friday’s closing rate of 1.59% on CT-10 is 17 bps higher than when 2016-20J was priced.
August 1, 2016
GDP Disappoints – and rates decline
Expected to be more than double 1Q16’s report, not only did the 2Q report show just a 1.2% gain but 1Q was revised down to 0.8% from 1.1%. For the week, ten-year rates declined 12 bps to 1.45%, equities softened (though S&P 500 index gained 3.4% on the month), and $US also sold off, especially after the GDP release.

This WSJ chart shows the declining trend in our country’s output since 2Q15. A gain of 2.5% was the optimistic forecast, so the 1.2% gain leaves the first six months with an average gain of 1.0% compared to that period’s average gain of 2.0% since the recovery began in 2009.
The weakness was led by capital investment, down for the third consecutive quarter with a decline of 9.7%, as seen in the Financial Times chart below. Companies continue to cut back on structural spending like oil wells, equipment, and inventory. With regard to oil wells, oil prices have declined 20% since their June 8 peak, contributing to some of the world’s largest oil companies to report a quarterly profit at its lowest level since 1999 (Exxon Mobil), or its biggest quarterly loss since 2001 (Chevron).
Friday’s GDP report followed Wednesday’s release of minutes from the FOMC’s recent meeting, where the Committee again emphasized a gradual path for rate hikes but added “near-term risks for the economic outlook have diminished.” Modest wage gains and an increase in reports like the Employment Cost Index (+2.3% Y/Y) offer some encouragement to policy makers that a higher rate policy can buck the global trend, but the market remains skeptical. Though the probability of a December rate hike stood at 50% on Tuesday, it ended the week at 37%.

Brexit & Exit
European equity funds continue to see money leave, heightened by the uncertainty caused by the Brexit vote. YTD these funds have seen $76 billion withdrawn with the emerging Italian banking crisis contributing to the trend, as well as British consumer sentiment dropping the sharpest since 1990. The market that is benefitting from this is Emerging Markets, whose funds have attracted $14 billion in just the last four-weeks, and have rewarded investors with an 11% return for the year.
The week ahead
Monday – Institute of Supply Management report is expected to reflect moderate growth
Tuesday – the Fed’s preferred inflation indicator, Personal Consumption Expenditures, is forecast to show a gain of just 0.1%, while Personal Income is expected to be stronger
Friday – we play “guess your best “again with Non- Farm Payroll expected to show a gain of 185,000 after June’s +287,000 and May’s disappointing +38,000. The Unemployment Rate is expected to be unchanged at 4.9%
July 25, 2016
A quiet week in stocks and bonds amid ongoing global turmoil.

Ten-year Treasury yields rose slightly as did prices on most stock indexes. The week saw some interesting releases:
- No change in policy from the European Central Bank, which again stated it is ready to use all stimulatory tools at their disposal
- Existing home sales rose 1.1% in June to 5.570 million, seasonally adjusted annual basis. Median price rose 3.7%; 4.7% Y/Y
- Leading Indicators rose 0.3%, helped by low interest rates and declining unemployment claims
- Strong demand by global investors for $13 billion of ten-year Treasury Inflation Protected Securities, sold at a yield of 0.045%
The week ahead
- The FOMC meeting concludes Wednesday with no change in policy expected. The market does assign a 20% probability of a rate increase in September, and a 49% likelihood for December
- New Home Sales are announced Tuesday
- Durable goods orders on Wednesday are expected to rebound from a weak May number
- Preliminary 2Q16 GDP on Friday is expected to increase from 1Q’s 1.1% rate
Overall, the market continues to battle with conflicted issues of moderate domestic growth and global concerns; negative sovereign debt yields in particular. The Treasury will auction $172 billion of debt this week, consisting of $69 billion in T-Bills and $103 billion of term debt.
July 18, 2016
The ten-year Treasury yield increased 19 bps last week for the largest one-week rise in thirteen months. Market uncertainty that had been prevalent was displaced by factors like:
- The quick transition of power in Britain
- The Bank of England surprising markets by not lowering rates
- China reporting a 6.7% GDP rate
- Economic releases that were supportive though not overwhelmingly strong – PPI +0.5%; CPI +0.2%; Retail Sales +0.6%; and Industrial Production +0.6%. Some of this strength was offset by downward revisions for previous releases
- Expectations that 2Q16 GDP will be much stronger than 1Q’s 1.1%
- Domestic stock markets gaining as much as 2% on the week, while global exchanges gained even more. Japan’s Nikkei index is higher by 9.2% over the last five-weeks
- While it is unlikely the Fed will raise rates at its July 27 meeting, investors now assign a 40% probability of an increase for the December meeting. That is up from 12% just two weeks ago

Even in weakness, demand for the U.S. Treasury product remains strong, especially from foreign investors. Wednesday’s $12 billion auction of thirty-year debt at 2.17% was its lowest auction rate ever, attracting an oversubscription of 2.5X, with 68.5% of the total going to foreign buyers. With a majority of stocks offering a higher yield than Treasuries, it is clear how overpriced the market is, and how dependent the product is on demand from global investors whose debt is even more expensive.
Aided by the Brexit vote and the ongoing QE purchases by the BoJ and ECB, $13 billion of global debt now trades at negative yields, making US debt even more attractive when its yields increase.
The week ahead – is fairly light on economic data but we do get Housing Starts and Home Sales, plus a consumer sentiment reading in the EU.
July 11, 2016

By the numbers -
- June’s jobs report of 287,000 rebounded sharply from May’s 38,000 report and was helped by 35,000 Verizon workers returning from a work stoppage
- May’s report was revised downward to 11,000, and due to June’s surge is now considered an anomaly
- The Unemployment Rate rose to 4.9% but was viewed positively because more people entered the market looking for work
- Average hourly earnings rose to 2.6% Y/Y
- The number of people working part-time because they couldn’t find a full-time job dropped sharply, by 587,000
- The Labor Force Participation Rate inched up to 62.7% but remains low by historical standards
Last week ended with stocks rising towards a new record high and government bond yields closing at new, low yields. Though these two markets usually move in opposite directions ongoing central bank policies are supporting fixed income product while data points to more strength in the economy.

Last Week -
- The SBA 504 program priced its 20-year debenture at the second lowest rate in program history, 2.04%; providing small businesses with an effective cost of funds of 4.09%
- Seven UK property funds needed to cease trading as a Financial Times story cited a “vicious cycle of redemptions.” This asset class is illiquid in down markets and should be for long-term investors, not a trading vehicle
- Minutes from the June FOMC meeting confirmed the Committee is in a holding pattern, keeping its options flexible, and unlikely to raise rates at their July 27 meeting
This Week -
- The Treasury auctions $56 billion of term-debt
- Some “Fed speak,” plus several economic releases including PPI, CPI, Retail Sales and Industrial Production. Internationally, the Bank of England is expected to reduce its bank rate to 0.25% and China will report 2Q16 GDP.
July 5, 2016
Most stock markets rallied sharply late last week, with US markets up more than 3% for the biggest weekly gain of the year.

Ordinarily, that would mean bond prices would weaken but Central banks affirmed their intent to support easy money policies and while the “safe haven” trade lost some its momentum U.S. Treasuries remained well bid, ending the week at 1.44% after trading at an historic low of 1.38%. In early morning trading today we are revisiting 1.38% (a 37 bps improvement since the 6/23 Brexit vote) and stocks are wobbling.
British regret – Brits representing the Remain bloc marched on Saturday to show their support for remaining in the European Union but potential candidates to succeed David Cameron have stated there will be no second referendum and that they see no urgency to file Article 50, the trigger mechanism for leaving the EU. That assures markets of continued uncertainty, leaving the pound sterling under pressure and strengthening $US. The Bank of England has indicated it may cut rates this summer and the amount of global, sovereign debt trading at negative yields now totals $11.7 trillion. Part of that mix shows Japan selling new, ten-year debt at -0.25% and Switzerland’s 50-year bond is now at a negative yield. With the central banks in England and Japan committed to Quantitative Easing this amount will increase, leaving $US denominated debt as an attractive alternative for global investors.
Last week – saw Puerto Rico default on almost $1 billion of constitutionally guaranteed debt, Standard & Poors downgrade the UK’s credit rating to AA, and Italy is preparing to offer aid to a failing bank, Economic reports continue to be mostly positive:
- Wages grew 0.2% and Consumer spending increased by 0.4%
- Personal Consumption Expenditures grew at 1.6% Y/Y, still below the FOMC target of 2.0%
- Institute of Supply Management reported its fourth consecutive monthly gain and the fastest growth pace in thirteen-months. Recent strength in $US after the Brexit vote could be a problem for U.S. exports
- 1Q2016 GDP was revised upward to 1.1%
- Construction spending declined 0.8% in May but YTD spending is +8.2% vs. year ago levels
- Auto sales in June were at their slowest pace in thirteen-months
The week ahead – includes pricing for the program’s 2016 10-D and 20-G debentures on Thursday, for funding on Wednesday July 13. Important government releases are:
- Wednesday’s release of minutes from the FOMC meeting ended June 15. With Brexit happening subsequent to the meeting this release may not have as much relevance as it usually does
- Friday’s Non-Farm Payroll report that will show a rebound from May’s anemic report of 38,000. It is expected that 180,000 jobs were added and it is hoped that previous reports are revised upward
June 27, 2016
Against all odds – going into Thursday’s Brexit vote, Ladbrokes, the English bookmaker, placed a 90% probability on Britain remaining in the European Union. Though less costly than their 5000/1 odds against Leicester City winning the Premier League, this result will have significant influence on financial markets and global economies.
After rising earlier in the week global stock markets buckled on Friday as traders reacted to Britain’s decision to leave the European Union.

The vote was 52%-48% with 72% of eligible voters participating. A clear demographic was generational: 57% of voters ≥55 voted to Leave, while 57% of voters aged 18-34 supported Remain. Analysts identify this split as younger Britons having grown up in a period of European integration and liking it, while the older group seeks to reclaim their nationalist identity.
Issues to be settled
Trade – England would prefer to retain access to the EU’s single market but probably will have to negotiate bilateral trade deals, which could be costly and time consuming to negotiate
Immigration – perhaps the most compelling argument to Leave and one that might parallel sentiment in the U.S. presidential campaign. Existing EU nationals in the UK could remain but new entrants would no longer have the automatic right to work and live there.
Economy – the consensus opinion is that Brexit will hurt UK growth, at least short-term
UK composition - two years ago Scotland voted to remain but there is speculation they, and perhaps Northern Ireland, will seek membership in the EU themselves. Such a decision could further weaken Britain’s economy.
Lower, for a lot longer
The Treasury market had weakened leading up to Thursday and then had the sharpest one-day rate drop in five and one-half years. The chart below shows how the ten-year rate had traded as low as 1.57% in the week of June 20, then eased back going into last Friday. Treasuries will continue to be a “safe haven” investment while the impact of this vote and timing of the withdrawal continues to be evaluated. Likewise, the British pound will continue to weaken until there is more clarity or it simply becomes oversold.

Maybe, maybe not – the referendum took place because David Cameron promised it during his reelection campaign to appease the Brexit contingent of his party. While not legally binding, it will be interesting to see how long it will take for the necessary paperwork to be submitted. An Article 50 needs to be initiated by the UK and sent to Brussels in order to formally begin the process. While Mr. Cameron had previously said he would submit it the day after the vote, he decided not to submit it, offered his resignation, and will leave that task to his successor, who will probably not take office until October. It is that person who will be handed, in the words of one British writer, the “poisoned chalice.” Cameron has deftly identified the reluctance of any politician to be the architect of Britain’s departure from the Union. If that assessment is correct and Britain delays the paperwork (which triggers a two-year deadline once it is submitted) markets will face more uncertainty and remain unsettled. Such a delay could be offset by the insistence of some EU leaders who want Britain to act quickly, something even the Brexit leaders do not advocate as they prefer informal talks in order to negotiate the best terms.
The week ahead – should help to sort out some issues, like:
- Have bad positions taken in expectation of a Remain vote been shaken out?
- More currency intervention as the Swiss and Japanese seek to offset strength while the Bank of England looks to support pound sterling at levels not since sine the 1980’s. With “safe haven” investing, $US has gained strength and that will weigh on the Fed
- Will sovereign debt yields continue to decline? In early morning trading, CT-10 is at 1.47%, UK gilts are at 0.95%, German bunds are -0.10%, JGB’s are -0.23%
June 20, 2016
Lower for Longer
Last Wednesday’s FOMC announcement was a unanimous vote to not change policy, reflecting acknowledgment of slow economic growth. The Committee’s expectations for GDP growth were revised downward for the second time, to 2%, with little change expected in 2017 yet it still expects to raise rates twice this year while acknowledging stronger, sustained gains are needed.

The above chart is from a WSJ article that asks if the US is headed for a Japan like environment that has existed for decades because its working age population growth peaked in 1995, and its productivity growth slowed. Since then growth has averaged less than 1% and low, now negative, interest rates have done little to spur investment. Reasons for this extended malaise are:
“A slower-growing work force needs less equipment and slow growth in productivity also leads to slower growth in wages and profits, which discourage households from borrowing (since they will have less future income with which to pay the money back) and firms from investing. In this way, sluggish growth can become self-reinforcing.”
Japan’s policies, like raising taxes then deferring them, and raising, then lowering, interest rates have added to the problem and that is one reason why the Fed is cautious about a higher interest rate policy – they do not want to raise rates only to reverse field when growth does not follow.
This is another reminder that central bank monetary policy can influence economic growth but fiscal stimulus is needed to encourage capital investment. With a presidential campaign imminent, Congressional cooperation a memory, and regulatory bank oversight increasing, prospects for a cohesive policy are slight.
The week ahead
Janet Yellen has two scheduled speeches and the UK vote on Brexit is scheduled for Thursday. This vote will have an impact, both on the unity of the EU which will be compromised, and the UK economy which could face trade barriers with its former members.
June 13, 2016
Bonds rallied, stocks softened, and 2016-20F was priced at the lowest rate since May 2013.

In addition to its recent cycle low debenture rate, the June sale represented the largest issue since September 2014 - $349,640,000.
The market trends mentioned above were more pronounced globally as Japanese, German and UK bonds hit record low yields; with 10-year German bunds ending the week at 0.01%, compared to U.S. Treasuries at 1.64%. This yield differential is the reason why as much as 73% of last week’s ten and thirty-year Treasury auctions went to foreign investors as they seek value and liquidity.
With the ECB and BoJ continuing their Quantitative Easing policies (sending sovereign debt to even greater negative yields), and the Fed checkmated by May’s extremely weak jobs report, we can expect these trends to continue.
Regarding those negative yields, Bill Gross of Janus Capital tweeted this warning: “Gross: Global yields lowest in 500 years of recorded history. $10 trillion of neg. rate bonds. This is a supernova that will explode one day.” Hopefully, a gradual, global approach to policy change, like the one advocated by Janet Yellen, can control any fireworks.
The week ahead – focus will be on the FOMC meeting that concludes Wednesday, though drama has been reduced and attention will be on other reports of significance.
- Tuesday – Retail Sales is expected to show a gain of 0.3% after a 1.3% increase in April
- Wednesday – the FOMC meeting announcement and the Committee’s forecasts, followed by a Janet Yellen press conference
- Thursday – Consumer Price Index is expected to show a 0.3% increase after a 0.4% increase in April. The April y/y rate was 1.1%
- Every day – there will be speculation about the Brexit vote scheduled for next week, June 24. A recent survey shows a 10-point lead for the Leave the EU movement vs. Remain, a reversal of previous sentiment. Concern over the possible exit is dominating European markets in general, and FX in particular.
June 6, 2016
Friday’s Non-Farm Payroll report disappointed even the most cautious analysts; reflecting a gain of just 38,000 jobs with a downward revision of 59,000 for March and April.
Key points of the report were:
- The weakest report in more than 5 years
- The Unemployment Rate decline to 4.7% was accomplished because 500,000 discouraged workers stopped seeking work
- The Labor Force Participation Rate declined 0.2% to 62.6%
- The 3-month average is 116,000 vs. 229,000 one-year ago
- The relatively low paying health care sector continues to show strength while the manufacturing and construction industries lag

The slight chance of a June rate hike is now off the table and a July increase becomes less likely. The June NFP report will reflect a gain of 31,500 striking Verizon workers who returned to work last Wednesday, but the recent trend will remain below last year’s gains.
The report sent ten-year Treasury yields down to 1.70%, lower by 14 bps on the week and 9 bps below where we priced 2016-20E. As historically low as that rate is, it represents a very attractive level compared to Germany’s bunds whose yield declined to 0.07%. With $10.1 trillion of global, sovereign debt now trading at negative yields, Treasuries and other $US denominated bonds will continue to be in demand.

The week ahead - is relatively light on economic releases.
Monday – Janet Yellen speaks in Philadelphia on the economy. Probably the last official Fed comment before the FOMC meeting June 14-15
Tuesday – Department of Labor report on productivity & labor costs
Wednesday - JOLTS report on job openings and labor turnover
***Thursday – pricing of DCPC 2016-20F, for settlement on June 15th
Friday – University of Michigan consumer sentiment survey
May 31, 2016
Following up on the release of the minutes from the Fed’s April meeting, Janet Yellen last Friday affirmed the Committee may be ready for a rate increase this summer. While still historically low, ten-year rates have pushed above their 50-day Moving Average as the market prepares for a June, or possibly July move. Probability of a June increase has risen to 34% while a July move is estimated to be at 62%.

All comments regarding a rate increase are hedged by emphasizing continued strong, domestic economic data and improving global conditions. The domestic releases start this week with Tuesday’s Personal Consumption Expenditure report that is expected to show a strong increase, though a smaller one of about 0.2% in the Fed’s preferred core calculation. That is followed by Friday’s Non-Farm Payroll report that is expected to repeat April’s disappointing number of 160,00 but may reflect a reduced rate of unemployment, to 4.9%.
Analysis of these reports might be provided by Chairwoman Yellen in a June 6 speech in Philadelphia and that will affect Treasury prices and our June debenture sale, scheduled for June 9. The next FOMC meeting is June 14-15, with a policy statement released at its conclusion.
May 23, 2016
Is a June rate hike now in play?
The rates market was softening before Wednesday’s release of the minutes from the April FOMC meeting that indicated a June rate increase was possible “if incoming data showed an improving economy.” A pretty modest quote but the minutes also indicated less concern for the global economy and more Governors than expected are in support of a rate increase.
Ten-year notes had the biggest weekly rise in rate in six-months, improving slightly on Friday to close the week at 1.84%, + 14 bps on the week, but only 5 bps higher than when we priced 2016-20E.
In addition to the overall softer tone the market showed a flattening of the yield curve, indicating pressure on short-term rates that are most affected by Fed policy. The closing spread Tuesday, pre Fed minutes, was + .936%, the tightest spread since December 2007; predating the financial crisis and the Fed’s zero interest rate policy. By Friday this spread widened somewhat to +95 bps.

The two smaller charts above reflect investors’ extension into longer-maturity Treasury notes and the continued net buying of Treasuries by foreign investors. While foreign central banks might be selling Treasuries to raise cash to support their currencies, foreign private investors are buying them to replace sovereign debt being sold to the ECB and BoJ.
The FOMC next meets June 14-15 with a policy statement at the conclusion of the meeting. Last week’s minutes from the April meeting served as a caution to the market and, in normal times, might have resulted in a stronger setback. With $9 trillion of global sovereign debt trading at negative yields there is nothing normal about this market and the attractive yield difference for $US debt will deflect any recurrence of the “taper tantrum” on its three-year anniversary.
The trend for weaker bond prices started last Monday but accelerated Tuesday with two stronger than expected releases:
- Consumer Price Index was +0.4%, its largest increase in three-years
- Industrial Production jumped 0.7%, its biggest increase since November 2014 and then the release of the May minutes pushed Treasuries to their intra-week high.
The weeks ahead – contain some of the key indicators that the Committee uses to gauge economic activity and will influence their decision:
- May 27 – 1QGDP, last reported as 0.5% annualized
- June 2 – Personal Consumption Expenditure with a core reading of 1.6% and 0.8%, ex food & energy
- June 3 – Non Farm Payroll, following April’s report of 160,000 that was far below the 12-month average of 227,000
May 16, 2016
In addition to pricing the twenty-fourth consecutive 20-year debenture ≤ 3.0%, 2016-20E was priced 42 bps below the series’ 12-month average rate as the market continues to defy prospects of a tighter monetary policy. Most importantly, the issue’s ongoing effective rate to small business borrowers was 4.32%.
After marking time around the 1.76% rate on ten-year Treasuries, positive economic releases on Friday were expected to move rates higher, but they didn’t. Instead, that rate dropped 6 bps to close at its lowest level in a month, close to its February low. The reports were a Retail Sales release that grew at its fastest pace in a year and a positive reading on consumer sentiment. So, rates continue to defy positive news and the market puts the likelihood of a June rate hike by the Fed at just 6%.

An interesting analysis of last Tuesday’s Small Business Optimism Report by Bloomberg News:
“The most important paragraph of the latest NFIB Small Business Optimism report is about labor markets and the first two sentences say: "53 percent reported hiring or trying to hire (up five points), but 46 percent reported few or no qualified applicants for the positions they were trying to fill. Hiring activity increased substantially, but apparently the 'failure rate' also rose as more owners found it hard to identify qualified applicants." In other words, nearly half of businesses can't get good applicants for their open jobs, hiring activity is increasing substantially, and more and more positions are simply going unfilled. Ultimately, a tightening labor market is the mother's milk of higher wages, and though the headline average hourly earnings number from the monthly Non-Farm Payrolls report hasn't yet broken out, evidence continues to build that the economy is shifting more in favor of labor. Today's NFIB report is the latest evidence (the report also says 24 percent of owners are raising worker compensation, which is up 2 points from the previous month). Meanwhile, at 10:00 AM E.T. today, we'll get the latest JOLTS report, which will have figures on total job openings and quits, among other things. We'll see if this confirms the story of ongoing labor market tightness.”
***JOLTS (Job Openings & Labor Turnover Survey) confirmed the trend analysis as openings increased 0.1% and hiring declined 0.1%. The quit rate was unchanged (indicating workers are less inclined to shift jobs) and the layoff rate declined 0.1%, confirming the labor market is the strongest part of the economy; yet, this job growth remains centered in retail and health care positions, with manufacturing jobs in decline due to the dollar’s strength and sluggish global demand for goods.
The Week Ahead – contains several housing reports, plus:
- Consumer Price Index – expected to be +0.3% as gas prices have increased
- Industrial Production – expected to be +0.2% with vehicle sales finally showing some strength
- Philadelphia Fed Survey – should rebound from last month’s -1.6% reading
May 9, 2016
The trends continue – benchmark interest rates remain low, supported by weak economic data; and the 504 program continues to fund 20-year debentures at sub 3.0% levels. Last week’s sale was the twelfth consecutive pricing below 3.0% and the second lowest coupon since May 2013. The summer of 2013 was the “taper tantrum” when rates soared in anticipation of a possible rate hike. That increase did not occur for two and one half years, yet we are at lower rates now due to global concerns and subdued domestic inflation.

Job growth disappointed Friday with a report of just 160,000 in gains for April. It was another good news, bad news report as it was the weakest gain since September but average hourly earnings showed a 3% gain. Other categories in the report were:
- A downward revision of 19,000 to the previous two reports
- A slight decline in the Labor Force Participation Rate to 62.8%
- Alternative worker rate was unchanged at 9.7%. These are workers stuck in part-time jobs or too discouraged to work
- The Unemployment Rate held at 5.0%
The pace of hiring and the pace of economic growth have been out of step. At the end of 1Q16, 2.8 million more jobs existed than a year earlier but GDP growth was just 1.9%. Their historical relationship would have associated growth of 3.4% with that pace of job creation, a rate that would have prompted more than one rate increase from the Fed.
Less pressure on rates – could come from increased corporate issuance in Europe to take advantage of pending ECB purchases of Corporate bonds, perhaps as much as €5 billion per month. The bonds must be issued by a Euro zone entity though the parent company can be located elsewhere, and last year such firms issued 22% of that market’s debt. Increased EZ sales would result in less domestic US issuance thereby reducing domestic supply and rate pressure. As things now stand, there is little expectation the Fed will increase short-term rates at its June 14-15 meeting.
This week's reports
Tuesday – a report on small business sentiment which hit a 2-year low in March
Friday – reports on Retail Sales, that have been down or flat all year; and PPI which had declined in March.
May 2, 2016
Treasury rates ended the week higher but improved from their weakest levels prior to the 1Q16 GDP report, and a reminder from the FOMC that it will pursue a gradual approach to higher rates. The post meeting announcement offered no hint of a June increase and that helped rates decline and, coupled with weak corporate earnings, sent equities lower.

Wednesday’s GDP report renewed signs of caution from businesses and consumers. It is the weakest quarterly report since 1Q14 and a sharp reduction from 4Q15’s report of -1.4%.

A NY Times article addressed productivity. More than 151 million Americans count themselves employed, a number that has risen sharply in the last few years. The question is this: What are they doing all day?
Three explanations were offered: 1. While improved technology and outsourcing have already been discounted, the impact of a slowdown in capital spending is not helping efficiency; 2. Perhaps economists are not counting things properly, a measurement error; and 3. The increase in payrolls is viewed as an investment for the future, and once these workers are fully trained, productivity will improve.

Last week – saw Unilever take advantage of the ECB’s corporate bond purchase program by issuing debt as long as 12 years with a 0% coupon. The notes were offered at a slight discount so their yield was 0.06%.
Durable Goods orders increased a lower than expected 0.8%, with February revised downward by 0.3% to -3.1%.
Personal Consumption Expenditures – showed a gain of just 0.1%, leaving it at 0.8% y/y, and the core rate at 1.6%, both below the Fed target of 2.0%.
The week ahead - we prepare for the May debenture sales with the program’s Treasury benchmark rate of 1.83%, 12 bps higher than when we priced in April, but FOMC sentiment has stabilized rates. Pricing is Thursday with settlement on Wednesday, May 11th.
Non-Farm Payroll is reported on Friday and expected to be +200,000, with the Unemployment Rate declining to 4.9% because of the increased Labor Force Participation Rate.
April 25, 2016
U.S. Treasury bonds had the biggest weekly selloff of the year, 14 bps, as investors migrated to riskier assets.

Contributing factors to that move were:
- Oil hit $46 a barrel, its highest level since November and a 60% rebound from its low price in January
- Stocks remain near their all-time high, set in May 2015
- Argentina returns to the debt market after a 15-year absence that was caused by a default on its debt. After reaching a deal with creditors, the country sold $16.5 billion of bonds in an offering that was 4X oversubscribed. With German bunds yielding 0.22%, and Japanese 10-year notes at negative 0.12%, it’s easy to understand why investors were willing to overlook economic problems and a poor repayment history to buy Argentina’s ten-year notes at 7.5%.
- A press conference with ECB President Mario Draghi, who once again affirmed that further rate cuts are possible. Euro zone unemployment sits at 10.3%, consumer prices are flat y/y, and Germany has been critical of the bank’s easy money policy.
- Another example of “risk-on” investing is Ireland’s ability to sell $113 million Century Bonds due in 2116, at a rate of 2.35%. Five years ago that was the rate on ten-year German bunds, which now yield 0.22%.
An interesting WSJ article illustrated the impact of low global rates. An investor would have to wait 30-years to earn $100 in interest on $1,000 invested in Japan’s 40-year bond, now trading at 0.26% yield. This lack of investment income is one of the criticisms German finance ministers cite when criticizing ECB policy.
The week ahead
Economic releases of interest are: Durable Goods, which is expected to rebound with a report of +1.6%, and Friday’s Personal Income and Outlays report which tracks the Fed’s preferred measure of inflation, Personal Consumption Expenditures. It is expected to show an increase of 0.1% which would put the y/y rate at 1.5%, short of the Committee’s 2.0% goal. On Wednesday, the Fed will conclude its two-day meeting with an interest rate announcement at 2:00. While no change in policy is expected, the announcement can impact bond prices as investors search for clues concerning improved sentiment about economic conditions.
April 18, 2016
Treasury rates were on the rise last week until oil prices declined after reports from a meeting in Qatar indicated significant production cuts from oil producing countries were unlikely, and Treasury rate declines have recently matched declining oil prices. That trend is linked because weaker demand for oil reflects weaker economic activity which supports easy monetary policies and lower bond yields.

The week in review – was marked by weak economic data:
- Retail Sales declined 0.3%, led by auto sales which registered its weakest number since February 2015
- Producer Price Index was negative 0.1% with the core rate at +1.0% y/y
- Consumer sentiment report on Friday contributed to the Treasury rate decline, perhaps due to concern over future job and wage growth as this was the fourth consecutive decline
- Industrial Production was reported as negative 0.6% for the second consecutive month and sixth monthly decline in the last seven months
- S&P 500 index gained 1.6% on the week
The week ahead has Treasury auctioning short-term debt and Treasury Inflation Protected Securities. Economic reports mostly concern housing data and the weekly report on jobless claims.
Global economic concerns are now a part of FOMC consideration for rate increases, along with 5% Unemployment and 2% inflation. At last week’s G-20 meeting, the world’s top financial chiefs acknowledged improvement from the recent commodity influenced equity weakness but cautioned “growth remains modest and uneven, and downside risks and uncertainties to the global outlook persist.” The ministers acknowledge monetary policy alone cannot provide a return to balanced growth and encourage reforms to boost employment and productivity, low interest rates, and less austerity in countries that can afford it. Also, the IMF cut its global growth forecast to 3.2%.
More than easy monetary policy and massive debt purchases are needed for sustained growth and global weakness is why no more than two, if that many, rate increases are expected by the Fed this year.
Politics and bonds – Congress is considering a bill that would hold Saudi Arabia to be held responsible in American courts for any role in the 9/11/2001 attacks. The Saudi response is they may be forced to sell up to $750 billion U.S. Treasury bonds held by the Saudi Arabia Monetary Authority. Reality dictates it would be difficult to sell that amount of bonds without disrupting both the global bond market, for which the Saudis would be blamed, and the Saudi economy since such action could destabilize the American dollar, to which the Saudi riyal is pegged. President Obama visits the kingdom this week and this could be a topic of conversation as the Administration does not support the legislation, arguing it would put Americans at legal risk overseas.
April 11, 2016
The rates market continues to improve, with CT-10 ending the week at 1.72%, 5 bps lower on the week in which the 504 program priced its twenty-year debenture at 2.26%, its lowest monthly rate since May 2013 (2.07%).
There is always confusion about the actual inflation rate, since many reports exclude food and energy costs due to their volatility. Unfortunately, we all pay for food and energy, so taking that into account it is clear why the FOMC links inflation to its policy decisions. The WSJ chart below identifies the impact of negative sovereign debt yields resulting from the aggressive bond purchase programs in Europe and Japan. Using Friday’s close of 1.72%, and matching it with the most recent core consumer price index rate of 2.3%, the real U.S. ten-year yield is -0.58%.

Helping the rates market was last Wednesday’s release of the minutes from the March FOMC meeting. Only two of the seventeen participants advocated for a rate hike due to job growth and firming inflation data. A gradual approach to rate increases was the consensus and probably will be so again at the April 27 meeting. What this means is that market direction will be dictated by other central bank initiatives and investors’ appetite for risk.
The week ahead - contains three economic releases of interest.
- Retail Sales – has been held down by sluggish auto sales
- Producer Price Index – expected to show an increase of 0.3% due to improvement in oil and gas prices
- Industrial Production – had declined 0.5% in February but manufacturing had shown solid growth
April 4, 2016
Eventually, Treasury rates will rise again; perhaps after some more encouraging news like Friday’s jobs report; they just won’t increase right away. The gain of 215,000 displayed some wage growth, barely budged interest rates, and helped stocks recover from an uneven week.


So, jobs are increasing at a steady clip, wages are showing an annual growth rate of 2.3%, and while the Fed is not expected to raise rates at the end of its April 27th meeting, prospects seem to be gaining for a June increase if jobs and wages continue to increase.
Ten-year Treasury rates are now 50 bps lower than when the year started, and approaching levels that existed before the “taper tantrum” in May 2013.Yes, we’ve been this low for that long, not far away from the historic low yield of 1.39% in July, 2012.
Contributing factors for this remain: aggressive global easy money policies; negative interest rates on $6 trillion + of sovereign debt (making $US denominated debt look cheap); negative inflation readings in the Euro zone; an Unemployment Rate of 10.3% in the same zone; and an enhanced Quantitative Easing policy from the ECB that will now purchase European, non-financial, Corporate debt in addition to the already negative yielding sovereign bonds.
The week ahead
In addition to pricing 2016-20D on Thursday, the market will see:
- Monday’s release of Factory Orders, expected to show a decline
- Wednesday’s release of minutes from March’s FOMC meeting that might explain more detail re: the Committee’s gradual approach to rate increases
- Thursday’s Fed Chair Speak, to include the current and past Chairs of the Fed
March 28, 2016
In a holiday shortened trading week the rates market moved sideways and equities reentered negative territory for the year. The most positive news was the most recent revision for 4Q15 GDP which was increased to 1.4%, up from last month’s estimate of 1.0% and the original report of 0.7%.
Focus will now turn to this Friday’s jobs data which has shown a three-month average gain of 228,000 and a current unemployment rate of 4.9%. Below is a WSJ chart that displays two other employment categories that display a more grudging, but steady, improvement.

Earlier in the week will be a Personal Income and Outlays report that is expected to show a 0.2% gain in the Fed’s favorite inflation indicator – Personal Consumption Expenditures. Such a gain would push the Y/Y rate to 1.7%, moving it closer to the Committee’s 2.0% target. Even with that increase it is unlikely the Fed will raise rates at its April 26-27 meeting, especially after projecting just two increases for 2016.
March 21, 2016
The WSJ chart below shows how the Treasury rates market reversed course after Wednesday’s FOMC announcement that reduced its expectation for the number of rate hikes this year. Though the market has been skeptical of the previously announced four hikes, confirmation from Janet Yellen that global concerns have encouraged the Committee to plan on just two rate hikes enabled stocks and bonds to rally. The ten-year benchmark rate declined for the first time in five-weeks and the highly sensitive two-year note declined the most since October.

And while Treasuries rallied for the first time in five-weeks, stocks notched their fifth consecutive week of gains, putting them in positive territory year-to-date.

Of interest during this rates rally is the increased positioning of Treasury debt by the market’s 22 Primary Dealers, as they reported holding as much as $121 billion in position last month, the most since October 2013. This increased inventory is probably the result of central bank selling to raise cash in support of their currencies.
Additional policy support for the Fed is coming from other central banks:
- European Central Bank indicated more rate cuts were still on the table
- Japan vowed to provide more monetary support, as its ten-year note traded at -0.09%
- China supported its yuan, allaying fears of letting it devalue
Fed forecasts
This Financial Times chart displays the Committee’s expectation for interest rates, progressing from the current 0.25-0.50% range to a mid-point range of 3% in 2018.

Then and now - comparing the Committee’s December 2015 forecast to last week’s estimates.
| Projected mid-point | December 2015 Forecast | March 2016 forecast |
| 2017 | 2.4% | 2.4% |
| 2018 | 3.8% | 3% |
Such an announcement highlights the perceived “lower for longer” market sentiment. Even as many domestic indicators reflect growth, the Fed has affirmed its concern for the global economy and will maintain a cautious approach.
The week ahead
Housing data for existing and new home sales with more significant releases at week end: Durable Goods orders and the third estimate for 4Q15 GDP, previously reported as 1.0% with a Y/Y rate of 2.0%.
March 14, 2016
ECB stimulus revives “risk-on” trades - was the big story last week.
Below is a NY Times chart showing the extent of the European Central Banks’ rate cuts, with its deposit rate now at -.40%, while the Federal Reserve Bank’s rate is +0.50%.

In addition to charging member banks more for their deposits, the bank will also effectively pay banks to borrow money from central bank funds to make loans to consumers and businesses. This unique measure will cover loans made, at no cost to the borrowing bank, for up to four years, and the central bank will compensate the bank as much as 0.40% if it lends more than what it has borrowed from it. An increase in monthly bond purchases to €80 billion from €60 billion will also include Corporate debt for the first time, since the existing pool of eligible securities presently trades at negative yields. These newly eligible securities will represent non-financial institutions only.
Divergence
The ECB’s announcement helped stocks close higher for the fourth consecutive week and that is what encouraged investors to increase their risk appetite which ended (temporarily?) the “safe haven” trade for Treasuries.

The benchmark Treasury used for pricing March’s twenty-year debentures rose 30 bps from the February sale date, and then another 7 bps into the week end. That move widened the yield difference between U.S. Treasuries and European sovereign debt which had rallied after Wednesday’s ECB announcement.
The week ahead – has a lot of economic data but attention will be focused on the FOMC meeting that begins Tuesday and ends with Wednesday afternoon’s policy announcement. Even with recent job growth it is not expected that a rate increase will be announced.
Consumer Price Index, Producer Price Index, Retail Sales, Housing starts and Industrial Production are all on the calendar.
March 7, 2016
The headline release last week was Friday’s Non-Farm Payroll report, showing a February gain of 242,000 and upward revisions of another 30,000 to previous reports. The Unemployment rate remains at 4.9% and the only disappointment was wage growth of just 0.1%, and a reduction in hours worked. The below chart from the WSJ shows the dramatic improvement in all measurements since 2009.

The answer is – not very. The report’s impact reflects a reduction of fear in the financial markets as the benchmark ten-year Treasury yield rose to 1.88% (27 bps above where the February debenture was priced) and equites rallied for the third consecutive month. The DJIA closed above 17,000 for the first time since January 5th.
Items of note in the flow of funds –
- $2.09 billion exited investment grade bond/treasury funds last week, as of Wednesday.
- $5 billion, a weekly record, was added to funds specializing in junk bonds.
- $299 million, the most since May, was invested in inflation protected funds.
Even with the selloff in Treasuries, the benchmark ten-year yield at 1.88% is 39 bps below where it began the year, as well as since the Fed raised rates in December. The reasons for this contrary move continue to be:
- Weak Chinese economy and its impact on commodity prices and emerging market economies. Government forecast doesn’t expect a stronger performance in 2016.
- European economies in recession and deflation, keeping unemployment high and central bank policy easy.
- Add those same conditions to Japan where sovereign ten-year yields are now negative 0.02%; adding to the $6 trillion of global sovereign debt at negative yields. This, in particular, is a reason why global demand for $US denominated debt remains strong.
- The strong $US has made American exports expensive.

The week ahead
Reports on Consumer Credit and Household Net Worth can offer support for economic bulls but the rates market will be most affected by $56 billion of Treasury debt to be auctioned. In particular, $20 billion of the benchmark ten-year will be sold the day before we price March’s debentures. Expectations of a rate hike at the March 15-16 FOMC meeting are slight.
February 29, 2016
Modest, but Positive Growth
In a week that saw negligible change in rates, the market saw some signs of life with economic releases that exceeded forecasts:
- 4Q15 GDP was revised upward to +1.0% from +0.7%. Expectations were for it to be revised downward to +0.4%
- The Fed’s preferred inflation indicator, Personal Consumption Expenditures, saw its core rate (ex food & energy) rise to 1.7% and its inclusive rate rise to 1.3%
- Personal income and spending both rose month over month

The benchmark ten-year Treasury remains anchored near the 1.75% level, virtually unchanged on the week. Spread product has improved and the market awaits the next FOMC meeting in two-weeks (March15-16).
“Fed speak” – Fed Governor Lael Brainard cited the strength of $US and the weak start for stocks as a form of financial tightening that has already taken place and “is a factor to lower expectations that the U.S. would be able to diverge, or grow strongly, compared with the rest of the world.”
This week – is relatively light on economic releases but Non-Farm Payroll is reported on Friday. Expectations are for a +190,000 report with the Unemployment rate holding at 4.9%.
February 22, 2016
Last week’s Treasury performance ended three weeks of gains as trading was driven by erratic gains in oil and stocks, plus the release of the minutes from the Fed’s January meeting.

The Fed has frequently stated its goals of 5% unemployment and a 2% reading for Personal Consumption Expenditures as two items, now plus global growth concerns, that would influence their decisions on rate increases. One hike took place in December and the proposed four additional increases in 2016 have been discounted by the market, with March unlikely and June possibly being in play.
At 4.9% the unemployment rate has already reached its desired level but inflation has been held in check by declining commodity prices, particularly oil. Last Friday’s release of the Consumer Price Index (CPI) showed a monthly gain of 0.3%, which beat forecasts and raised the year-on-year rate to 2.2%. When including energy however, and food, total prices were unchanged in January but the yearly rate did rise to 1.4%. New vehicle sales and airfares showed strong gains but energy costs declined 2.8%, weighing down the overall rate.
Personal Consumption Expenditure
More important to the Committee though is this measure of inflation which uses a chain index, that takes consumers' changing consumption due to prices into account (the CPI uses a fixed basket of goods with weightings that do not change over time). Trailing the conventional CPI reading for sure, but gaining ground, the PCE now registers a 1.4% rate. Continued growth will be needed, as will stabilized commodity and global equity performance, before the Fed can add to its December policy change.

This week ahead -
has several releases on home sales and Friday’s second estimate for 4Q15 GDP growth, expected to be +0.4%. With Treasury rates at levels dramatically below their pre-rate- hike levels, the market will absorb $88 billion of new Treasury debt this week, so additional price gains might depend on headline news.
February 16, 2016
Could it be One and Done?
The recent push for “safe-haven” assets has strengthened the speculation about additional rate hikes by the Fed. In fact, in a report last Thursday BNP Paribas stated they “do not expect any rate increases for the Fed in 2016, and possibly not in 2017.” Such speculation will support demand for Treasury debt even as employment and wage growth remain decent. Global concerns, like Japan reporting a negative 1.4% growth rate in 4Q15, isolate the Fed as the only central bank having adopted a tighter monetary policy. Japan will be expected to expand its stimulus as domestic demand has declined and a stronger yen has hurt its exports.
It was a volatile week for all markets as they reacted to headline news about European banks, Janet Yellen’s congressional testimony, and renewed fears of recessionary pressure. The most difficult time for stocks was Thursday (as seen below) as global indices were under pressure that created another flight to “safe haven” securities like U.S. Treasuries.

That move pushed ten-year yields as low as 1.61% when the SBA 504 program priced 2016-20B at 2.27%, the lowest twenty-year debenture rate since May 2013.

Stability in overseas markets held stock prices firm at Friday’s opening and then a strong Retail Sales report (+0.2%, with a correction of +0.2% for December) sent the DJIA up 2% on the day. Treasuries then lost their bid and weakened to close the week at 1.75%.
Credit Default Swaps make a return
Prior to Friday and yesterday’s recovery in stocks, it was concern for the health of European banks that negatively impacted global equities (and enhanced safe-haven demand) and Deutsche Bank was at the forefront. This Wall Street Journal chart shows how the cost of insuring against a default on $10 million worth of DB debt for five-years has risen to $268,000 per year; compared with a cost of $96,000 at the start of the year.

The cost for other banks, like Goldman Sachs and Credit Suisse has also risen, but Goldman Sach’s cost is $159,000, by comparison. Driving this fear is sluggish economic growth, with particular attention paid to bank’s energy loans that are impacted by weak oil and other commodity prices.
The week ahead
- Producer Prices on Wednesday are expected to be -0.2%, dragged down by oil weakness
- Also on Wednesday we get minutes of January’s Federal Open Market Committee hearing where they chose to not raise rates
- Friday provides Consumer Prices which are expected to be -0.1%
February 8, 2016
As we wonder when a tighter Fed policy will register with the rates market, there has been a noticeable change in bank lending standards. Below are details, and a graph, that were included in a Credit Suisse piece that analyzed the Fed’s “Senior Loan Officer Opinion Survey on Bank Lending Practices.”
The survey was made available to Fed officials for their January 26-27 FOMC meeting; it was reported that banks, on balance, tightened their standards on commercial and industrial (C&I) and commercial real estate (CRE) loans in the fourth quarter of 2015. The 73 domestic, and 24 U.S. branches of foreign banks, also indicated they expected standards on C&I and CRE loans to tighten over 2016.

The timing of the 504 program’s initial Debt Refinance program in 2010 ironically coincided with an easier lending policy by banks, and still resulted in $2+ billions of loans being funded by the program. Perhaps the program’s reintroduction this year is arriving at a more fortuitous time for small business borrowers.
An offset to that recent Fed survey is in a February 4 article in the American Banker, where reference is made to: “Federal banking regulators issued a joint statement in December that warned of a "substantial" rise in exposure to loans backed by commercial real estate that often included loosened underwriting standards. Total CRE loans, meanwhile, increased 6% in the third quarter from a year earlier, to $1.2 trillion, according to the most recent data from the Federal Deposit Insurance Corp.”
Below is a chart from that article showing that increase in lending, and also showing the improved delinquency rate from its peak in 2010. For the 504 program, the annualized default rate is 0.87%, as of February 1st.

Back to the markets
Friday’s Non-Farm Payroll report came in at 151,000, with a downward revision to January’s report. Disappointing for stocks that trended lower, but positive for Treasury rates. Key elements of the report are:
- The Unemployment Rate declined to 4.9%, matching the Fed’s median forecast for “full employment.”
- Civilian Labor Force Participation Rate inched up to 62.7%; 1.31million people have joined the labor force over the last year. This rate is held down by the steady erosion that aging is having on the ratio.
- Wages are improving, and show a 2.5% gain over the year-ago period.
- Retailers added 58,000 jobs in this report and, since holiday sales were down, it is surprising this sector was responsible for so much of the month’s total.
- CT-10, the benchmark ten-year Treasury used for pricing the 504 program’s twenty-year debentures, closed the week at 1.83%, 35 bps lower from the January pricing date.
Rate Expectations
When the Fed announced its 25 bps rate hike in December, the accompanying announcement suggested as many as four more rate hikes in 2016, with March being the likely first one. Market sentiment appears to be taking that off the table, a view that is reinforced by an observation from Fed Governor Leal Brainard: “market volatility and weak emerging market growth reinforce the case for watchful waiting.”
Adding to the attractiveness of Treasuries is a February 3rd announcement that Treasury will reduce the issuance amount of maturities with five-years or longer terms by $18 billion over the next quarter. This reflects smaller deficits but will also enhance the scarcity value for existing Treasuries, which are very cheap when compared to European and Asian sovereign debt.
| Ten-year Notes | U.S. | Germany | Japan |
| 1.83% | 0.50% | 0.03% |
The value of U.S. Treasuries supports the value for $US denominated credit product, though investors continue to seek additional spread premium because of elevated price levels on the benchmark Treasuries.
This week
- Treasury will auction $23 billion ten-year notes the day before our debenture sale and the issue’s reception will help to set the tone for our pricing.
- On Thursday, Janet Yellen testifies before Congress for the first time since December’s rate hike. The morning session is before the House Financial Services Committee and the afternoon session is before the Senate Banking Committee.
February 1, 2016
That was interesting! – even with an almost 400-point gain Friday, the DJIA ended the month down 5.5%. Items of interest during the week were:
- Wednesday, the Fed left rates unchanged and admitted growth is slow, sending stocks lower. The announcement said the bank is “closely monitoring developments in global economies,” but stopped short of saying that will affect their policy decisions. Officials claim a March rate increase is still on the table but they seem to be the only ones that believe that.
- Thursday, Durable Goods orders declined 5.1% in December, the latest signal that U.S. manufacturing was suffering from a soft global economy and a strong $US.
- Friday, the Bank of Japan becomes the most recent central bank to adopt a negative interest rate policy by setting its bank rate at -0.10%. Then, the Q4 GDP announcement that domestic U.S. productivity was just 0.7% drove stocks higher and rates lower.
The effect of these releases, Friday’s in particular, was to see stocks, commodities, and Treasury prices rally; leaving our benchmark ten-year note at 1.94%, 35 bps lower than on the day the FOMC raised its lending rate by 25 bps – an unintended consequence.

Why? – the initial answers for the ten-year notes performance were weakness in Chinese stocks and its currency; declining commodity prices (especially oil), and their combined impact on emerging market economies that depend on Chinese demand for their resources. The U.S. does not export much to China so its slowdown does not have a direct impact, but it will be a cautionary item for the Fed to consider.
The issue’s performance since mid-December now is attributed to the market’s perception that additional rate hikes this year will be much fewer than the four increases advertised in the December announcement. Added to that view are the ongoing Quantitative Easing policies of the Bank of Japan and European Central Bank that are draining hundreds of billions of sovereign debt from their respective markets, making $US denominated debt attractive by comparison.
The week ahead
We get some “Fed speak” from Stanley Fischer on Monday, along with a manufacturing report (ISM) that is expected to show continued underperformance. On Friday, the employment report for January will be released and is expected to be decent, around 200,000, but far below December’s 292,000 release.
Concerning other Central Banks, the Bank of England announces its policy statement on Thursday and is expected its leave its benchmark rate unchanged at 0.50%.
January 26, 2016
Last week oil found some traction, and so did stocks as they had their first positive week of the year. That reduced the demand for “safe-haven” assets so Treasuries marked time until it was revealed that capital outflows in China last year may have reached $1 trillion, more than seven times the amount for 2014.

The result this morning was a 7% decline in the Shanghai index, U.S. Treasuries flirting with the 2.0% rate on the ten-year note, but U.S. stocks are holding firm, possibly uncoupling from the trend in China.
We are so far below the 50 and 200-day Moving Averages for the ten-year note that they are simply reference points, almost meaningless with regard to how overpriced it is.
Looking Ahead
This week contains ample central bank activity with –
- The European Central Bank already indicating more support for easy money in March
- The Federal Open Market Committee holding its January meeting today and tomorrow with perhaps some dovish comments from Chairwoman Yellen
- And the Bank of Japan possibly signaling more action this week to support economic growth
- Durable Goods orders for December will be released Thursday and they are expected to continue their flat path due to weak demand for U.S. exports. A gain of +0.2% is expected.
- 4Q15 GDP will be released Friday and is expected to show a 0.9% gain, down from 2.0% in 3Q15

January 19, 2016
After briefly trading below 2% on Friday the ten-year Treasury closed the week at 2.04%, 8 bps lower on the week in response to continued weakness in China and disappointing US economic releases, such as producer prices at -.02%, retail sales at -.01%, and the Empire State Manufacturing Survey dropping to its lowest level since April 2009.

Could this be true?
The below chart is from a Financial Times story that identifies why the Fed may pause its planned rate increases for 2016:
- Equity indexes in Japan and Europe have lost a 10th of their value this year, with the US not far behind
- Oil prices settled below $30 for the first time in 12 years
- US Equity funds saw $12.3 billion in withdrawals last week as some measures indicate we are now in a bear market
Those withdrawals, and new cash deposits, found their way into Money Market funds (+$24 billion) and Government debt (+$19 billion). These investments are offsetting the recent Treasury sales by China.

This chart reflects Fed Funds futures contracts that indicate probably just one rate hike this year in September, and a 25% chance the Fed does not raise rates at all in 2016. It is important to note that these contracts reflect current sentiment and that is always subject to change, especially if China and oil prices stabilize soon.
One thing is almost certain though - the Fed will not be raising rates at its January meeting and a change at the March meeting, even if job growth maintains its 4th quarter pace, is unlikely. Downward pressure on inflation, weak equity markets, and global concerns will offset continued job gains, which are not being accompanied by significant wage growth.
The week ahead – will give us much data on housing and Wednesday’s report on Consumer Prices, expected to be mild as weak oil prices continue to have an impact; keeping CPI ex-food & energy at 0.5%.
January 11, 2016
This was the week that was-
The driving force in last week’s market activity focused on China, with stock trading halted two separate days by triggers that were activated by intraday declines of 7%. By the end of the week regulators abandoned the triggers but you can see the impact its equity weakness had on global equity exchanges and commodities. Gold resumed its identity as a “safe-haven” investment (until Friday), oil prices declined to 2003 lows, and Treasuries saw increased demand as investors continued to seek safety.

Domestically, the DJIA is off to its worst ever 5-day start to its trading year. The above chart is from Thursday’s close so when you add Friday’s decline of 1% the index was down 6.2% for the week.
Factors that are driving this trend domestically are: underwhelming fourth-quarter earnings reports, a commodities bust, Mideast turmoil, and overall concern about Chinese and U.S. economies.
What rate hike?
On December 16th after the Federal Reserve raised its benchmark rate 25 bps the ten-year Treasury yield closed the day at 2.29% and expectations were for it to inch higher as the market was preparing for as many as four more increases in 2016. Friday’s close at 2.12% reinforces the global demand for “safe-haven” assets and continues to assist the 504 program in delivering effective rates to borrowers, like the 4.83% rate on last Thursday’s 20-year debenture.

As good as this movement is for small business borrowers, the underlying conditions are troubling as global concerns will contribute to a modification of domestic GDP growth and heighten the Fed’s awareness of slowing global growth.
FOMC minutes
Minutes of the Fed’s December meeting were released last Wednesday and revealed Committee members’ concerns about lingering low inflation, a strong dollar, and their effect on trade. That said, some officials continued to talk about four possible rate hikes this year, something the markets are less inclined to believe.
Non-Farm Payroll increases 292,000 in December
Not even this greater-than-expected report helped equities, nor hampered Treasuries, after its Friday release. Key elements of it were:
- Unemployment Rate remains at 5%
- Labor Force Participation Rate remains historically low at 62.6%
- Wage growth a 2.5% Y/Y gain but remains below historical standards
- Professional and business services added 73,000 jobs
This week will see the Treasury auction $58 billion in intermediate and long-term securities and that should pause immediate price gains for the market. On a positive note, Chinese stocks were down another 5% in Monday trading yet global equities opened with gains and Treasuries are marking time.
January 4, 2016
How far have we traveled?
In terms of the ten-year Treasury yield, not very far. We ended 2014 with CT-10 at 2.17%. Last Thursday’s close was 2.27%, and that is after a 25 bps rate hike by the Federal Reserve. This chart identifies a 2015 range of 85 bps for the issue but also shows how we have maintained its current rate level the last two months. What has changed the most is short-term yields, like the two-year note that went from 0.64% a year ago to close Thursday at 1.06%.

The December 16 policy change was the only one by the Fed, though they had been expected to raise rates three times in 2015. Now, attention turns to its plans for 2016, and just as the Fed’s tighter monetary policy has diverged from other central banks, so too is its “dot-plan” at odds with market indicators.

The Fed Funds futures market projects a much lower rate than the Fed. The above chart also displays how the central bank’s 2015 forecast has changed from December 2014. If the futures market is correct, the pace of rate increases will be slower than expected.
Change factors-
What affects possible Fed policy decisions: China, inflation, strength of the $US, success of the European Central Bank’s bond purchase program, and stabilization of commodity prices. All of these items will be central to future Fed moves and illustrate why there is skepticism about the pace of future tightening.
It’s hard to imagine a country with 6.5% GDP having a negative impact on global economies but that is the state of affairs in China. Its weakening demand for commodities is putting/keeping emerging market countries in recession and a 7% decline today in its CSI 300 Index has pushed the DJIA down 2.6%.
The week ahead-
2016-10A and 20A will be priced this Thursday, a day after the minutes from the Fed’s December meeting are released and also after much “Fed speak”. Wednesday will also provide data on the U.S. trade gap, and Friday will have a release of the December jobs report. Monthly averages for 2015 were a solid 210,000 but paled vs. 2014’s average gain of 260,000.
December 21, 2015
What's Next?
On the day of our December funding, the Fed’s Open Market Committee fulfilled its ambition and raised its range for Federal Funds to 0.25-0.50%. Initial market reaction was for stocks to improve and interest rates to rise, but both moves reversed themselves by weekend with stocks down 1% on the week and ten-year Treasuries 1 bps lower from when we priced 2015-20L on December 10th.
Now that the rate hike is out of the way, it appears the market is less optimistic about things than the Fed. In its announcement, the central bank provided its “dot-plot” to chart interest rate hikes in 2016 and its number is four, or as much as another 100 bps while the market is expecting just two, bringing the Fed Funds rate to 0.875%, not 1.375%. Forward contracts for two-year Treasuries, the notes most sensitive to policy changes project a December 2016 yield of 1.65% vs. Friday’s close of 0.95%, also reflecting just two rate hikes. Last year at this time, Fed officials were projecting they would have made three rate increases by December 2015, not just this one; so perhaps the Committee is again overenthusiastic about the economy.

An indication of how effectively the Fed has managed its planned rate hikes is that the pricing day average rate for ten-year Treasuries in 2015 was 2.145%. Such stability is in marked contrast to the taper tantrum in 2013 when we priced the September debenture off a 2.96% rate in Treasuries with the same Fed policy in effect as for this month’s debenture sale. At that time, there was less concern about China’s softening economy, its impact on demand for commodities, and how that has affected so many of its suppliers in emerging markets.
Another factor contributing to low rates is the European Central Banks’s continuing purchases of sovereign debt that has pushed the yield differential between European and Treasury yields to levels that make domestic debt very attractive. A comparison with German debt is below.
| U.S. | Germany | Difference | |
| 2-Year | 0.96% | -0.34% | +128 bps |
| 10-Year | 2.21% | 0.55% | +166 bps |
So long as the ECB continues its bond purchases, domestic debt will attract global buyers and soften the potential of a tighter monetary policy. Of additional benefit is the Committee’s decision to continue reinvesting proceeds from its own Quantitative Easing purchases.
"The Committee is maintaining its existing policy of reinvesting principal payments from its holdings of agency debt and agency mortgage-backed securities, and of rolling over maturing Treasury securities at auction, and it anticipates doing so until normalization of the level of the federal funds rate is well under way. This policy, by keeping the Committee's holdings of longer-term securities at sizable levels, should help maintain accommodative financial conditions.”
It had been expected the Fed would discontinue these reinvestments once it raised rates, so this continuing reinvestment can be taken as a measure of how sensitive the bank is to withdrawing support from the markets too abruptly.
December 14, 2015
As we await Wednesday afternoon’s announcement from the Fed, markets refuse to cooperate with the central bank. The S&P 500 declined 3.8% last week (with energy shares down 6.5%); oil slumped 11%, to below $36 per barrel (hitting a 7-year low); a $789 million junk-bond fund barred investors from withdrawing funds while its managers liquidate the fund; and Fed officials conceded they are ill-equipped to quell dangerous asset bubbles.

So, what happens when turmoil like this presents itself? Treasuries become a safe-haven and that helped our benchmark Treasury close the week 15 bps lower, and 10 bps lower than when we priced 2015-20L on Thursday.

Such price movement is an indication of volatility and there is an index that measures it; and as you would expect, it rose last week. This gauge, also known as the” fear index,” is at highest level in months as Treasuries experienced their largest one-day drop in yield since July.
What to expect?
- While not guaranteed, a rate hike is probable as the market assigns a 74% probability to it happening.
- Short-term rates are most affected by Fed policy and they have already adjusted to a tighter money policy.
- While long-dated rates were not expected to rise much, they were not expected to decline as they did last week. A repeat of 2013’s “taper tantrum” is not forecast but global demand will keep a lid on them.
- Will the liftoff have thrust? The market expects two-to-three, 25 bps rate increases in 2016, meaning a Federal Funds rate around 0.875% next December. That is the gradual type of path that Chairwoman Yellen has been advocating but global market conditions will have an impact on those decisions.
December 7, 2015
The Week in Review
Good News -
- Friday’s Non-Farm Payroll report of 211,000, plus a 35,000 upward revision for the previous two-months, clears the way for a Fed rate hike on December 16. Listing a rate hike as good news seems odd but the job gains reflect a stronger economy and the Fed is confident wage growth and inflation will pick up, as will the global economy.
- Thursday’s stimulus announcement by the European Central Bank was initially viewed as disappointing but follow up comments by its president, Mario Draghi, helped equities recover more than their 1% decline and Treasury rates also improved on Friday.
Bad News -
- The Institute of Supply Management report declined to 48.6 for its lowest reading since August 2012. This report was responsible for the ten-year Treasury yield to drop to 2.15% mid-week (as seen in the chart below).
- The U.S. trade gap widened 3.4% in October as exports continue to decline as a result of a strong $US and weak global demand.
- Another sign of financial market stress is reduced trading revenue, causing Morgan Stanley to reduce its Capital Markets trading and sales staffs by 25%.
- OPEC decides to maintain its production levels for oil, risking a further decline in prices which are at a six-year low. Like calling a rate hike good news, calling lower oil prices bad news is odd, but lower commodity prices have not resulted in greater demand and illustrate the impact of a weak Chinese economy.

Probabilities
- It is most likely the Federal Reserve will raise its Federal Funds target by 25 bps on December 16 to a range of 0.25%-0.50% (the European Central Bank lowered its deposit rate to negative 0.30% last Thursday).
- Chairwoman Janet Yellen has declared the path of rate increases will be gradual, with most analysts expecting two to three more moves in 2016. While such a schedule is desired it is dependent on continued weak demand for commodities, below target inflation, and soft retail sales.
The Week - in addition to 2015-20L being priced Thursday there are two releases of interest that contribute to the Fed’s interpretation of economic health. PPI on Friday is expected to be within 1 bps of zero, and Retail Sales is forecast to be in a range of -0.2% - +0.5%. Showing the uneven performance of this statistic is the chart below.

November 30, 2015
Trends - remain in place.
- Ten-year Treasury yield is anchored at 2.22%; dependent on headline news until the FOMC meeting in December
- $US remains strong, approaching parity with €, currently at 1.07; and this strength is a drag on US exports
- U.S. stocks hold firm
- Chinese stocks resume their slump, declining 5.5% on Friday alone, after the government continued its crackdown on brokerages and financing terms; in truth, a modest correction of the index’s 24% gain since its August low point but reduced Chinese demand for commodities is a drag on global economies
- Gold drops to a six-year low
- Japan reports inflation at negative 0.1%
- Commodity prices remain weak, with oil declining 3.1% on Friday; a continued drag on achieving the Fed’s 2.0% inflation rate
- And, the European Central Bank is expected to continue its easy money policy by further cutting its overnight deposit rate at its meeting on Thursday. This deposit rate already stands at -0.20%, meaning it already costs depository members money to keep funds at the bank.

On Friday, the Bureau of Labor Statistics will release its employment numbers for November, its final report before the Federal Open Market Committee meets on December 15-16. October’s report of +271,000, with a reduced unemployment rate of 5.0%, has influenced the market to expect its first rate hike in seven years at the conclusion of this meeting. As certain as that increase appears to be there is more speculation about market reaction and the subsequent path of rate increases. Markets, both stocks and bonds, have seemed stress free in response to events like the Paris terrorist attacks and the Turkish downing of a Russian fighter jet, and most analysts expect a muted reaction on December 16 since short-term rates have mostly built in the higher cost of funds.
It’s not just the relatively uneven U.S. recovery that concerns our central bankers but such a changed money policy will be divergent from most global economies still battling low commodity prices that have weakened their currencies and consumer demand. Consideration for these conditions is why the Committee has repeatedly said they expect rate increases to be gradual and that sentiment has been accepted by the markets.
November 23, 2015
On Your Mark, ...
This chart of the two-year Treasury note does not directly factor into any of our debenture pricings but does immediately anticipate/reflect change in Federal Reserve Bank monetary policy; and on Friday, this note reached its highest yield level in five years. Additionally, with ten-year yields lower on the week at 2.26%, this spread relationship (2/10’s) is at its tightest in seven months. Such a tightening (+134 bps, its tightest spread since April) is called a flattening of the yield curve, and since Federal Reserve Bank monetary policy most affects short-term debt, this move tells us the market is prepared for its first rate hike in seven years.

December 16, the date of our December funding, is also the second day of the next FOMC meeting and it will include an announcement on any decision made by the Committee. Market opinion is near unanimous that there will be a rate hike and this price action reflects the market’s preparation for it. Enhancing that sentiment was a Federal Reserve Bank comment last Wednesday that “it could well be time to raise rates at the December meeting.”
Trends
- Stocks continue to trade well, with the S&P 500 index posting its best weekly performance in almost a year, +3.3%. The market, like bonds, seems focused on the language around the pace of rate increases and is not too concerned about the first increase.
- Mario Draghi, President of the European Central Bank, continues to state that the bank “will continue to do what it must to raise inflation,” meaning more purchases of sovereign debt, which will keep those yields low, As of Friday, ten-year Treasuries yield 179 bps more than ten-year German bunds.
- Consumer Price Index was reported as +0.2% in October, the same rate for its annualized change. If you ex out the volatile energy and food sector of the index, it is +1.9% Y/Y, but the Fed does not ex them out, so inflation remains below target.
- Two base metals, copper and nickel, hit six and twelve-year lows as China demand slows and $US strengthens. These two considerations are drivers for global commerce.
November 16, 2015
Rates are going higher, right?
Eventually, yes. With a near unanimous opinion of forecasters that the Fed will raise rates at its December meeting the ten-year benchmark Treasury note declined 6 bps on the week, as oil had its worst performance in months and stocks followed. It is important to note that only Treasury rates are declining, credit spreads are widening as their relationship to benchmarks is being turned upside down.

Additionally, China’s markets have stabilized, reducing their need to sell Treasuries and on Friday, the U.S. government said that wholesale inflation saw a record decline over the past year, while sales at U.S. retailers barely rose in October.
Details for those reports are:
- Retail Sales were soft for the third month in a row at +0.1% and this slow pace has prompted major retailers to cut forecasts for sales and profits
- Producer Price Index was reported as -0.4% with the Y/Y change -1.6%. This has a direct link to the inflation gauge the Fed wants to see at 2% and is a major reason why the Committee has been hesitant to raise rates
- Domestic stocks fell about 3.5% on the week, led by the retail sector that was down 4.7%
- Oil fell almost 10% and that dragged down the energy sector
At Odds with the World - As the Fed prepares to raise interest rates it is at odds with its global counterparts who maintain their own Quantitative Easing policies, buying their domestic debt which holds down their bond yields. Hold down actually is quite an understatement - $26 trillion global government bonds are trading under 1% with $6 trillion trading at negative yields. To date, central banks have purchased $12 trillion of sovereign debt and economies in Europe and Asia continue to struggle.
Relative Value – as shown in the chart above, Treasury debt at 2.27% yields 182 bps more than German bunds and that differential will support foreign buying of Treasuries so long as the European Central Bank and Bank of Japan continue their QE policies. Affirmation of that was evident in last week’s Treasury auction of $24 billion ten-year notes where 60.5% went to foreign buyers.
November 10, 2015
Not if, but What Pace?
Friday’s Non-Farm Payroll report marked a turning point in the debate over the Federal Reserve Bank’s plans to start raising interest rates. The following are some of the positive notes from the report:
- A gain of 271,000 jobs, for a 12-month average of 230,000 puts this on target for employment goals
- Unemployment rate drops to 5.0%, right at the bank’s long-run goal
- 2.5% average increase in hourly earnings identifies strong wage growth
- 8 million jobs created over the last six years
If there is one negative to the report it is the static Labor Force Participation Rate, languishing at 62.4%, the lowest level since 1977, and reflects discouraged workers who have discontinued their job search.
Market reaction was as expected, though muted. The ten-year Treasury benchmark rose 9 bps from our Thursday pricing level to close the week at 2.33% while the two-year maturity, an area most impacted by rate change, rose to its highest level since 2010, 0.89%. That the first rate increase since 2006 will happen next month has been virtually assured by recent comments from Chairwoman Yellen, so the focus will now turn to the pace of rate increases and that is why the market’s performance was muted. There are two things to keep in mind:
- Unlike the last tightening cycle where the Fed raised rates at every meeting for two-years the Committee is sensitive to the uneven recovery we are experiencing and will pursue a gradual path; unless wage growth and inflation pick up. You knew there had to be a caveat.
- Even with the recent move higher in rate U.S. Treasuries will continue to attract global buyers of fixed-rate assets because they are so comparatively cheap and with inflation benign rate, increases should be measured.
| U.S. | Germany | France | Italy | |
| 2-Year Maturity | 0.89% | -0.30% | -0.22% | 0.11% |
| 10-Year Maturity | 2.33% | 0.68% | 0.93% | 1.69% |
November 2, 2015
Slight Reversal - After hovering near 2.0% early in the week our ten-year Treasury benchmark gave ground on Thursday and ended the week at 2.15%, for its poorest performing week since June. Weak economic releases kept the issue around 2.04% until a Federal Reserve announcement on Wednesday indicating December is still in play to raise rates; in fact that omission is almost a concession to a rate hike and will leave the markets more cautious than usual.

All it took was the removal of an explicit mention of global concerns from its post-meeting announcement Wednesday afternoon. At its previous meeting the Fed added global concerns to its focus on unemployment and inflation, the two criteria that have been targeted for normalization of monetary policy to resume. The Unemployment Rate is acceptable at 5.1% but Personal Consumption Expenditures (the Fed’s preferred view of inflation) was released on Friday and shows just a 0.2% rise Y/Y, far below its 2.0% target.
The ease with which the ten-year yield rose is a result of a thin, illiquid market that has been poised for a rate hike since its “taper tantrum” in May 2013. Since it is acknowledged our recovery has been erratic and the global concerns expressed earlier are still in play even this initial rate increase could be a singular event for the near-term.
Comparative Rates - At 2.15%, Treasuries yield 162 bps more than German bunds and even 69 bps more than Italian bonds, a country that was almost barred from the market six-years ago. To show how things have changed, on Friday Italy sold €1.75 billion two-year notes at -0.023%. That’s right, investors are paying Italy to hold their money for two-years.
As a result, even if the Fed hikes rates there will be strong global demand for $US assets in any selloff.
Last Week - All economic releases were negative:
- New Home Sales were lower than expected, owing to increased inventory.
- Durable Goods orders were -1.2% with August revised down to -0.3%.
- GDP for 3Q15 was estimated at 1.5% seasonally & inflation adjusted, vs. 3.9% in the previous quarter.
- Personal Income came in at +0.1% with the aforementioned PCE showing a gain of just 0.2% Y/Y.
This Week - We price our November debenture sales on Thursday, one day ahead of a Non-Farm Payroll report that should show some recovery from the recent weak reports. Estimates are for a gain of 180,000 but it is weakness like in previous reports, combined with low inflation and high global unemployment that have given, and will continue to give the Fed, a reason to be patient and gradual when they change policy.
October 26, 2015
Renewed nervousness over the health of the economy is a result of:
- The European Central Bank hinting at more action to promote eurozone growth.
- The Federal Reserve Bank being questioned over its commitment to raise interest rates.
- The People’s Bank of China continuing to ease by cutting its benchmark interest rate for the sixth time in twelve months. Even with a recent 6.9% rate of growth China’s economy is projected to grow at its slowest rate in twenty-five years.
There was little change in rates but equities surged at the prospect of continued low interest rates. The DJIA is + 12.6% since its low point in the summer.
What's strong
The housing market is one sector that has experienced price gains and last week’s report on existing home sales was + 4.7% in September, the second largest gain in eight-years.

Other events
The Treasury Department decided to postpone a planned auction of two-year notes as it approaches a debt ceiling deadline on November 3. This was preemptive as other auctions will be held this week. And, this is only an appetizer as the budget crisis deadline of December 11 awaits.
This week
This week we get some economic indicators and a FOMC meeting:
- The FOMC meeting on Tuesday and Wednesday is not expected to have policy implications but will provide a platform for commentary.
- Durable goods orders are expected again to be weak.
- Consumer confidence should be flat.
- 3Q15 GDP is expected to be reported at 1.6% vs. the 3.9% revision for 2Q15.
October 19, 2015
More of the same
This chart shows the daily closing yield of the ten-year Treasury note, which is the benchmark for our monthly twenty-year debenture pricing. Its high yield in the last six-months was in June (2.50%) as the market expected a Fed rate hike to occur. Disappointing global reports and low inflation (disinflation in some countries) have led the Federal Reserve Bank to be more cautious, resulting in a changed market sentiment that has reduced the note’s yield to 2.04% on Friday.
The two lines in the chart simply reflect moving averages for the note; 50-day and 200-day periods, and they clearly reflect the trend that has taken place – a risk-off trade for investors seeking full faith & credit Treasury debt that offers great liquidity.

The need for liquidity is for the exit trade, as many investors do not hold to maturity, but instead will look to sell once the trend reverses and rates rise. That time may be farther off than once thought and barring a sudden spike in inflation, we may remain in this low rate environment through year-end.
Last week’s events – most economic reports were weak
- Industrial Production was -0.2%; its second consecutive negative release is an indication of inconsistent economic growth
- Producer Price Index was -0.5% and -0.3% ex food and energy. Energy prices are down 23.7% Y/Y and gasoline prices are down 42.8%.
- Retail Sales was a weak +0.1% with August’s number revised down to 0%. Discretionary spending on automobiles and restaurants showed gains and that usually reflects consumer strength which was reflected in the one positive release – Consumer Sentiment rose after three consecutive declines
- Consumer Price Index was -0.2% and August was revised down to -0.2%. Other than some inflation in housing, there is little price pressure
- Industrial Production was -0.2%, the eighth decline in the last nine months
This week – is fairly light on economic releases; mostly Housing Starts and Home Sales with some manufacturing data late in the week.
October 13, 2015
Like a magnet
As much as rate hikes continue to be deferred, and inflation remains low amid global economic concerns, the ten-year Treasury seeks out this 2.12%-2.16% range of rates and for now, we should find 2.12% to be support in the near-term.

Last week saw a 12 bps spike in rate as equity and commodity markets gained strength. An earlier move higher in rate was in September, in anticipation of a normalization of policy and the benchmark then moved down to 2.0% when the markets realized a change in policy was not imminent. Minutes of the September meeting that were released last Thursday confirmed the dovish tone of September’s meeting and have influenced market participants to disregard Fed speak about potential rate hikes; though that talk will continue.
Fed fatigue
Throughout the three phases of Quantitative Easing it was stated that an Unemployment Rate of 5.1%, and Personal Consumption Expenditure Rate of 2.0% would be triggers for the FOMC to raise rates. Last month global economic concerns were introduced for consideration and China’s slowing economy has had a truly global impact, especially for emerging markets. Those markets would be particularly hurt by a Fed hike because dollars would be diverted to the US and its higher rates, possibly resulting in inflationary pressures in those countries. Yet, at the just concluded International Monetary Fund meeting in Peru central bankers urged the Fed to get on with it and end the uncertainty. Ironically, the redirection of dollars may turn out to be insignificant because it’s been emphasized that rate increases will be gradual so there may be little change in rate, just policy.
Prices paid
Y/Y rate of inflation is hanging around 1.2% and Friday’s report for Import and Export prices will do little to move the needle. Import prices were -0.1% and export prices paid were -0.7%, a reflection of the impact of a strong $US and its effect on agriculture.
Trend
For policy, the trend will be to mark time waiting for stronger economic reports and that should translate into a continued low rate environment with a delicate balance between trading liquidity and pressure on new-issue spreads.
October 5, 2015
And rates were even lower right after the report

Yes, the market continues to defy predictions; most recently Friday’s expected gains for Non-Farm Payroll. Unfortunately, the consensus proved incorrect and the report of just 142,000 job gains was disappointing and compounded by a downward revision of 59,000 to the July and August reports. Both the equity and bond markets reversed course after the opening – DJIA went from -240 to close at +200, and ten-year Treasuries traded as low as 1.95% only to ease back to 1.99% at the close. That puts it 11 bps lower on the week and 22 bps lower than when 2015-20I was priced on September 10th.
Factories and energy companies were dominant in the weak employment number as they have been most affected by a strong US$, depressed commodity prices, and weakness in China.
These lower rates are not as good as they seem
Fed speak will continue to mention the probability of a rate hike this year but the October meeting is pretty much out of the question, so the Committee would have to see strong gains in inflation, renewed employment strength, and global economic strength to fulfill that objective at their December meeting. In fact, sentiment is growing, evidenced by trading in Federal Funds futures contracts, that the first rate hike may not occur until March 2016. So, ‘lower for longer” may be with us for a while and the capital markets are feeling its impact. The High-Grade bond market has seen a 15% increase in issuance this year, but just last Monday, several issuers cancelled or reduced their issue size due to market turbulence. Issues that came to market were forced to price at wider credit spreads to accommodate investor caution and that condition will prevail going forward.
Roadblocks
No sooner did we survive the threatened government shutdown last Thursday than two other deadlines were presented:
- The Treasury Department announced that its borrowing limit of $18.1 trillion needs to be raised before November 5th, as it has been using emergency measures since mid-March and they have been exhausted
- Last week's stop-gap spending bill expires December 11th and President Obama has said he will not sign another short-term spending bill in December
The week ahead
This week is fairly light on economic releases, though Thursday will see the release of minutes from the last FOMC meeting on September 17th. Since that meeting resulted in a vote of 9-1 to not raise rates, the actual minutes may not offer much.
On Tuesday, we will announce terms for the October debenture sale, which will consist of just the twenty-year debenture. The twelve-month averages for this series are:
| # of loans | Issue size | Debenture rate | Spread to Treasuries |
| 395> | $277MM | 2.73% | +55 bps |
The actual numbers for October may vary dramatically from these averages and 2015-20J will be priced Thursday, October 8 and fund on Wednesday, October 14.
September 28, 2015
Does this range look familiar?
The gap between the 50-day and 200-day Moving Average continues to shrink as the on-again, off-again shift in Fed policy keeps the market offsides. At the conclusion of the FOMC’s meeting on September 17, the near unanimous vote of 9-1 to not change policy spurred a risk-off move for Treasury yields to decline, only to reverse course late last week after Chairwoman Yellen spoke in Amherst and stated that she fully expects a rate hike this year. Reference was made to a recovering US economy, whose 2Q GDP was revised up to 3.9%, improved from a 1Q reading of 0.6%. Capturing our uneven recovery was a WSJ article headlined: Slow down, Surge forth, Grow steadily, Repeat.

Weakening global growth was included in the recent FOMC announcement with China prominently mentioned. Emphasis for that concern was last week’s China Purchasing Manager’s Index reading that was its lowest since the financial crisis.
Even the Germans?
It remains to be seen what impact Volkswagen’s emission control violation will have on the company, but heavy fines and customer pushback certainly will follow. A car maker with 600,000 employees, and countless thousands more for its suppliers, will not fare as badly as America’s car makers did in 2008 but VW will experience a slowdown. Just this morning, Switzerland announced it is contemplating a ban on VW diesel cars.
Not just China
State Administration for Foreign Exchange (SAFE) is China’s investment manager and they have withdrawn tens of billions of dollars from global funds in support of their weakening economy, and now Saudi Arabia Monetary Authority (SAMA) has also been identified as having withdrawn up to $70 billion in reserves since the onset of declining oil prices. Its purpose, too, is to support a weakening economy. These withdrawals can partly explain why rates have not sustained a stronger push lower, but these sales are being met with demand from other buyers which is what is keeping us in this range.
Cash is King!
Yes, keeping your assets in cash, earning nothing, has outperformed most other global choices so far this year, and if you trade FX in your personal account, you were the big winner.
| Cash | Stocks | Bonds | Commodities | $ US |
| Flat | -6% | -2.9% | -17% | +6% |
The week ahead
All eyes on Congress to see if government business goes on after Wednesday at midnight. As for economic data, the big event, as usual, is Friday’s Non-Farm Payroll report that is expected to match the twelve-month average of 212,000, with the Unemployment Rate unchanged at 5.1%.
September 21, 2015
The defensive trades in front of last week’s FOMC meeting proved unnecessary as global concerns outdid the modestly improved domestic indicators, leaving interest rate policy unchanged. The CT-10 weekly chart shows its rate moving higher into Thursday’s announcement only to rally at week’s end, closing 7.5 bps lower than when we last priced on September 10th.

What does the decision mean?
The wording of the announcement identified global concerns, read China and its impact on emerging markets, as a consideration for not changing policy. The Fed has focused on full employment as the engine to drive higher interest rates but has now introduced an international perspective for its consideration and that further clouds the transparency for Fed policy. Chairwoman Yellen was candid about emerging market weakness and cautioned about the risk of an abrupt slowdown in China. Abrupt slowdown or just gradual weakening of Chinese GDP the impact is widely felt since they are the biggest trading partner for emerging market economies. Its reduced demand for raw materials impacts commodity prices and foreign exchange rates resulting in weaker global growth.
Speaking of lower community prices, they are impacting domestic Gas and Oil businesses which are filing for bankruptcy at a rate of 4.8%, the sector’s highest level since 1999 and double the rate of businesses in general. The volume of defaulted bonds YTD stands at $10.4 billion and yields in this sector of the junk bond market are as high as 11%.
CT-10’s closing rate of 2.135% is its 200-day Moving Average and represents a rate the market has frequently settled at in weakness and strength going back four-months. Indications are that we will remain with this low rate sentiment as the Fed exercises increased patience before normalizing monetary policy.
Even their modest projections seem inflated as officials still maintain a 2015 rate hike is probable. Here is the schedule of projected federal funds rates:
| 2015 | .375% |
| 2016 | 1.4% |
| 2017 | 2.6% |
| 2018 | 3.4% |
| Long-run | 3.5% |
The .375% projection for 2015 assumes a 25 bps increase in the next three months and then little else if the Fed is to maintain the gradual path they have advertised.
20-year Debenture rates and spreads
If we are going to see this 2.135% Treasury rate serve as a magnet until the Fed is confident of the global market’s tolerance for higher rates we might see our debenture rate hold near its two most rent levels of 2.82%, compared to our twelve-month average rate of 2.73%. The challenge will be to maintain historical pricing spreads because that is where investors will demand more for their participation. - at +60 to Swaps 2015-20I was 15 bps wide to its twelve-month average.
September 14, 2015
The market gyrated slightly last week as it anticipates a possible rate hike this Thursday afternoon.

CT-10 ended the week off 7 bps but slightly improved from when we priced 20-I on Thursday and equities regained strength as Chinese markets stabilized.
Supply was met by demand
Last week saw a robust funding calendar as not only did Treasury conduct its quarterly funding of 3, 10, and 30 year maturities ($64 billion) but on Wednesday alone the market digested $28 billion of Treasury and High Grade new issuance. Helping to distribute the credit debt was wider pricing spreads as High Grade investors seek more yield in a market that has generated negative (-0.63%) returns YTD.
Last week's economic data
Reports were pretty light but encouraging. Though Producer Prices came in flat that number was dragged down by lower gas prices. 2QGDP was revised upward for a second time to +3.7%, a reading that shows a nice recovery from a sluggish first quarter.
Nothing else to look at
Thursday afternoon at 2:00 the FOMC will provide a Summary of Economic Projections to be followed by a press conference with Janet Yellen. There is potential for market movement leading up to this event but shy of dramatic change in China the rates market can be expected to mark time.
And then?
It’s questionable what impact a rate hike will have since the Committee’s approach to the first increase since 2006 is expected to be a singular event for 2016, and the subsequent path of increases has been advertised to be gradual. The front end of the curve has already adjusted and Treasury debt remains cheap to other sovereign issuers as displayed in this chart:
| USA | Germany | Japan | Switzerland |
| 2.19% | 0.65% | 0.35% | -0.13% |
So, even with China having been a seller of Treasury debt to raise $US with which to support its currency in FX trading, bond funds continue to see demand and other central banks also continue to invest in US debt. And yes, investors continue to pay the Swiss to hold their money for ten-years.
Barbara Vohryzek had a special bond with someone that dates back as long as she was involved with the 504 program and posted me Saturday that he had died. Roland Cook is that person, a name that many people currently involved with the SBA 504 program might not be familiar with, but in addition to being an architect for the program back in 1986 he was also a mentor to me when I was trading the product at Merrill Lynch and would occasionally forget which week of the month the sale was scheduled. Roland also served as a resource to Steve Van Order during his first tenure with the program and we both maintained a relationship and visits with him.Prior to becoming the first Fiscal Agent for the 504 program Roland had a distinguished career at the Treasury and then Fannie Mae. His expertise in government bonds and mortgage-backed passthrough securities (then considered still a bit exotic) uniquely prepared him to design the securitization process for the 504 program. That process has stood the test of time, especially through crisis after crisis since 1986.
In 1983 while at Fannie Mae, Roland interviewed a quite young Steve-VO for an entry-level position. On his sparse resume Steve indicated he played the electric bass. An avid fisherman with a sharp sense of humor, Roland flustered Steve by asking him “Just what is an electric bass?” “Bass” of course was pronounced like the fish. Steve still remembers the little smile on Roland’s face as he asked the question. Much sputtering ensued. Somehow, Steve got the job and proceeded to learn a lot from Roland about how to study bonds and how to conduct oneself in the market.
Roland brought to market the program’s first and smallest issue of $7,087,000 in November 1986 and passed away as the program is about to launch its largest sale ever of nearly $1.3 billion. He was principled, intelligent, and always a presence – he will be missed.
+ 980-299-0193
+ 908-875-6813
Eagle Compliance504 ©
ALL RIGHTS RESERVED.
Free Support
QUick Links